Note
Access to this page requires authorization. You can try signing in or changing directories.
Access to this page requires authorization. You can try changing directories.
This article outlines how to monitor the copy activity execution in pipelines.
Monitor visually
You can monitor all of your pipeline runs natively in the user experience. Learn about monitoring in general from monitor a pipeline run.
To monitor the Copy activity run, go to the Data Factory UI for your service instance. On the Monitor tab, you see a list of item runs, select the pipeline name link to access the list of activity runs in the pipeline run.

Besides, you can select View run history under Run tab in your pipeline, and select the pipeline name link to access the list of activity runs.
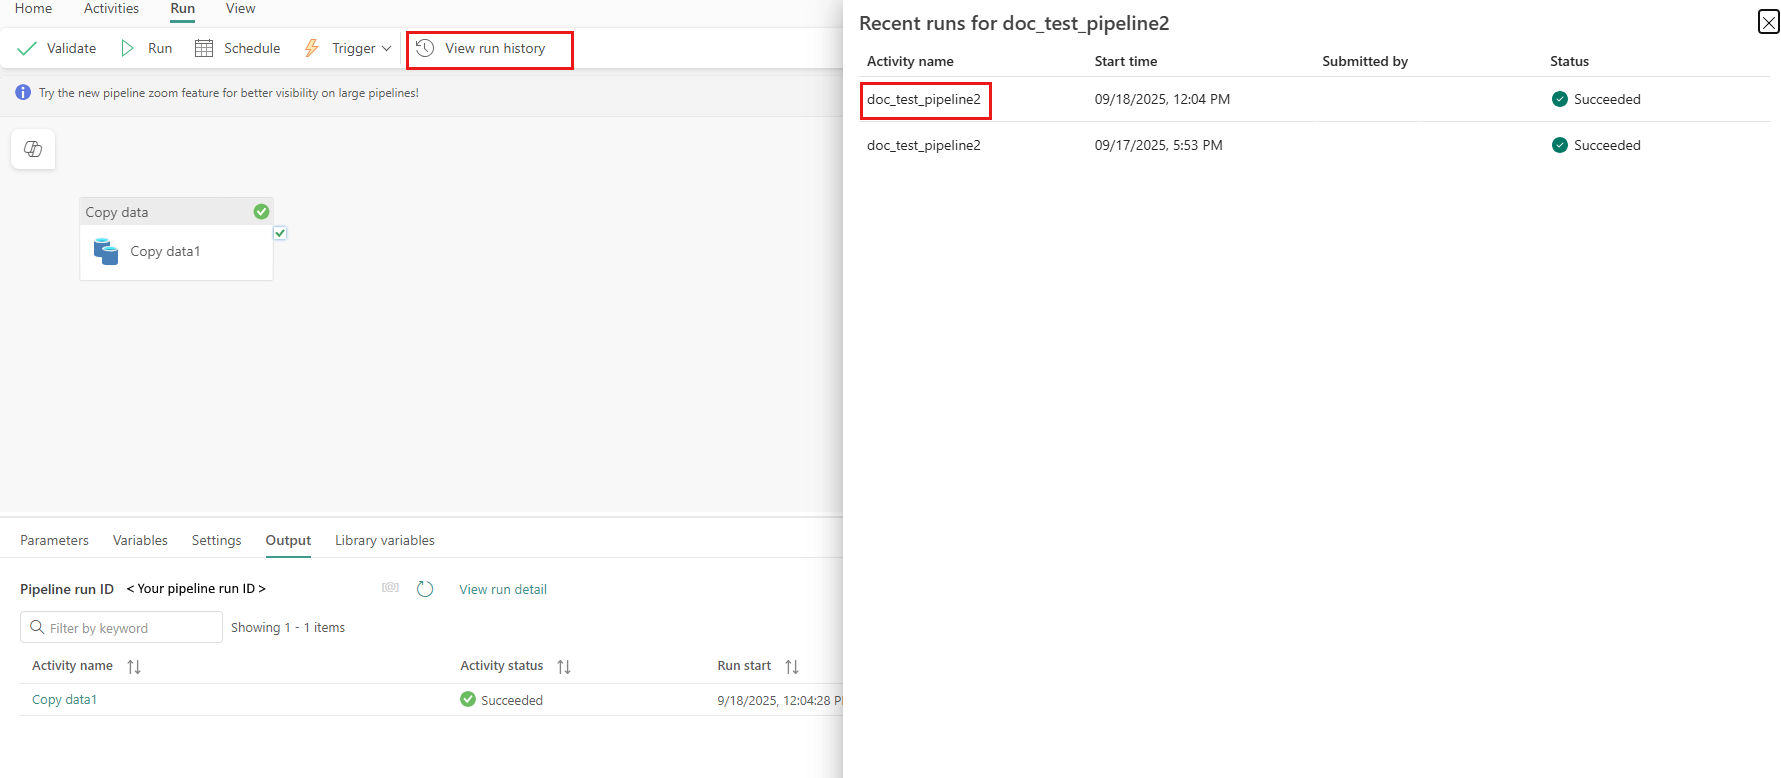
At this level, you can see links to copy activity input, output, and errors (if the Copy activity run fails), as well as statistics like duration/status. Clicking the copy activity name will give you deep details on your copy activity execution.

In this graphical monitoring view, the service presents you the copy activity execution information, including data read/written volume, number of files/rows of data copied from source to destination, throughput, the configurations applied for your copy scenario, steps the copy activity goes through with corresponding durations and details, and more. Refer to this table on each possible metric and its detailed description.
In some scenarios, when you run a Copy activity, you'll see "Performance tuning tips" at the top of the copy activity monitoring view as shown in the example. The tips tell you the bottleneck identified by the service for the specific copy run, along with suggestion on what to change to boost copy throughput.
The bottom execution details and durations describe the key steps your copy activity goes through, which is especially useful for troubleshooting the copy performance. The bottleneck of your copy run is the one with the longest duration. For how to improve the performance, go to Copy activity performance and scalability guide.
Example: Copy from Lakehouse to Data Warehouse

Monitor Copy activity programmatically
Copy activity execution details and performance characteristics are also returned in the Activity runs > Output section, which is used to render the UI monitoring view. Following is a complete list of properties that might be returned. You'll see only the properties that are applicable to your copy scenario.
| Property name | Description | Unit in output |
|---|---|---|
| dataRead | The actual amount of data read from the source. | Int64 value, in bytes |
| dataWritten | The actual mount of data written/committed to the destination. The size might be different from dataRead size, as it relates how each data store stores the data. |
Int64 value, in bytes |
| filesRead | The number of files read from the file-based source. | Int64 value (no unit) |
| filesWritten | The number of files written/committed to the file-based destination. | Int64 value (no unit) |
| filesSkipped | The number of files skipped from the file-based source. | Int64 value (no unit) |
| dataConsistencyVerification | Details of data consistency verification where you can see if your copied data has been verified to be consistent between source and destination store. | Array |
| sourcePeakConnections | Peak number of concurrent connections established to the source data store during the Copy activity run. | Int64 value (no unit) |
| sinkPeakConnections | Peak number of concurrent connections established to the destination data store during the Copy activity run. | Int64 value (no unit) |
| rowsRead | Number of rows read from the source. This metric does not apply when copying files as-is without parsing them due to the performance optimization that the service applies to. | Int64 value (no unit) |
| rowsCopied | Number of rows copied to destination. This metric does not apply when copying files as-is without parsing them due to the performance optimization that the service applies to. | Int64 value (no unit) |
| rowsSkipped | Number of incompatible rows that were skipped. You can enable incompatible rows to be skipped by setting enableSkipIncompatibleRow to true. |
Int64 value (no unit) |
| copyDuration | Duration of the copy run. | Int32 value, in seconds |
| throughput | Rate of data transfer, calculated by dataRead divided by copyDuration. |
Floating point number, in KBps |
| sourcePeakConnections | Peak number of concurrent connections established to the source data store during the Copy activity run. | Int32 value (no unit) |
| sinkPeakConnections | Peak number of concurrent connections established to the destination data store during the Copy activity run. | Int32 value (no unit) |
| sqlDwPolyBase | Whether PolyBase is used when data is copied into Azure Synapse Analytics. | Boolean |
| redshiftUnload | Whether UNLOAD is used when data is copied from Redshift. | Boolean |
| hdfsDistcp | Whether DistCp is used when data is copied from HDFS. | Boolean |
| usedDataIntegrationUnits | The effective Data Integration Units during copy. | Int32 value |
| usedParallelCopies | The effective parallelCopies during copy. | Int32 value |
| logPath | Path to the session log of skipped data in the blob storage. | Text (string) |
| executionDetails | More details on the stages the Copy activity goes through and the corresponding steps, durations, configurations, and so on. We don't recommend that you parse this section because it might change. To better understand how it helps you understand and troubleshoot copy performance, refer to Monitor visually section. | Array |
| perfRecommendation | Copy performance tuning tips. | Array |