Note
Access to this page requires authorization. You can try signing in or changing directories.
Access to this page requires authorization. You can try changing directories.
After you execute a Copy job in Data Factory for Microsoft Fabric, you can monitor its progress and metrics through either the Copy job panel or the Monitoring hub in Data Factory. The Monitoring hub acts as a centralized portal for reviewing all Copy job runs.
Monitor in the Copy job panel
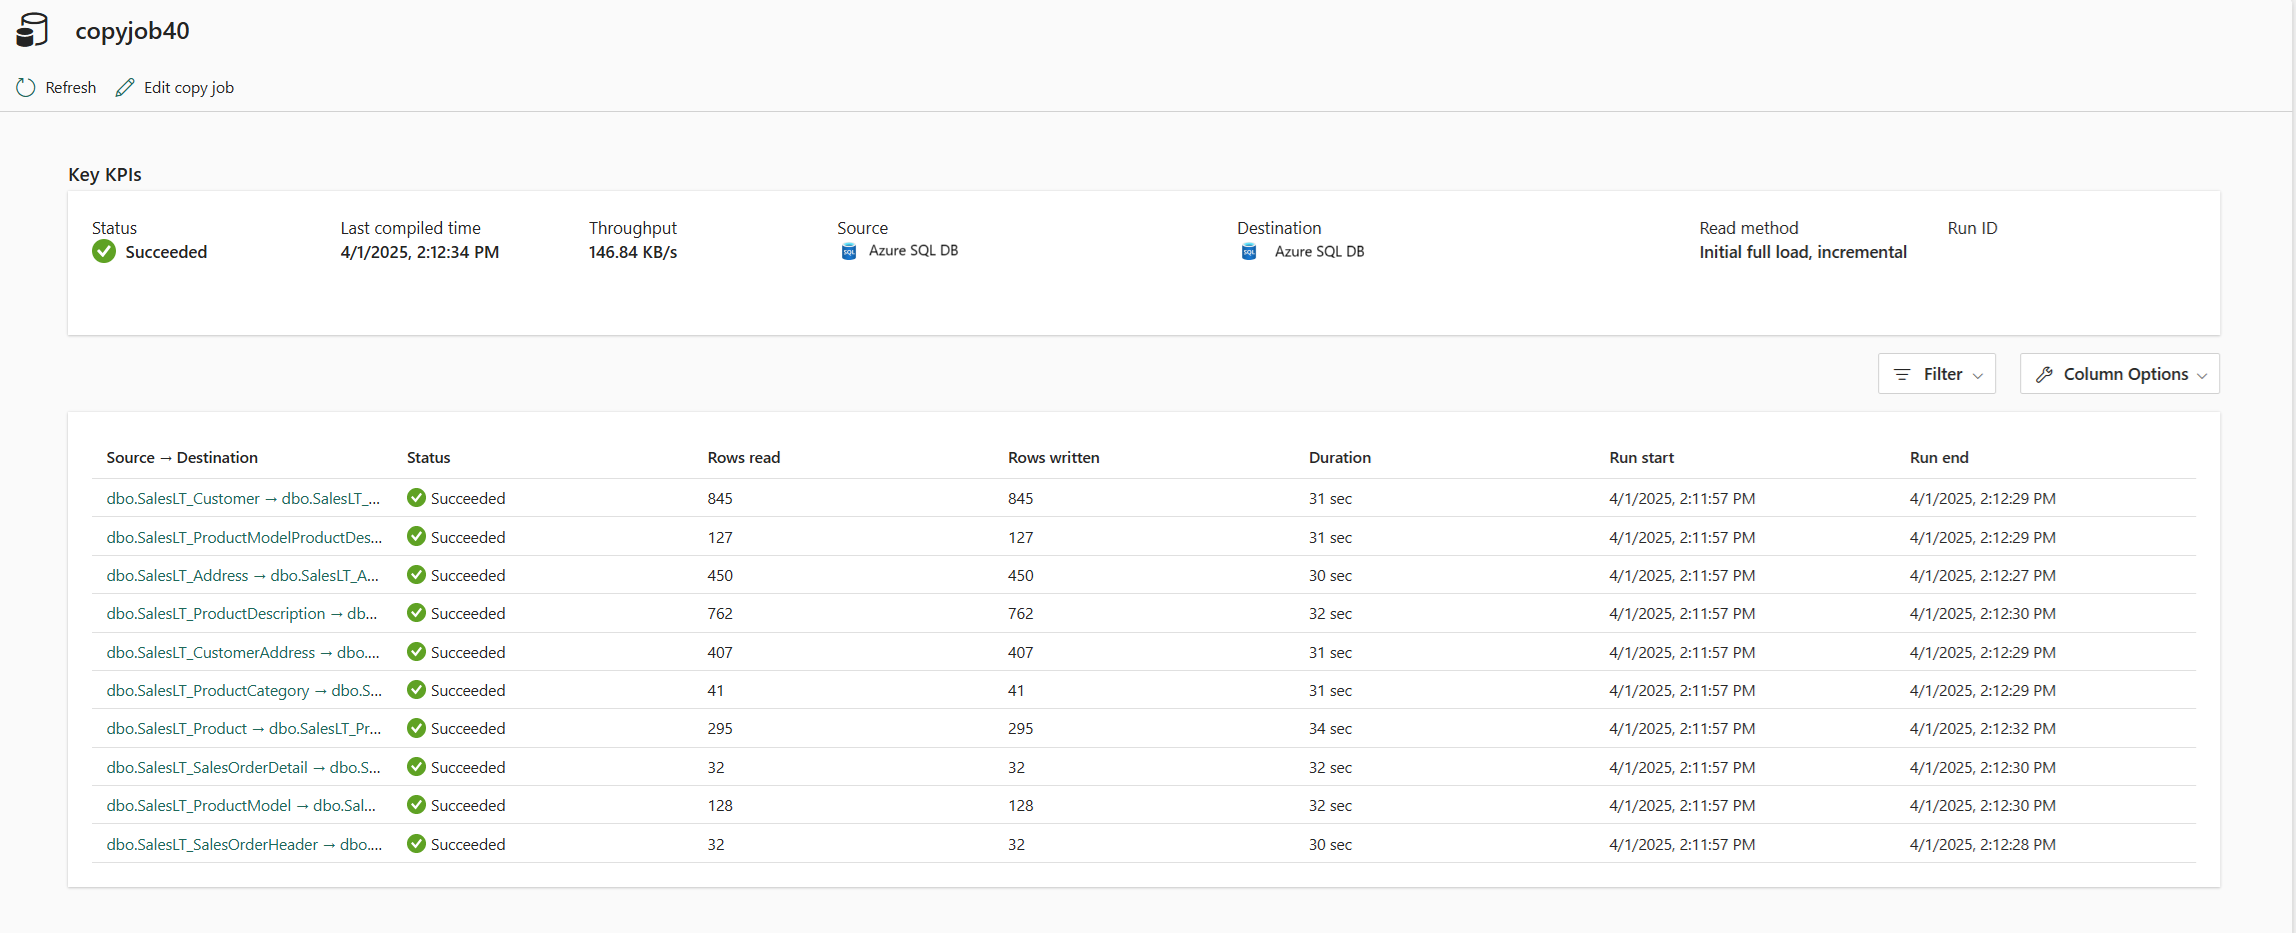
After you initiate a Copy job, you can immediately track its progress and metrics in its job panel. The display consistently shows data from the most recent runs, reporting on the following metrics:
- Status
- Row read
- Row written
- Throughput

Tip
Select More to view the Copy Job Run ID, which can be used to create a support ticket, if needed.
You can also see a list of the items being copied in the job, with the following individual table metrics reported for each item:
- Source and destination names
- Status
- Rows read
- Rows written
- Files read
- Files written
- Data read
- Data written
- Duration
- Run start
- Run stop
- Throughput

Select any name to view its real-time progress.

You can also select View run history to see a list of prior runs:


Monitor in the Monitoring hub
The Monitoring hub serves as a central portal for overseeing all your Copy job runs. There are two ways to access the Monitoring hub:
On the main Fabric navigation pane on the left of the Fabric site, select Monitor.
Select the View run history button in the Copy job panel and select Go to Monitor:


Either of these links bring you to the Monitoring hub, where you can see a list of all Copy jobs and their runs:

Select any job to view its details, including source, destination, duration, and data read and written.