Note
Access to this page requires authorization. You can try signing in or changing directories.
Access to this page requires authorization. You can try changing directories.
Applies to: ✅ SQL analytics endpoint in Microsoft Fabric
In this tutorial, you learn how to build a Microsoft Fabric Pipeline to perform intelligent table maintenance.
This solution calls the sys.sp_get_table_health_metrics T-SQL stored procedure on the Lakehouse SQL analytics endpoint, evaluates the result, and runs OPTIMIZE only when the table actually needs maintenance. This "check-then-act" pattern prevents unnecessary compute spend on healthy tables while ensuring degraded tables are maintained automatically.
Why maintenance is necessary
Lakehouse tables can accumulate too many small Parquet files over time, which hurts query performance on the SQL analytics endpoint.
Rather than running OPTIMIZE on a fixed schedule regardless of table state, this pipeline makes an informed decision: it checks the table's health first, and only triggers optimization when an anomaly is detected.
Prerequisites
Before you begin, make sure you have:
- A Microsoft Fabric workspace with contributor or higher permissions.
- A Lakehouse in that workspace containing at least one Delta table you want to monitor. This tutorial uses a Lakehouse named
SalesDataLakehouse. - Familiarity with Fabric data pipelines.
- Familiarity with Fabric notebooks.
Solution structure
The completed pipeline has this structure:
- Script activity: Executes
sp_get_table_health_metricsagainst the target table and returns table-health metrics as structured output. - If Condition activity: Reads
PotentialAnomalyTypedirectly from the Script output and checks if it's greater than zero. For more information on thePotentialAnomalyType, see Potential anomaly type codes. - Notebook activity (inside the True branch): Runs
OPTIMIZEon the table from a Spark notebook.
At the end of this tutorial, you will have a notebook that takes parameters from the pipeline and optimizes a table when triggered.
Step 1: Create the optimization notebook
The notebook accepts the target Lakehouse, schema, and table name as parameters from the pipeline, then executes OPTIMIZE using Spark SQL.
- In your Fabric workspace, select + New item > Notebook.
- Name the notebook Optimize-Table.
- Under Location, select the Lakehouse where the tables that you check are stored. This exercise uses a Lakehouse named
SalesDataLakehouse. - Select Create.
Add the parameter cell
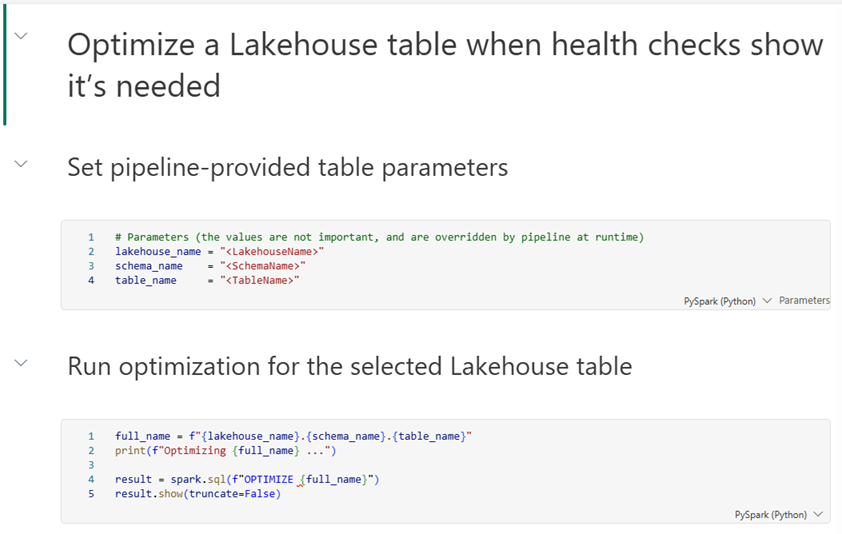
The first cell defines the variables that the pipeline overrides at runtime.
In the first cell, enter the following parameters. The values aren't important, and the pipeline overrides them at runtime.
# Parameters
lakehouse_name = "<LakehouseName>"
schema_name    = "<SchemaName>"
table_name     = "<TableName>"
Important
How parameterization works in Fabric notebooks: At runtime, Fabric injects a new cell immediately after the parameter cell that reassigns these variables with the values passed by the pipeline. The values you set here only initialize the variables and improve readability.
Select the cell menu (...) > Toggle parameter cell to mark this cell as a parameter cell.
Add the OPTIMIZE cell
The OPTIMIZE command is a Spark SQL command, not a T-SQL command. You must run it in Spark environments such as notebooks, Spark job definitions, or the Lakehouse Maintenance interface. The SQL analytics endpoint and Warehouse SQL query editor don't support this command directly.
In the second cell, enter:
full_name = f"{lakehouse_name}.{schema_name}.{table_name}"
print(f"Optimizing {full_name} ...")

result = spark.sql(f"OPTIMIZE {full_name}")
result.show(truncate=False)
Add Markdown cells as needed to properly document the notebook for other users. Your finalized notebook should look something like the following:

Note
This example considers a Lakehouse with schemas enabled. Adjust the three-part name on full_name accordingly if you don't use Lakehouse schemas.
Step 2: Create the pipeline
In your Fabric workspace, select + New item > Pipeline.
Name the pipeline Check-and-Optimize-Table.
Select the pipeline canvas background, and then open the Parameters tab. Add three parameters:
Name Type Default value lakehouse_nameString SalesDataLakehouseschema_nameString dbotable_nameString FactSales
Step 3: Add the Script activity
The Script activity runs sys.sp_get_table_health_metrics on the SQL analytics endpoint and captures the result.
Important
Use the Script activity, not the Stored procedure activity. Only the Script activity exposes the result set as structured JSON output that downstream activities can parse.
- From the Activities tab, select Script to add it onto the canvas.
- Name it Check Table Health.
- In the Settings tab:
Connection: Select the SQL analytics endpoint for your Lakehouse. If it isn't listed, select Browse all at the bottom of the dropdown list, and then locate your Lakehouse's SQL analytics endpoint.
Script type: Select Query.
Script: Select Add dynamic content and enter the following expression:
@concat('EXEC sys.sp_get_table_health_metrics ''',
        pipeline().parameters.schema_name, '.',
        pipeline().parameters.table_name, '''')
This expression produces the SQL command that executes the stored procedure against your target table, for example: EXEC sys.sp_get_table_health_metrics 'dbo.FactSales'.
Verify the script output
Run the pipeline once and inspect the Script activity output. You see a JSON object similar to:
{
  "resultSetCount": 1,
  "resultSets": [
    {
      "rowCount": 1,
      "rows": [
        {
          "PotentialAnomalyType": 3,
          "PotentialAnomalyDescription": "Too many small files...",
          "FileCount": 2688,
          "...": "..."
        }
      ]
    }
  ]
}
Important
Your actual result might vary based on the state of your table. The key is that it returns the columns exposed by sys.sp_get_table_health_metrics.
Step 4: Add the If Condition activity
The If Condition activity reads PotentialAnomalyType directly from the Script activity output and takes a decision based on its result. Use the following steps:
From the Activities tab, select If Condition to add an activity onto the canvas.
Name it Check Anomaly.
Draw a Success (green) arrow from Check Table Health to Check Anomaly.
In the Activities tab of the If Condition activity, set the Expression to:
@greater(int(activity('Check Table Health').output.resultSets[0].rows[0]['PotentialAnomalyType']), 0)
This expression reads the first row returned by sys.sp_get_table_health_metrics, casts PotentialAnomalyType to an integer, and evaluates to true when the value is greater than zero, which indicates an anomaly detected in the target table.
Step 5: Add the Notebook activity (True branch)
With the If Condition activity selected, select Edit (pencil icon) next to True. The canvas switches to a sub-canvas scoped to the True branch.
Drag a Notebook activity onto the True sub-canvas.
Name it Run OPTIMIZE.
In the Settings tab:
Notebook: Select the Optimize-Table notebook you created in Step 1.
Expand Base parameters, then add three rows:
Name Type Value lakehouse_nameString @pipeline().parameters.lakehouse_nameschema_nameString @pipeline().parameters.schema_nametable_nameString @pipeline().parameters.table_name
The three name column values must match the variable names in the notebook's parameter cell exactly.
Note
You can leave False activities empty. The If Condition activity treats an empty False branch as a no-op and reports the pipeline as succeeded.
Your completed pipeline should look like the following:

Step 6: Validate and run
Select Validate on the pipeline toolbar to check for configuration errors.
Select Run to execute the pipeline manually.
Monitor the run and confirm:
- Check table health: inspect the Output from this activity when it runs. You should see the output from the
sys.sp_get_table_health_metricsstored procedure in JSON format. - Check Anomaly: evaluates correctly by reading
PotentialAnomalyTypedirectly from the Script output. - Run OPTIMIZE (only if
PotentialAnomalyType > 0): if the Check Anomaly activity evaluates True, review the input of the Run OPTIMIZE activity to verify that it uses the correct parameters (Lakehouse name, schema, and table name) and check the output to review the messages from theOPTIMIZEoperation.
- Check table health: inspect the Output from this activity when it runs. You should see the output from the
Clean up resources
If you created resources only for this tutorial and no longer need them, delete the following items from your workspace:
- The Check-and-Optimize-Table pipeline.
- The Optimize-Table notebook.