Note
Access to this page requires authorization. You can try signing in or changing directories.
Access to this page requires authorization. You can try changing directories.
Applies to: ✅ SQL analytics endpoint, Warehouse, and Mirrored Database in Microsoft Fabric
This article describes how to use the visual query editor in the Microsoft Fabric portal to quickly and efficiently write queries. You can use the visual query editor for a no-code experience to create your queries.
- You can also query the data in your warehouse with multiple tools with a SQL connection string.
- You can use the SQL query editor to write T-SQL queries from the Microsoft Fabric portal.
- You can quickly view data in the Data preview.
Visual query editor in the Fabric portal
The visual query editor provides an easy visual interface to write queries against the data in your warehouse.
Once you've loaded data into your warehouse, you can use the visual query editor to create queries to analyze your data. There are two ways to get to the visual query editor:
In the ribbon, create a new query using the New visual query button, as shown in the following image.
To create a query, drag and drop tables from the Object explorer onto the canvas. To drag a table, select and hold the table until you see it's picked up from the Object explorer before dragging. Once you drag one or more tables onto the canvas, you can use the visual experience to design your queries. The warehouse editor uses the Power Query diagram view experience to enable you to easily query and analyze your data. Learn more about Power Query diagram view.
As you work on your visual query, the queries are automatically saved every few seconds. A "saving indicator" appears in your query tab to indicate that your query is being saved. All workspace users can save their queries in My queries folder. However, users in viewer role of the workspace or shared recipients of the warehouse are restricted from moving queries to Shared queries folder.
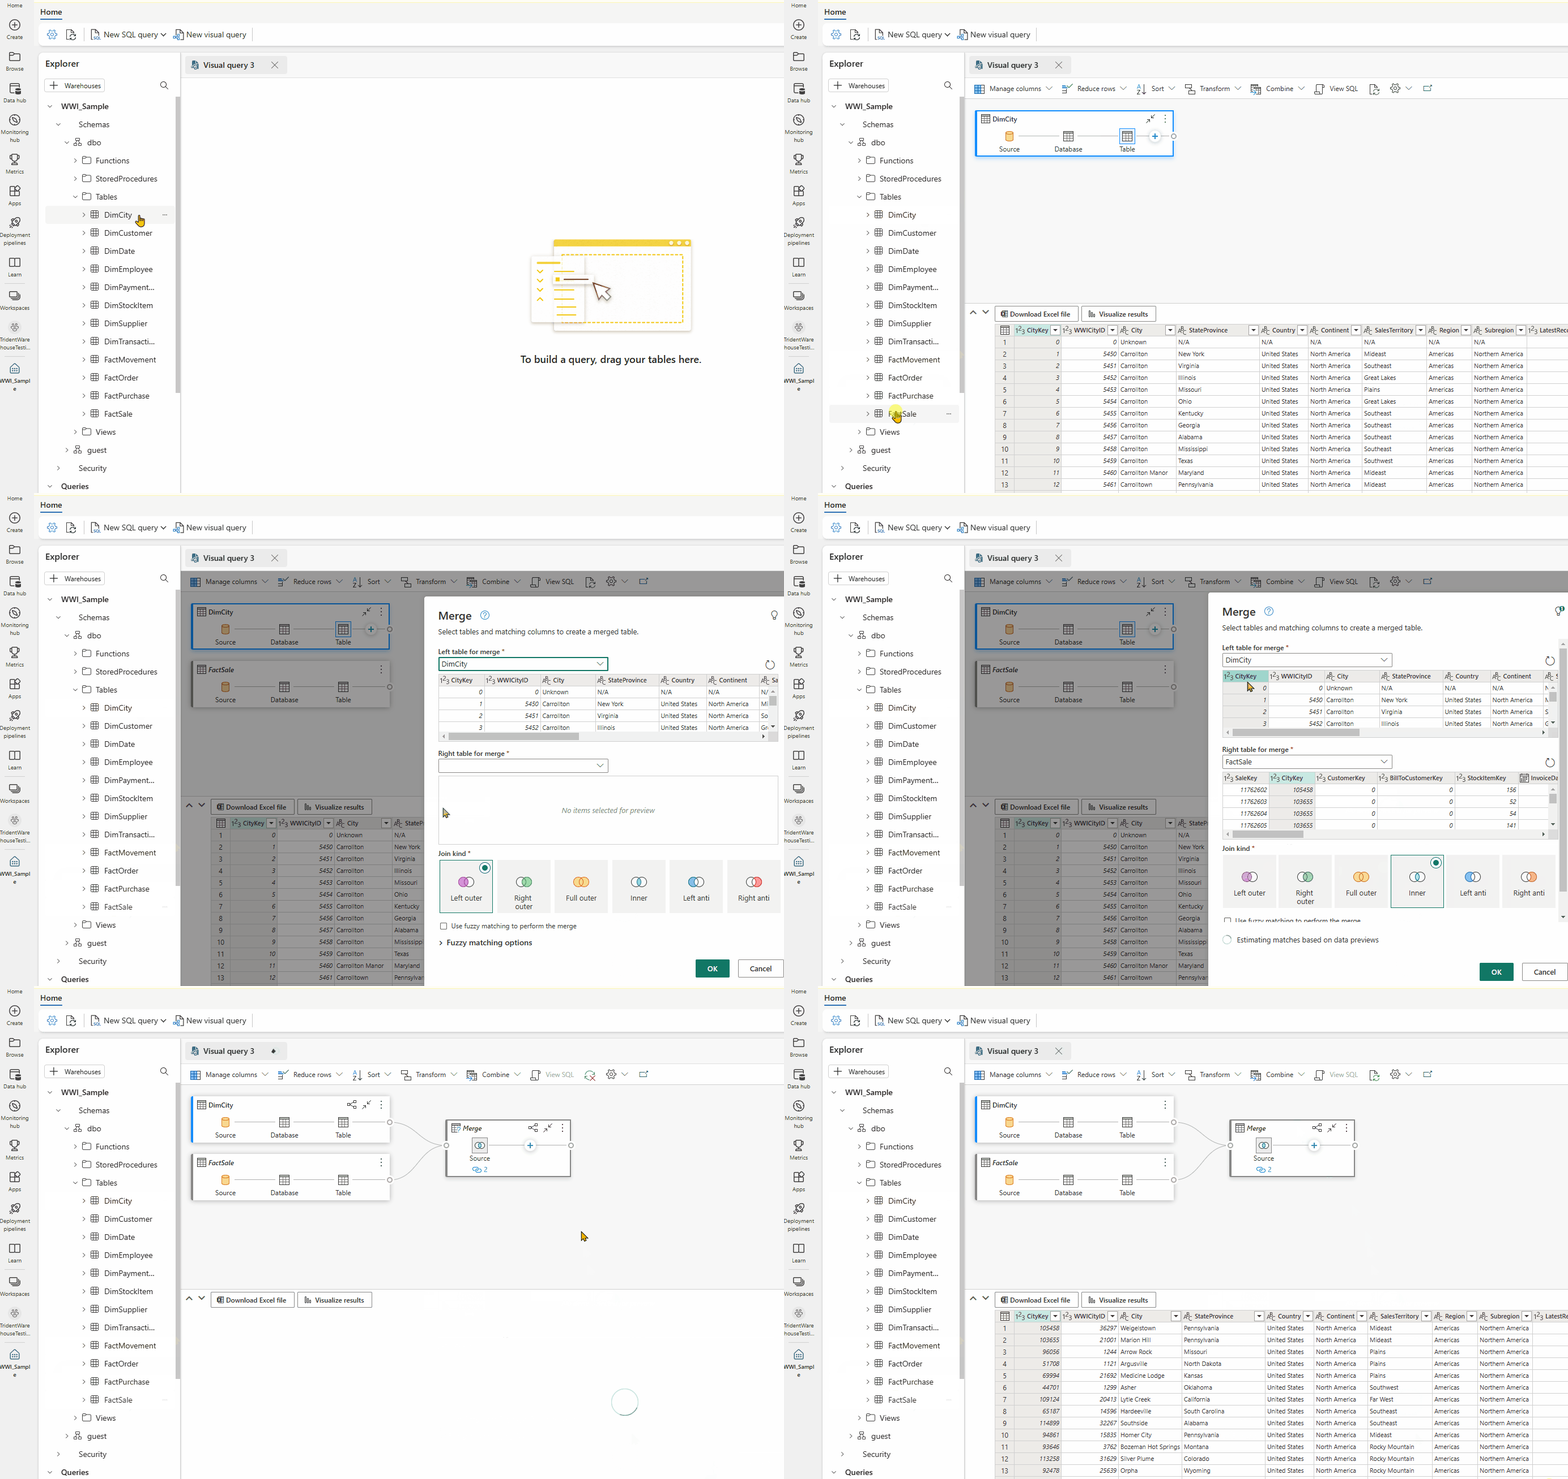
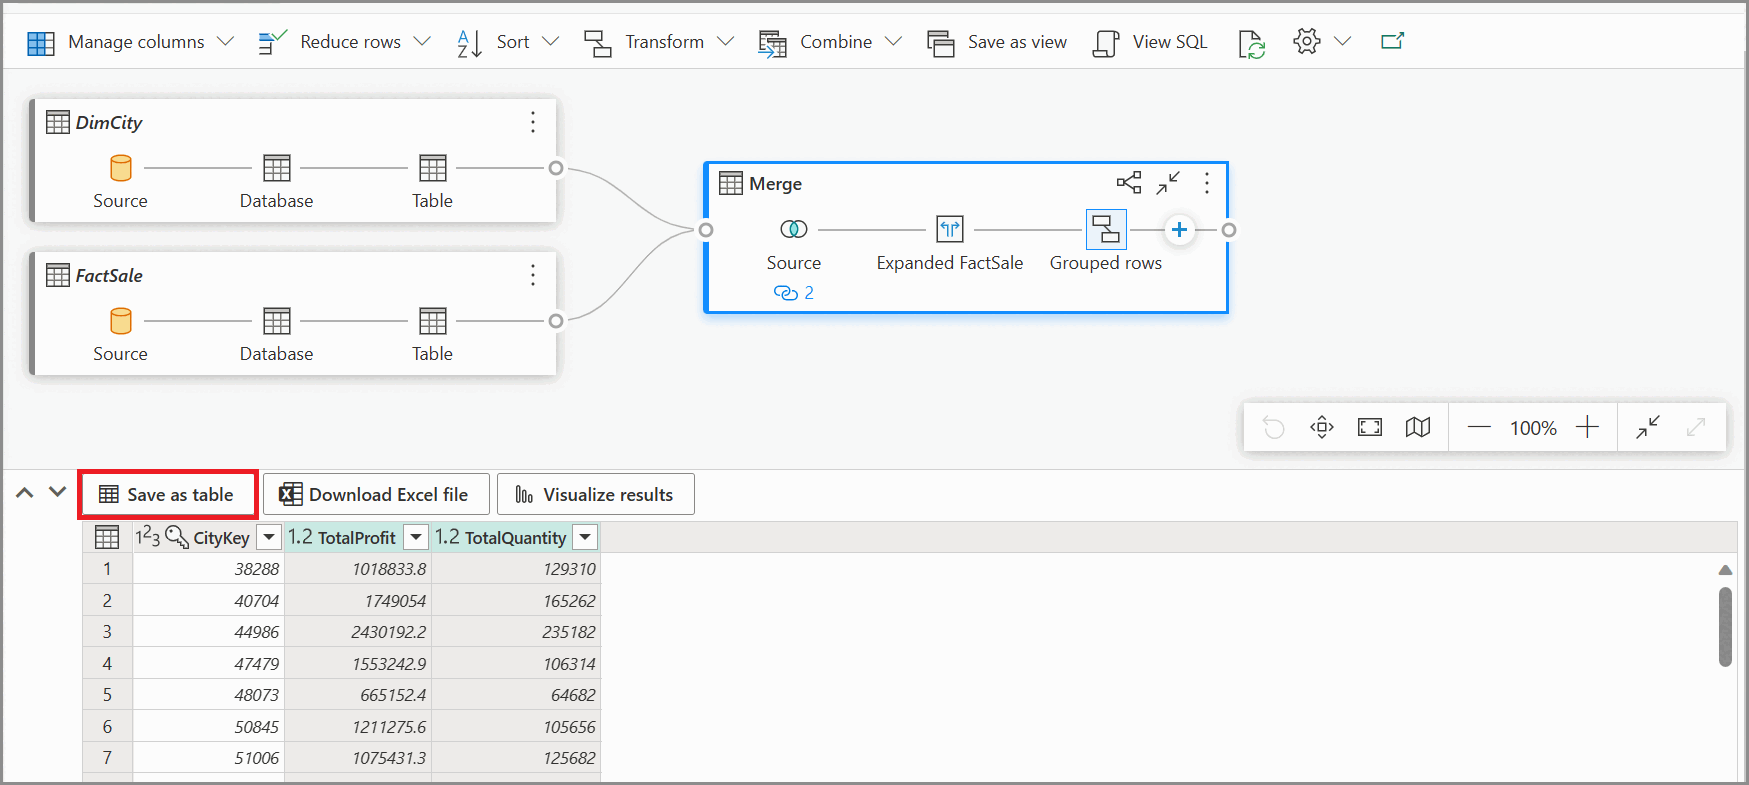
The following animated gif shows the merging of two tables using a no-code visual query editor.
The steps shown in the gif are:
- First, the table
DimCityis dragged from the Explorer into the blank new visual query editor. - Then, the table
FactSaleis dragged from the Explorer into the visual query editor. - In the visual query editor, in the content menu of
DimCity, the Merge queries as new Power Query operator is used to join them on a common key. - In the new Merge page, the
CityKeycolumn in each table is selected to be the common key. The Join kind is Inner. - The new Merge operator is added to the visual query editor.
- When you see results, you can use Download Excel file to view results in Excel or Visualize results to create report on results.
Save as view
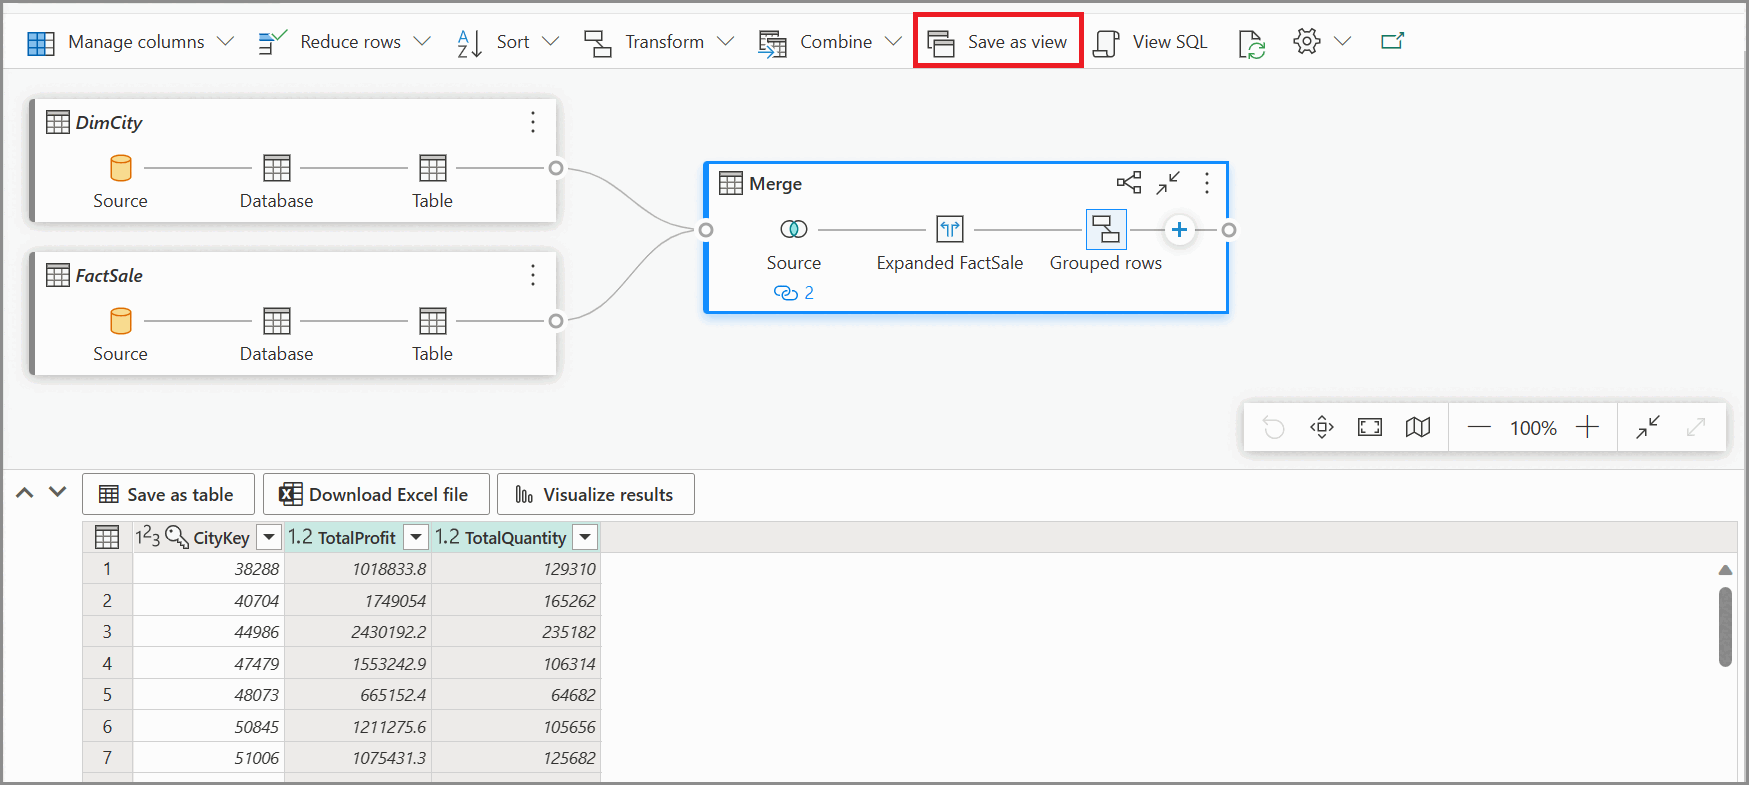
You can save your query as a view on which data load is enabled using the Save as view button. Select the schema name that you have access to create views, provide name of view and verify the SQL statement before confirming creating view. When view is successfully created, it appears in the Explorer.
View SQL
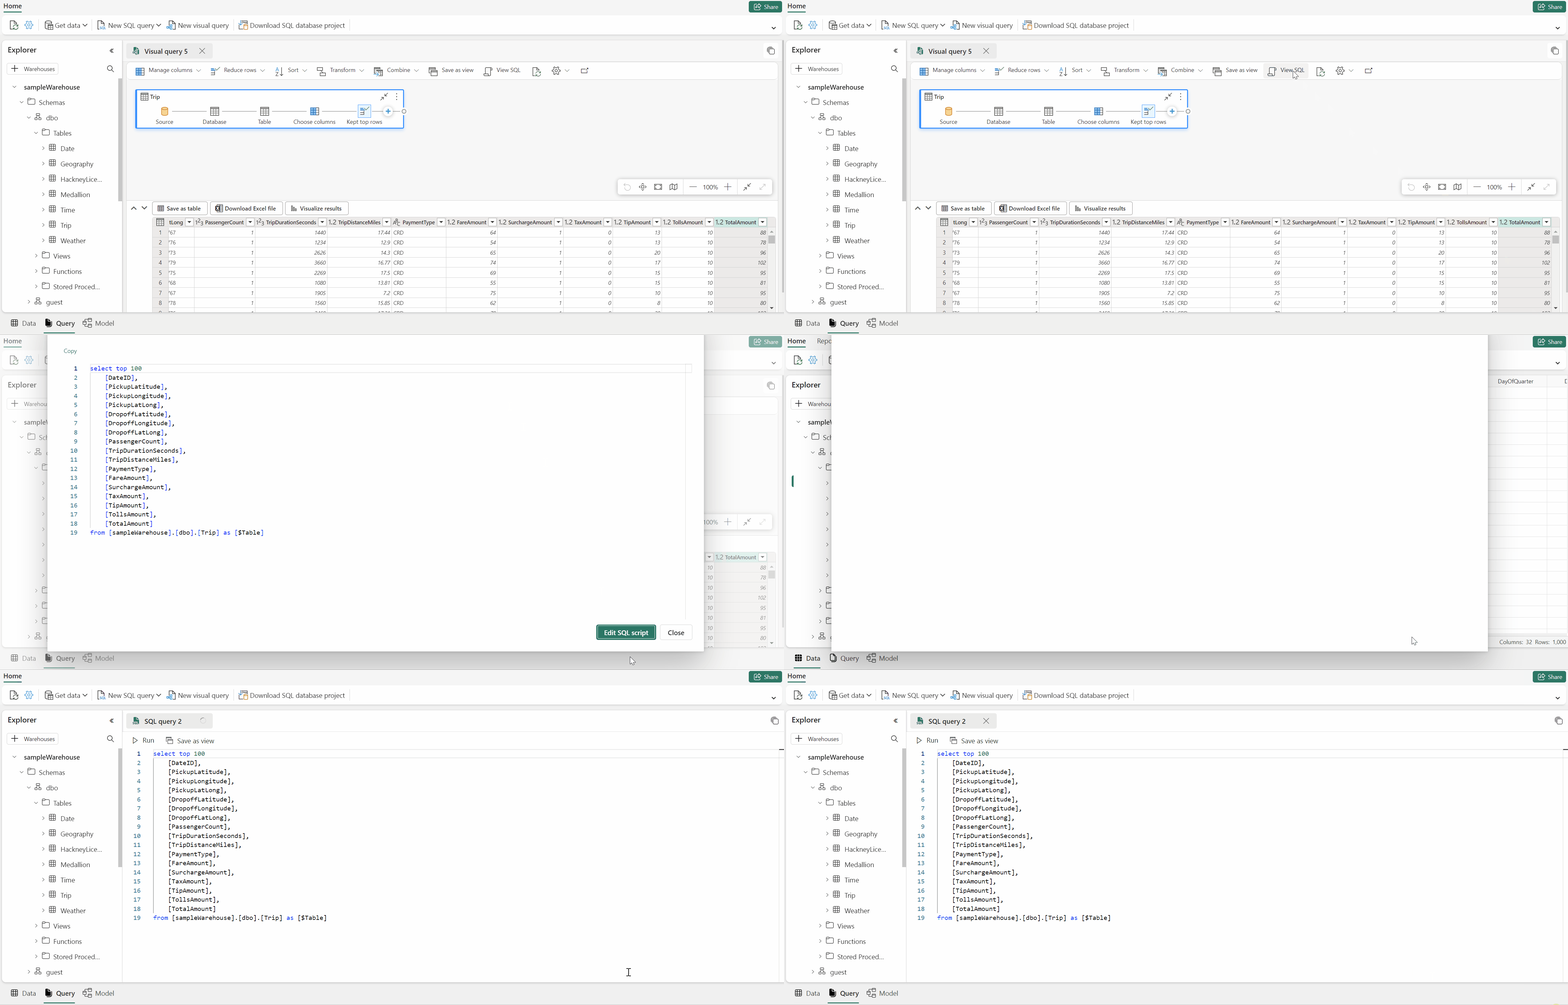
The View SQL feature allows you to see the SQL query based on the applied steps of your visual query.
Select View query to see the resulting T-SQL, and Edit SQL script to edit the SQL query in the query editor.
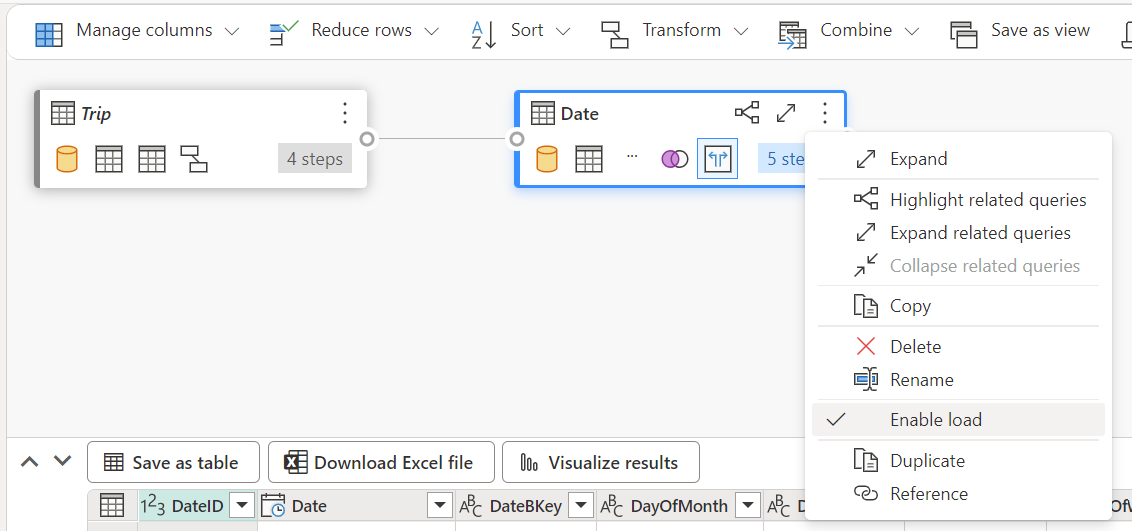
When writing queries that are joining two or more tables using the Merge queries action, the query that has load enabled will be reflected in the SQL script. To specify which table's query should be shown in the SQL script, select the context menu and then Enable load. Expand the table's columns that got merged in the results to see the steps reflected in the SQL script.
Save as table
You can use Save as table to save your query results into a table for the query with load enabled. Select the warehouse in which you would like to save results, select schema that you have access to create tables and provide table name to load results into the table using CREATE TABLE AS SELECT statement. When table is successfully created, it appears in the Explorer.
Create a cross-warehouse query in visual query editor
For more information on cross-warehouse querying, see Cross-warehouse querying.
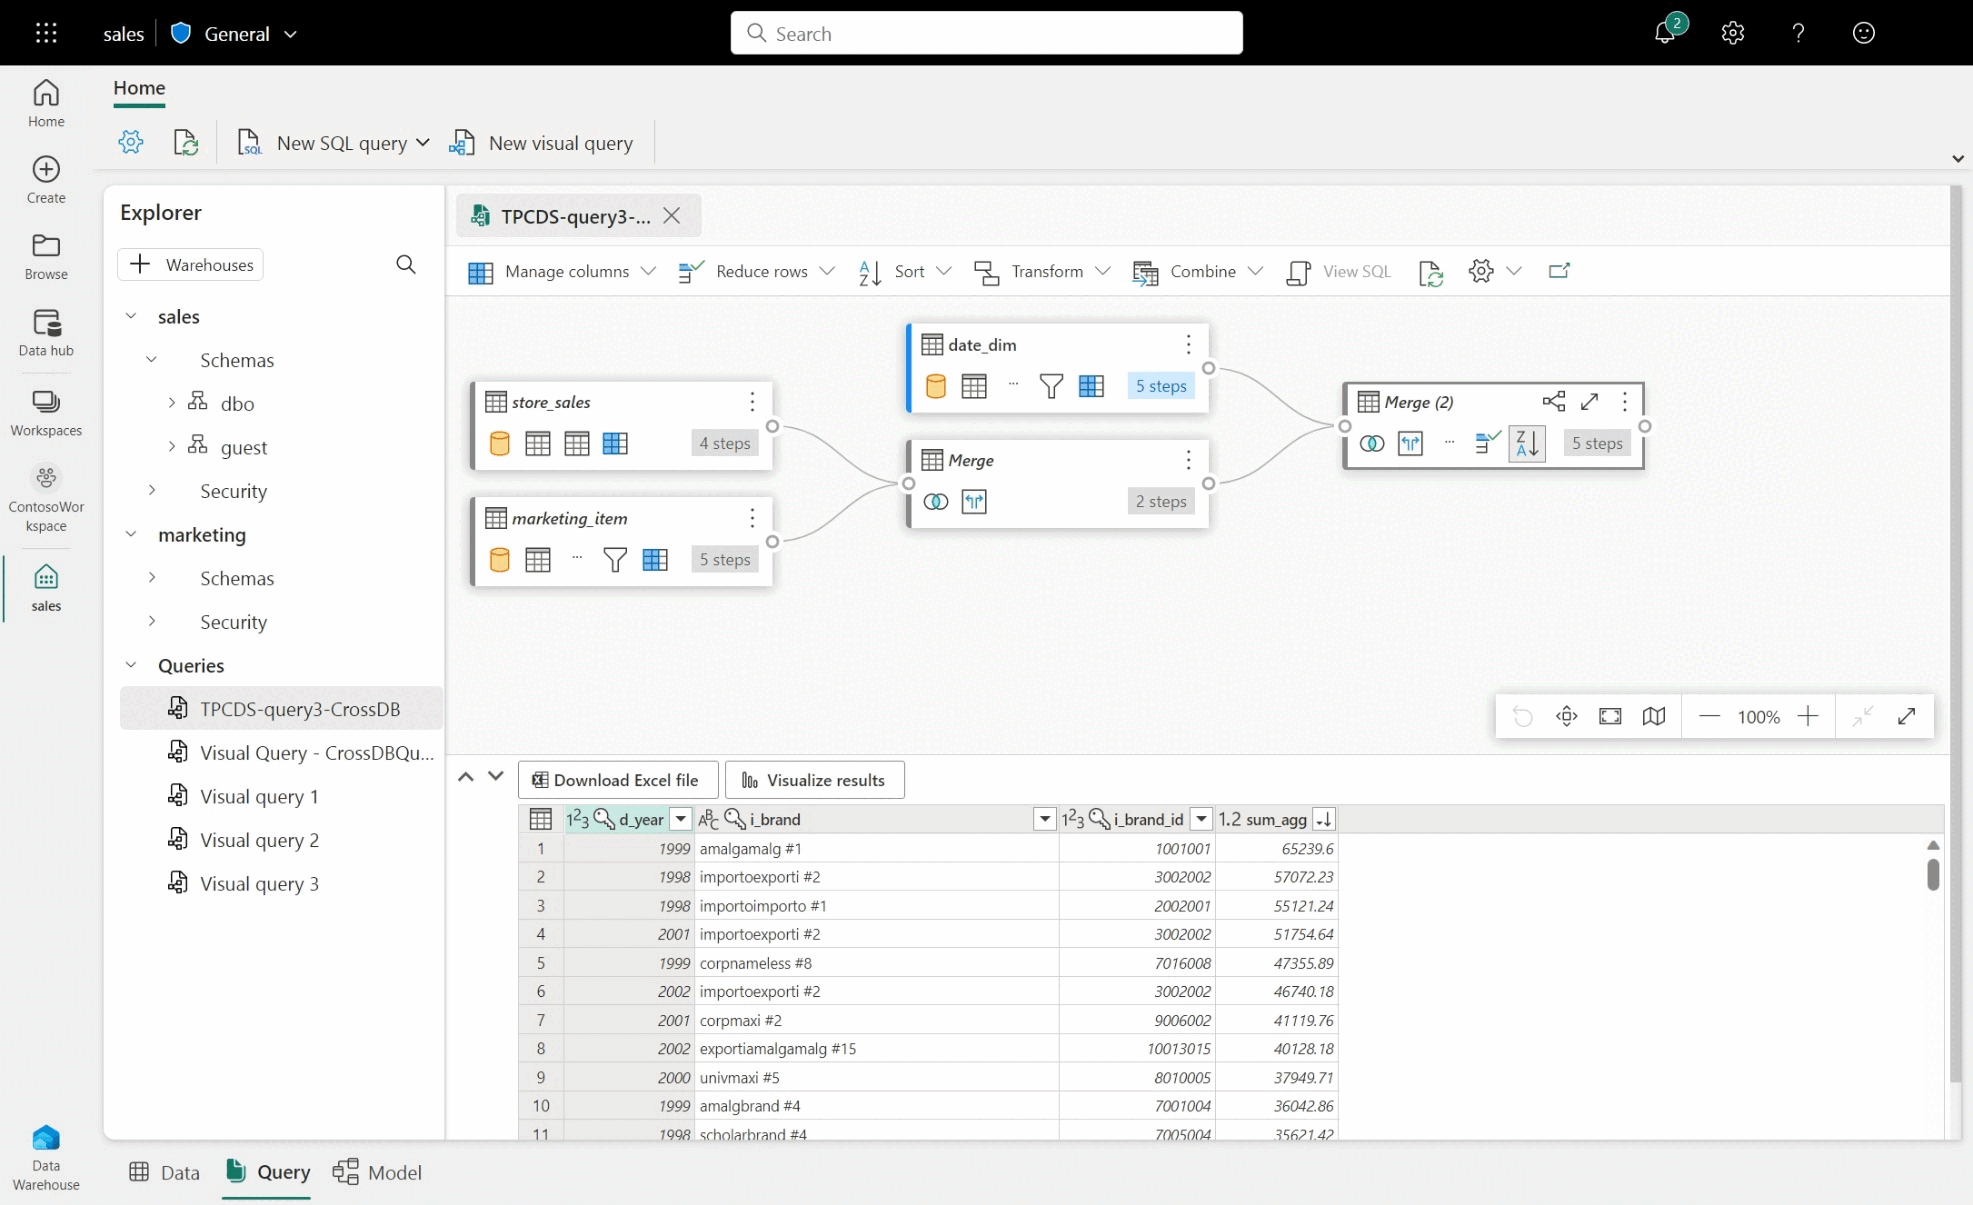
- To create a cross-warehouse query, drag and drop tables from added warehouses and add merge activity. For example, in the following image example,
store_salesis added fromsaleswarehouse and it's merged withitemtable frommarketingwarehouse.
Limitations with visual query editor
- In the visual query editor, you can only run DQL (Data Query Language) or read-only SELECT statements. DDL or DML statements are not supported.
- Only a subset of Power Query operations that support Query folding are currently supported.
- Visualize Results currently does not support SQL queries with an
ORDER BYclause. - When viewing SQL script joining two or more tables, only the table with load enabled selected will show the corresponding SQL script.
- There are certain steps that the View SQL feature does not support in which a banner in the visual query editor indicates stating "The query is not supported as a warehouse view, since it cannot be fully translated to SQL". For more information, see Query folding indicators in Power Query.
- Warehouses with very large schemas will take significantly longer because schema information is not cached and must be computed on demand. Warehouses with more than 750,000 combined objects—tables, views, and columns) are not supported for modeling.

