Note
Access to this page requires authorization. You can try signing in or changing directories.
Access to this page requires authorization. You can try changing directories.
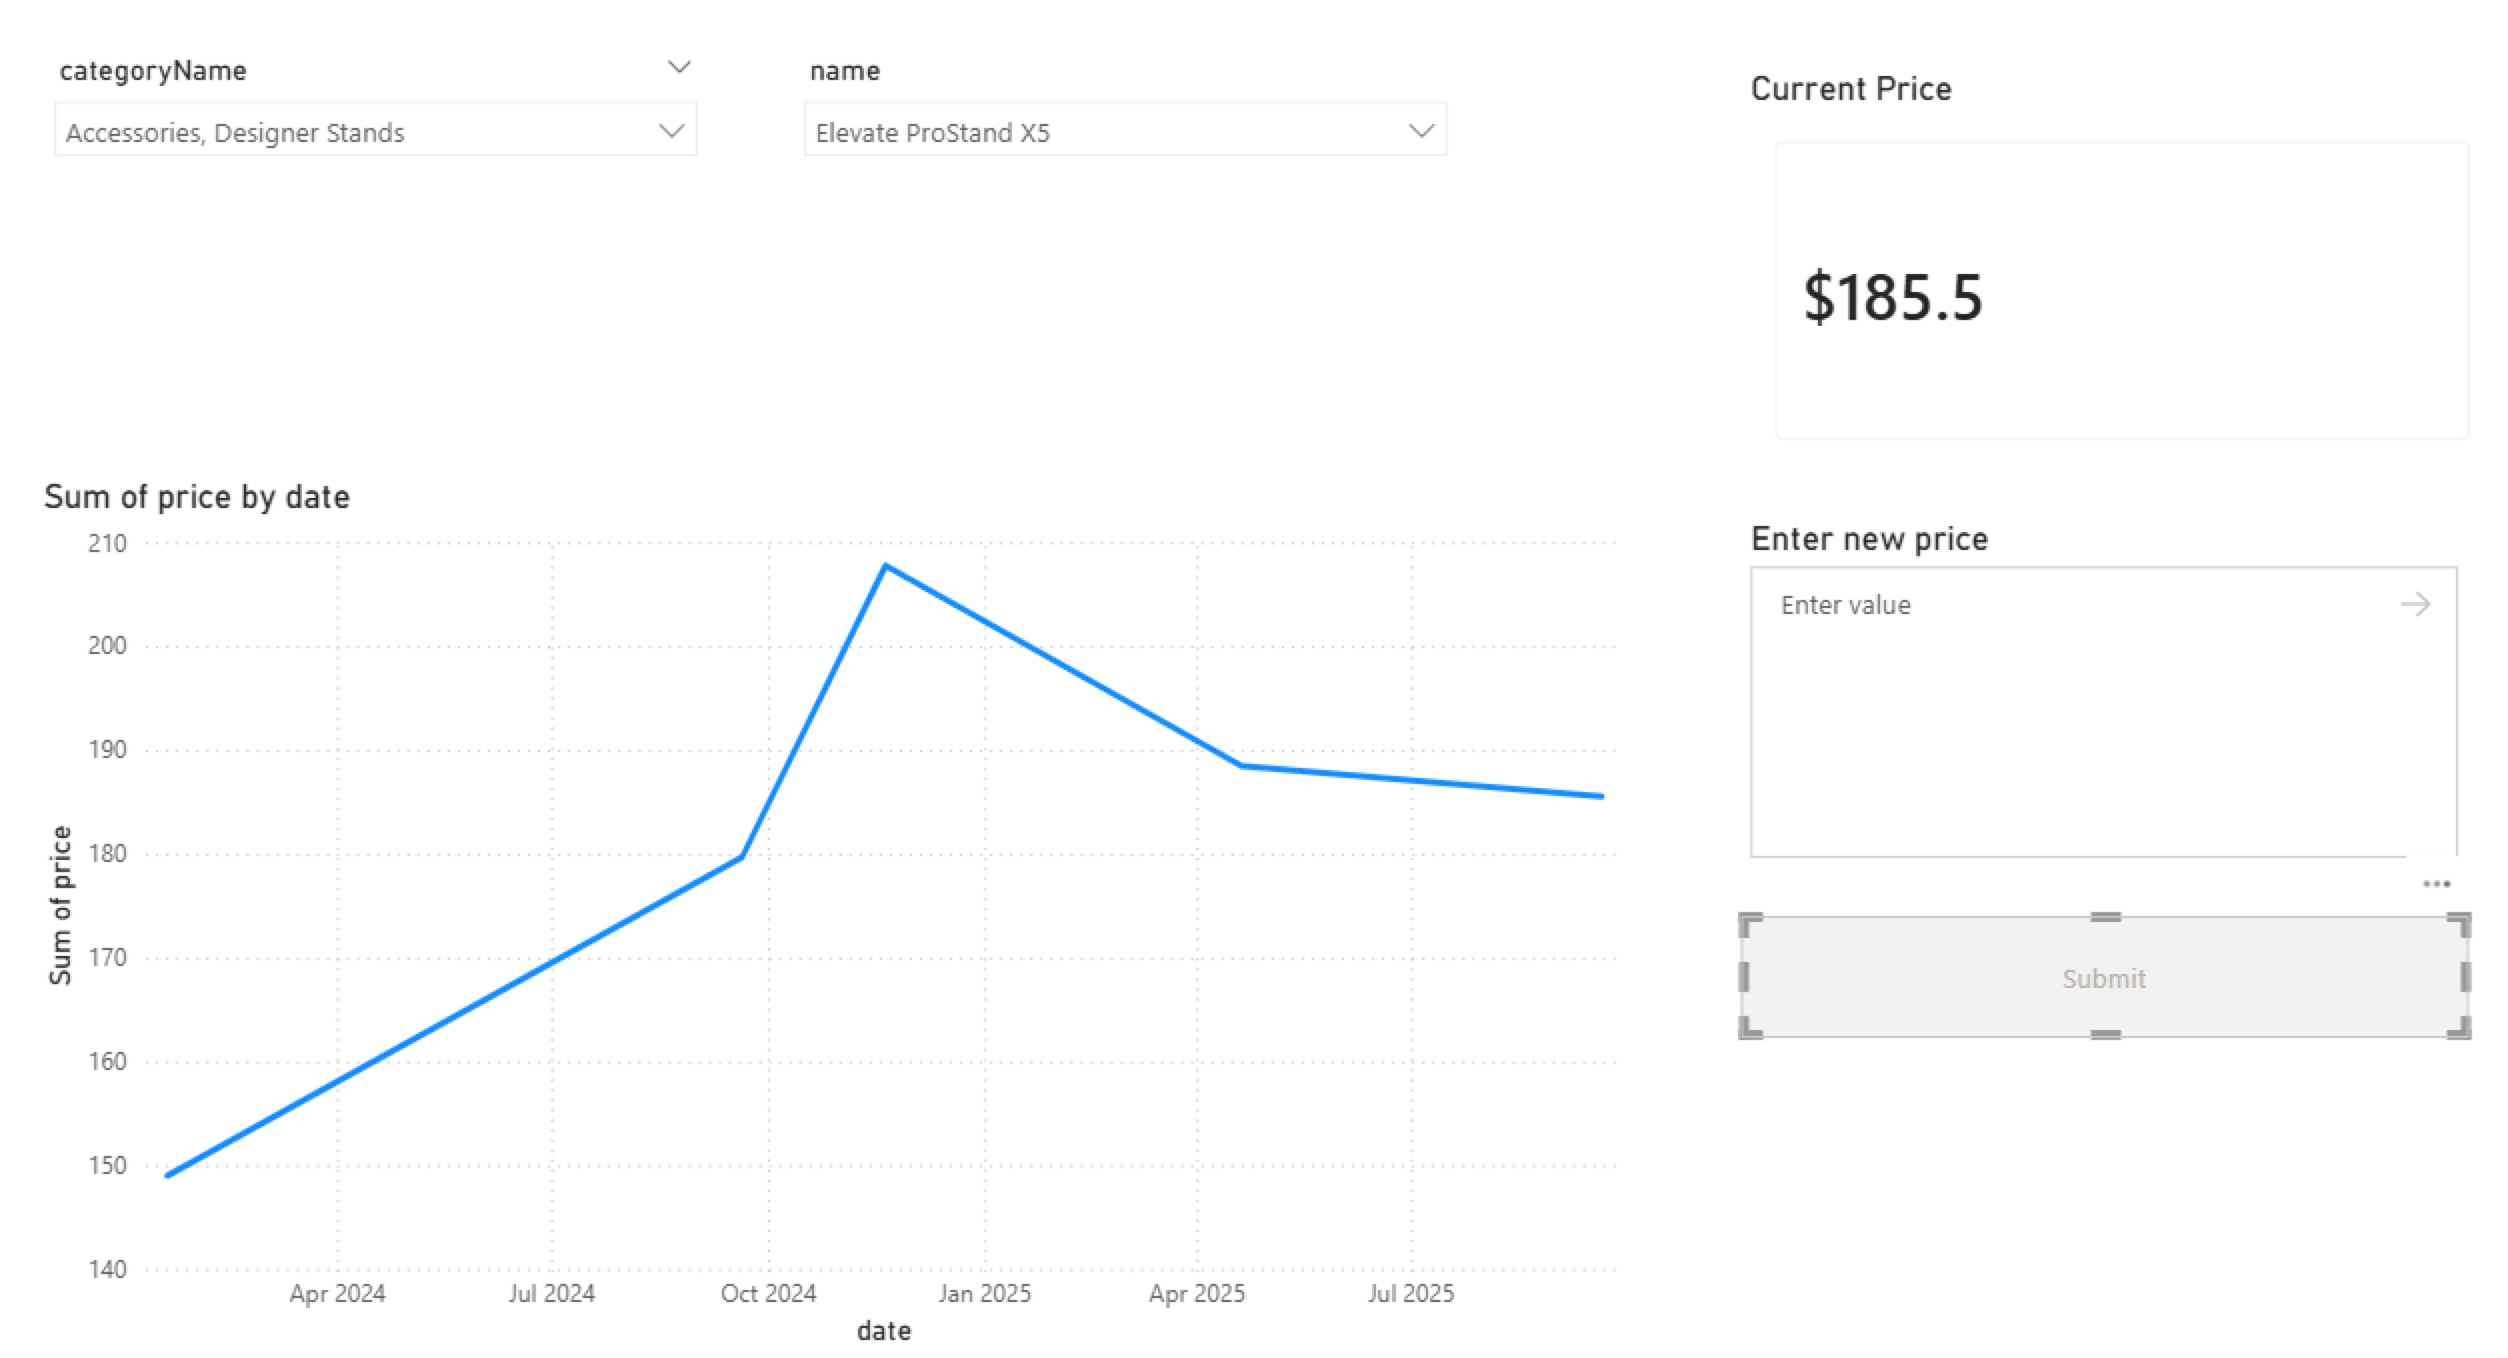
Translytical task flows combine operational and analytical workloads by connecting Cosmos DB in Microsoft Fabric, User Data Functions, and Power BI. You can build interactive reports that read data from Cosmos DB and write updates back in real time through User Data Functions.
Note
Translytical task flows are currently in public preview.
A translytical task flow uses three components:
| Component | Purpose | Technology |
|---|---|---|
| Operational data store | Real-time access to operational data for analytics | Cosmos DB in Fabric |
| Data logic layer | Execute business logic such as writing data back to the data store | User Data Functions |
| Visualization layer | Display data and provide interactive controls | Power BI |
Tip
For a complete sample of a translytical task flow with Cosmos DB in Fabric, see Translytical task flow sample on GitHub.
Prerequisites
An existing Fabric capacity
- If you don't have Fabric capacity, start a Fabric trial.
An existing Cosmos DB database in Fabric
- If you don't have one already, create a new Cosmos DB database in Fabric.
Install Power BI Desktop with the required preview features enabled.
Note the name of the Cosmos DB database you created. You use this value in later steps.
A Cosmos DB container that contains sample data. For instructions, see load the sample data container.
Retrieve Cosmos DB endpoint
Get the endpoint for the Cosmos DB database in Fabric. This endpoint is required to connect the user data function to Cosmos DB.
Open the Fabric portal (https://app.fabric.microsoft.com).
Navigate to your existing Cosmos DB database.
Select the Settings option in the menu bar for the database.

In the settings dialog, navigate to the Connection section. Then, copy the value of the Endpoint for Cosmos DB NoSQL database field. You use this value in later steps.


Create and publish a User Data Function
Create a User Data Function that updates the current price of a product in the Cosmos DB database.
In your workspace, select + New Item.
Search for
user data functionsand select the tile.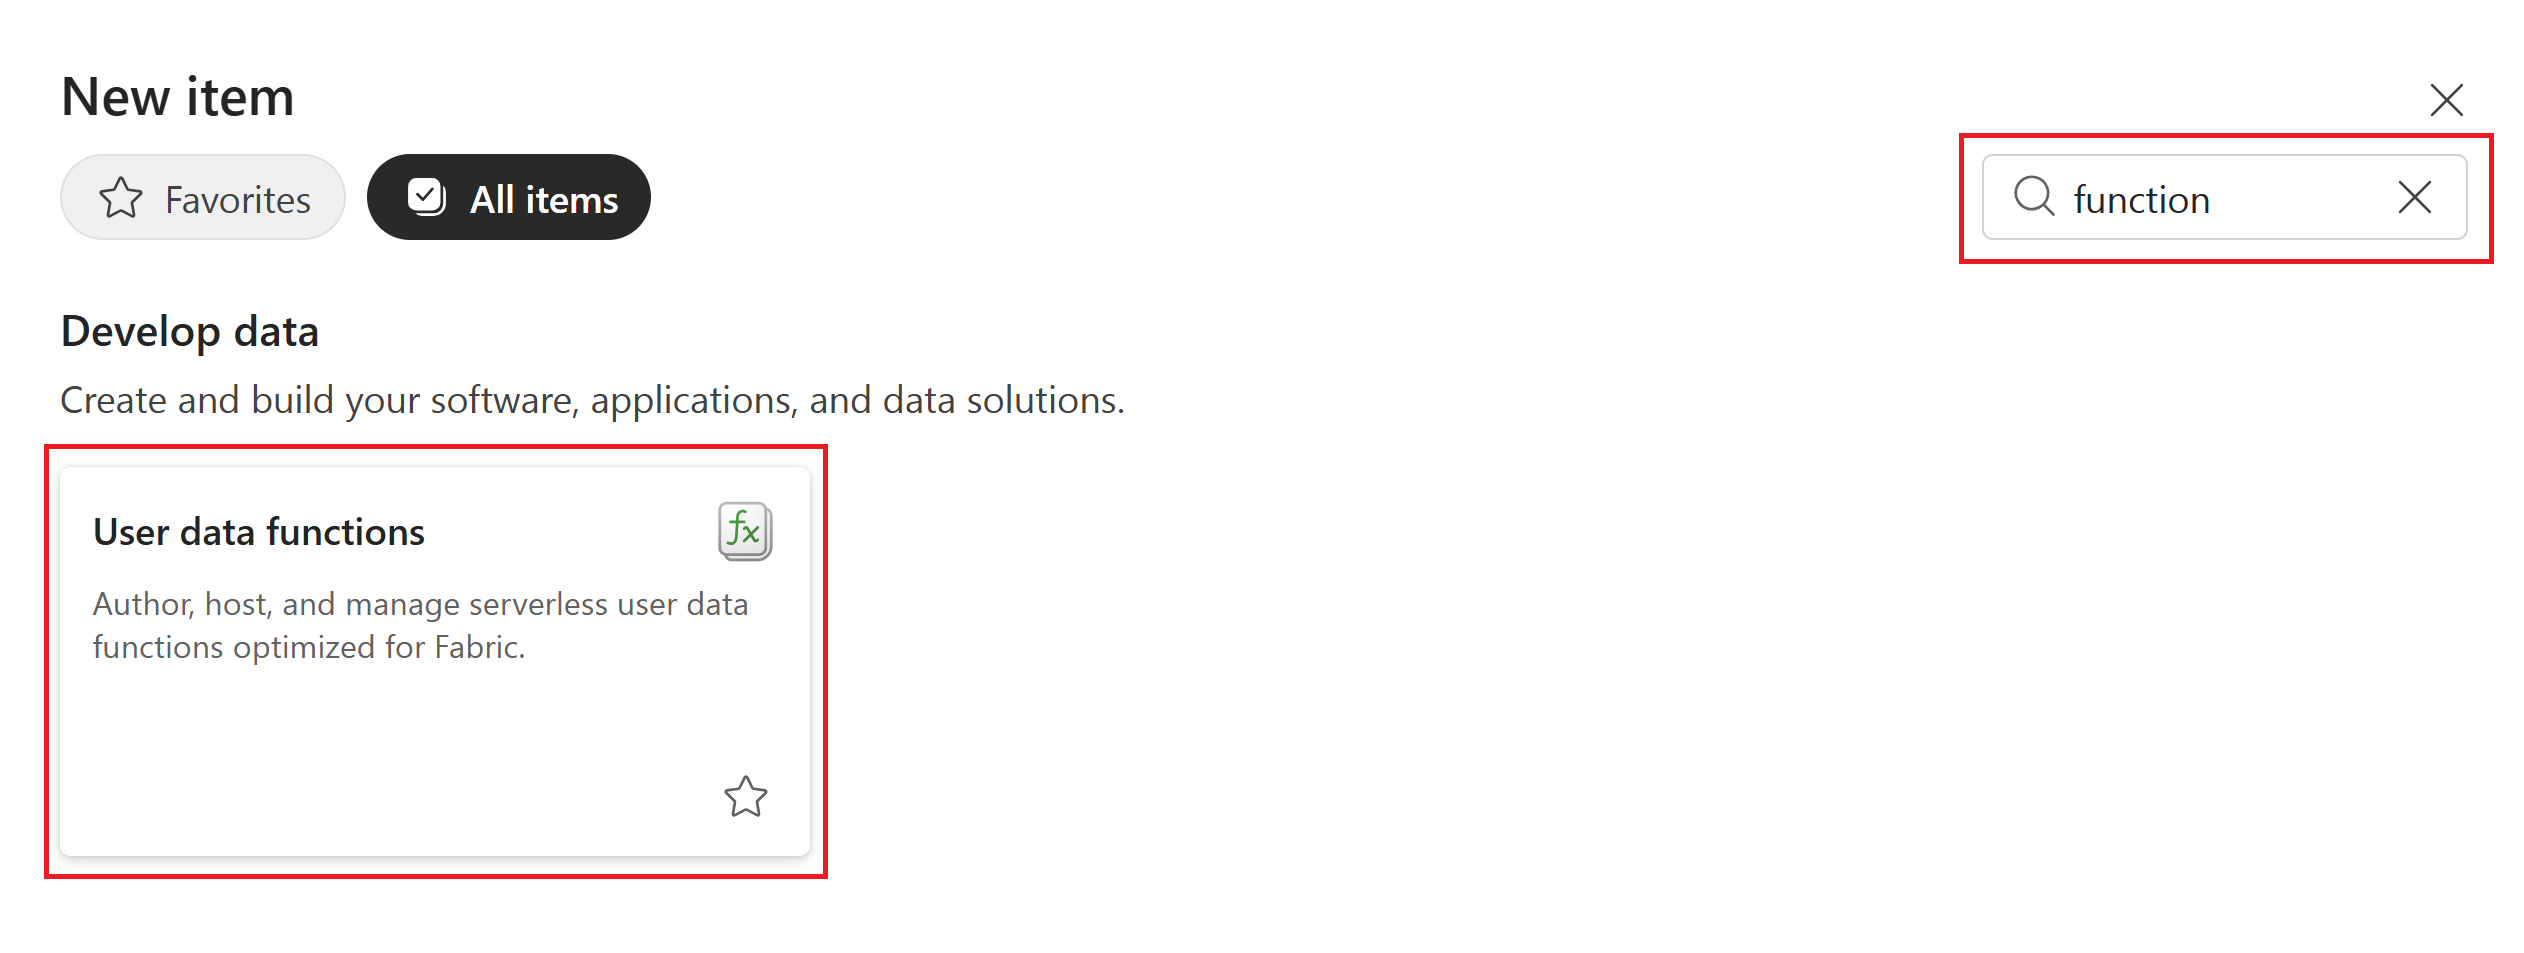
Provide
update_price_writebackas the Name for your User Data Function.On the User Data Function editor page, select New function to create a
hello_fabricuser data function template.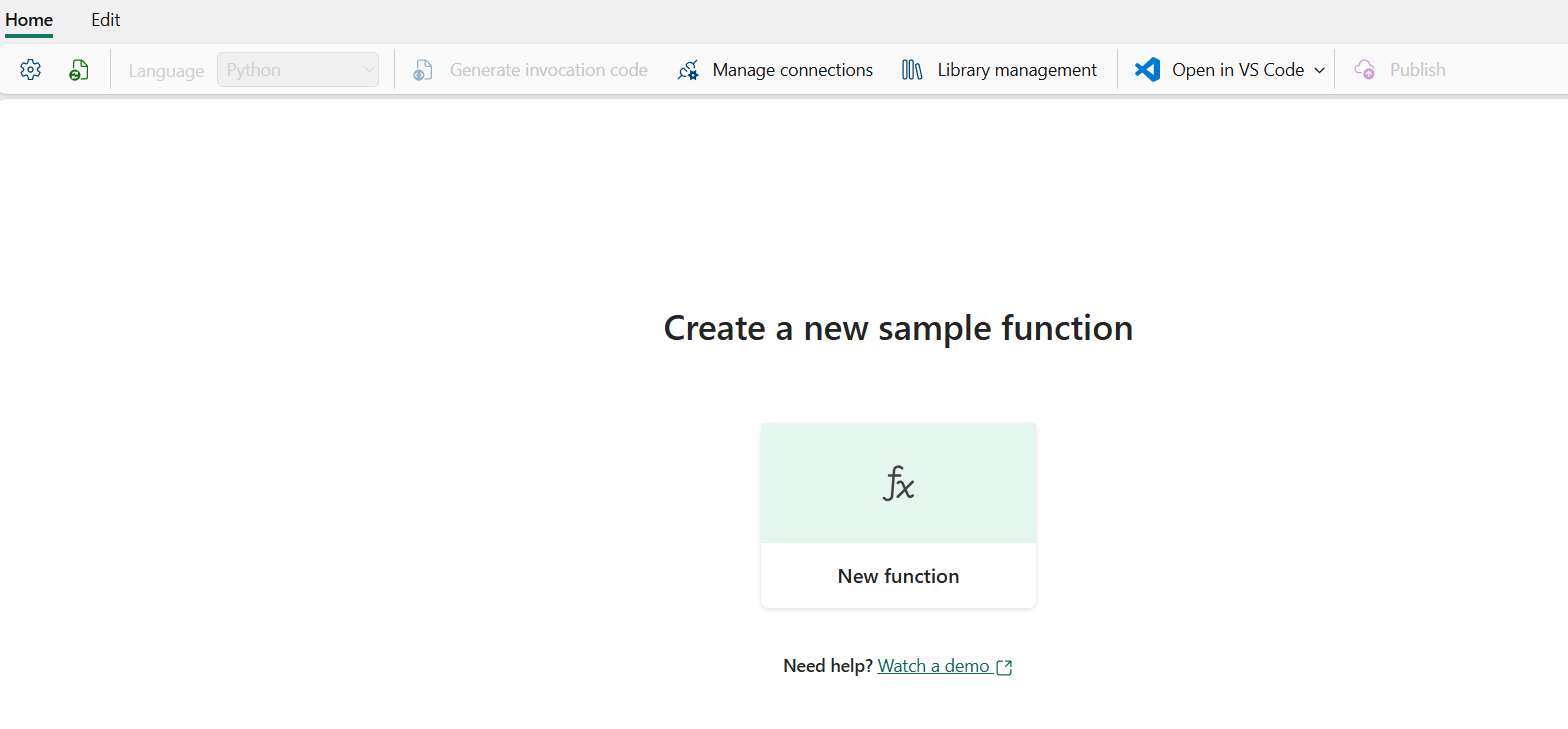
Copy the code below and paste it into the editor, replacing the default template code:
import fabric.functions as fn
udf = fn.UserDataFunctions()

import logging
from datetime import datetime
from typing import Any
from azure.cosmos import CosmosClient
from azure.cosmos import exceptions

COSMOS_URI = "YOUR_COSMOS_DB_URI_HERE"
DB_NAME = "YOUR_DATABASE_NAME_HERE"
CONTAINER_NAME = "SampleData"

@udf.connection(argName="cosmosClient", audienceType="CosmosDB", cosmos_endpoint=COSMOS_URI)
@udf.function()
def update_price(cosmosClient: CosmosClient, categoryName: str, productId: str, newPrice: float) -> list[dict[str, Any]]:

    try:
        database = cosmosClient.get_database_client(DB_NAME)
        container = database.get_container_client(CONTAINER_NAME)

        product = container.read_item(item=productId, partition_key=categoryName)

        product["currentPrice"] = newPrice

        now = datetime.now().replace(microsecond=0)
        current_time_iso = now.isoformat()

        product["priceHistory"].append({
            "date": current_time_iso,
            "price": newPrice
        })

        container.replace_item(item=productId, body=product)

        return product

    except exceptions.CosmosResourceNotFoundError as e:
        logging.error(f"Item not found in Cosmos DB: {e}")
        raise
    except exceptions.CosmosHttpResponseError as e:
        logging.error(f"Cosmos error in update_price: {e}")
        raise
    except Exception as e:
        logging.error(f"Unexpected error in update_price: {e}")
        raise
Replace
YOUR_COSMOS_DB_URI_HEREwith the endpoint URI you copied earlier.Replace
YOUR_DATABASE_NAME_HEREwith the name of your Cosmos DB database.-
In the top menu bar, select Library Management, then choose + Add from PyPI. Search for
azure-cosmos, select it from the results, and pick the latest version.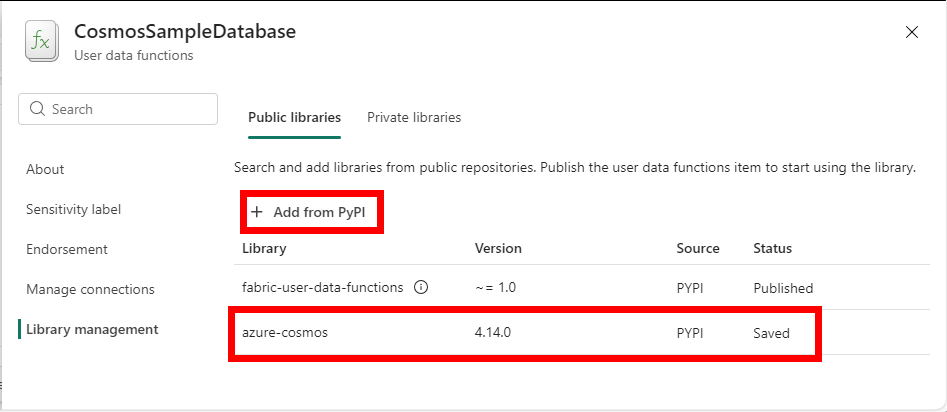
Close the library management pane once the library is added, and on the top menu bar, select Publish.
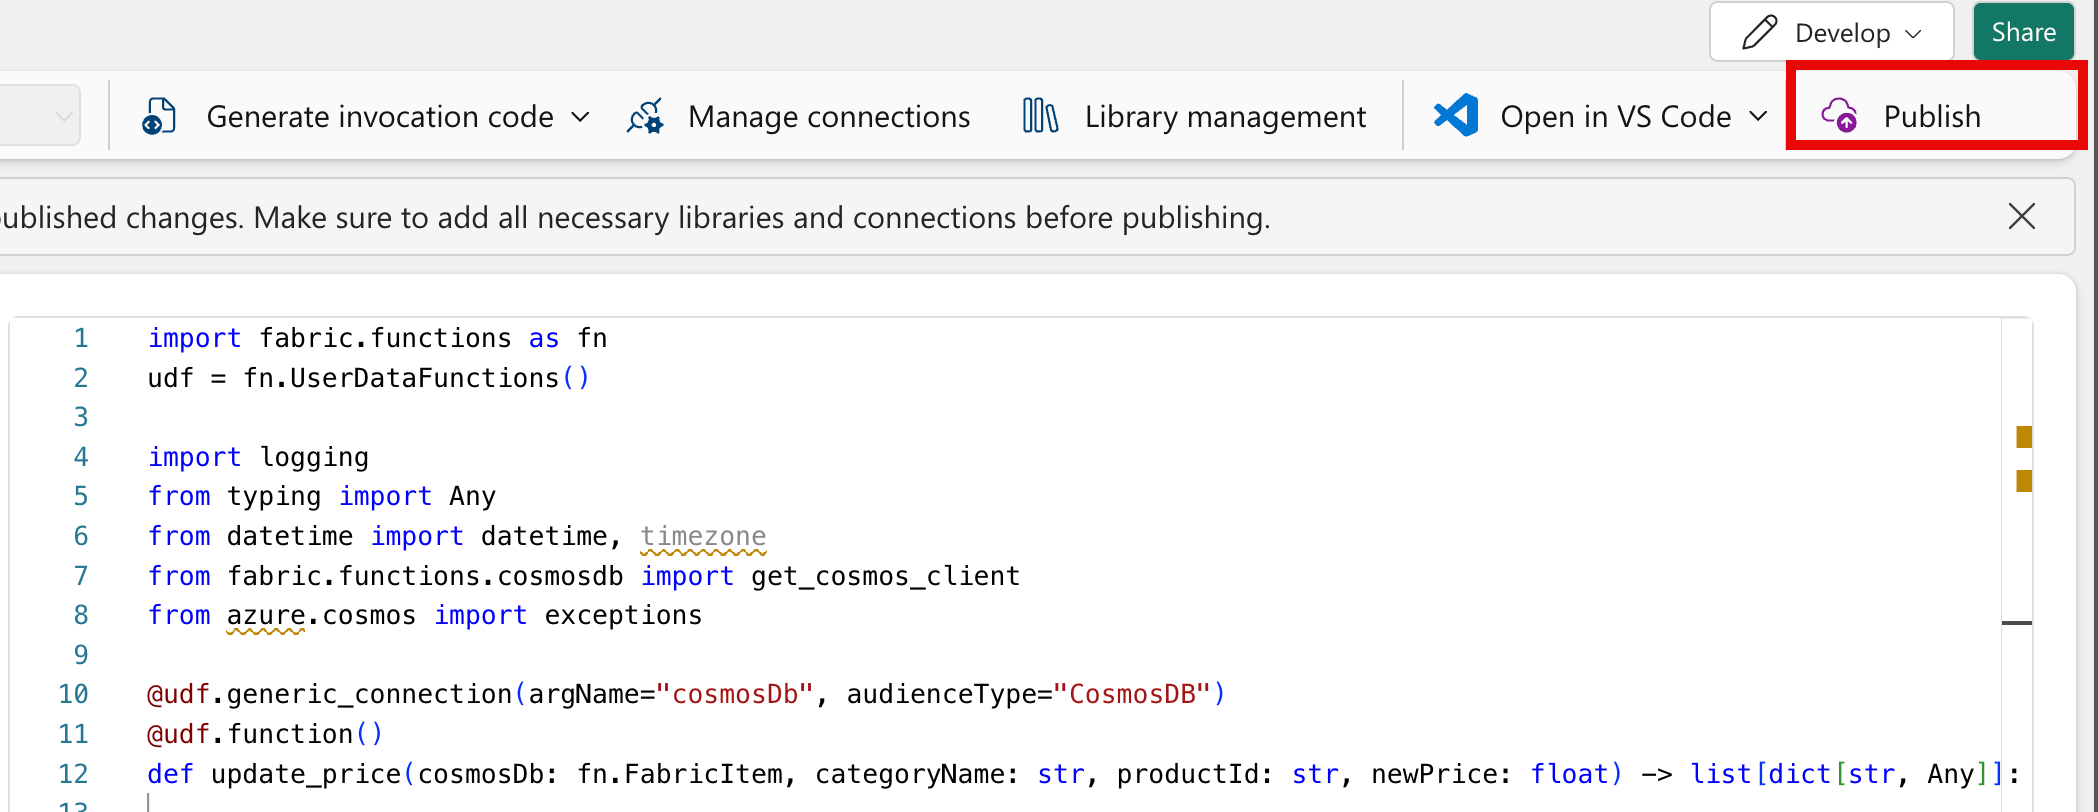
Hover over the function name in the left pane after publishing completes, and select the Test icon.
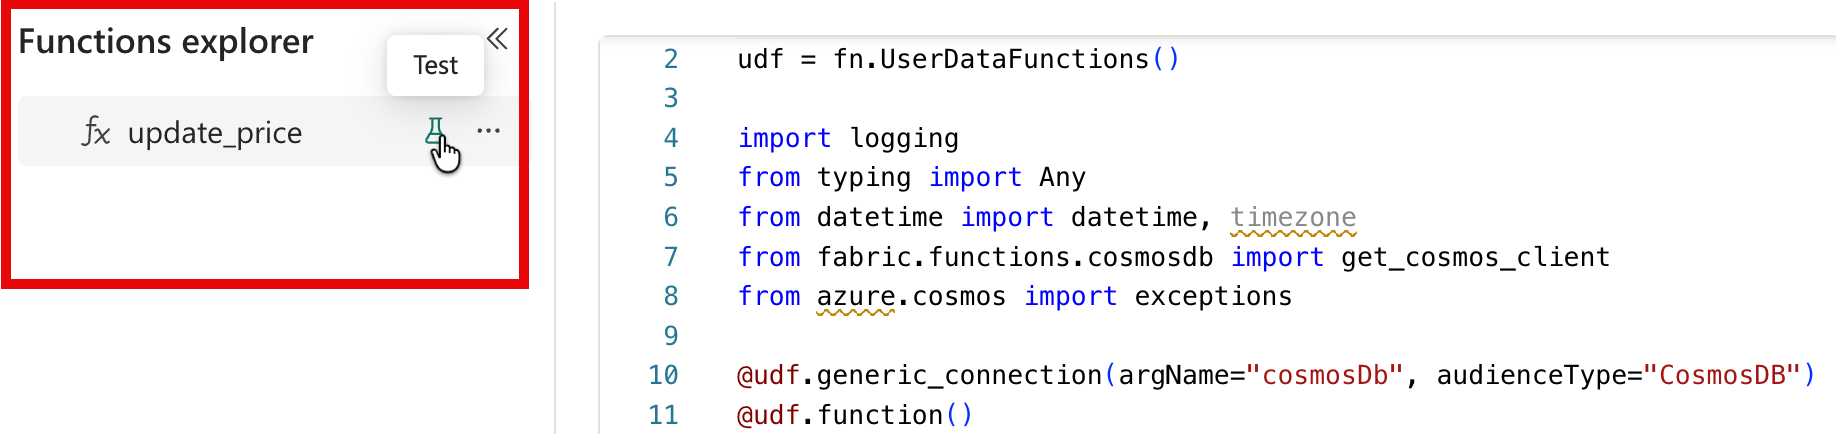
Provide sample input values in the test pane:
categoryName: Computers, DesktopsproductId: 05bca58f-257c-4129-8373-1b0951cb8104newPrice: 5000
Select Test to run the function. Review the output and logs to verify the function runs successfully, then close the test pane.
Connect to Cosmos DB data in Power BI
Connect to your Cosmos DB database from Power BI Desktop and transform the data for your report.
Open Power BI Desktop and create a new report.
Select Get Data > More, search for Cosmos DB, and select Azure Cosmos DB v2. Select Connect.
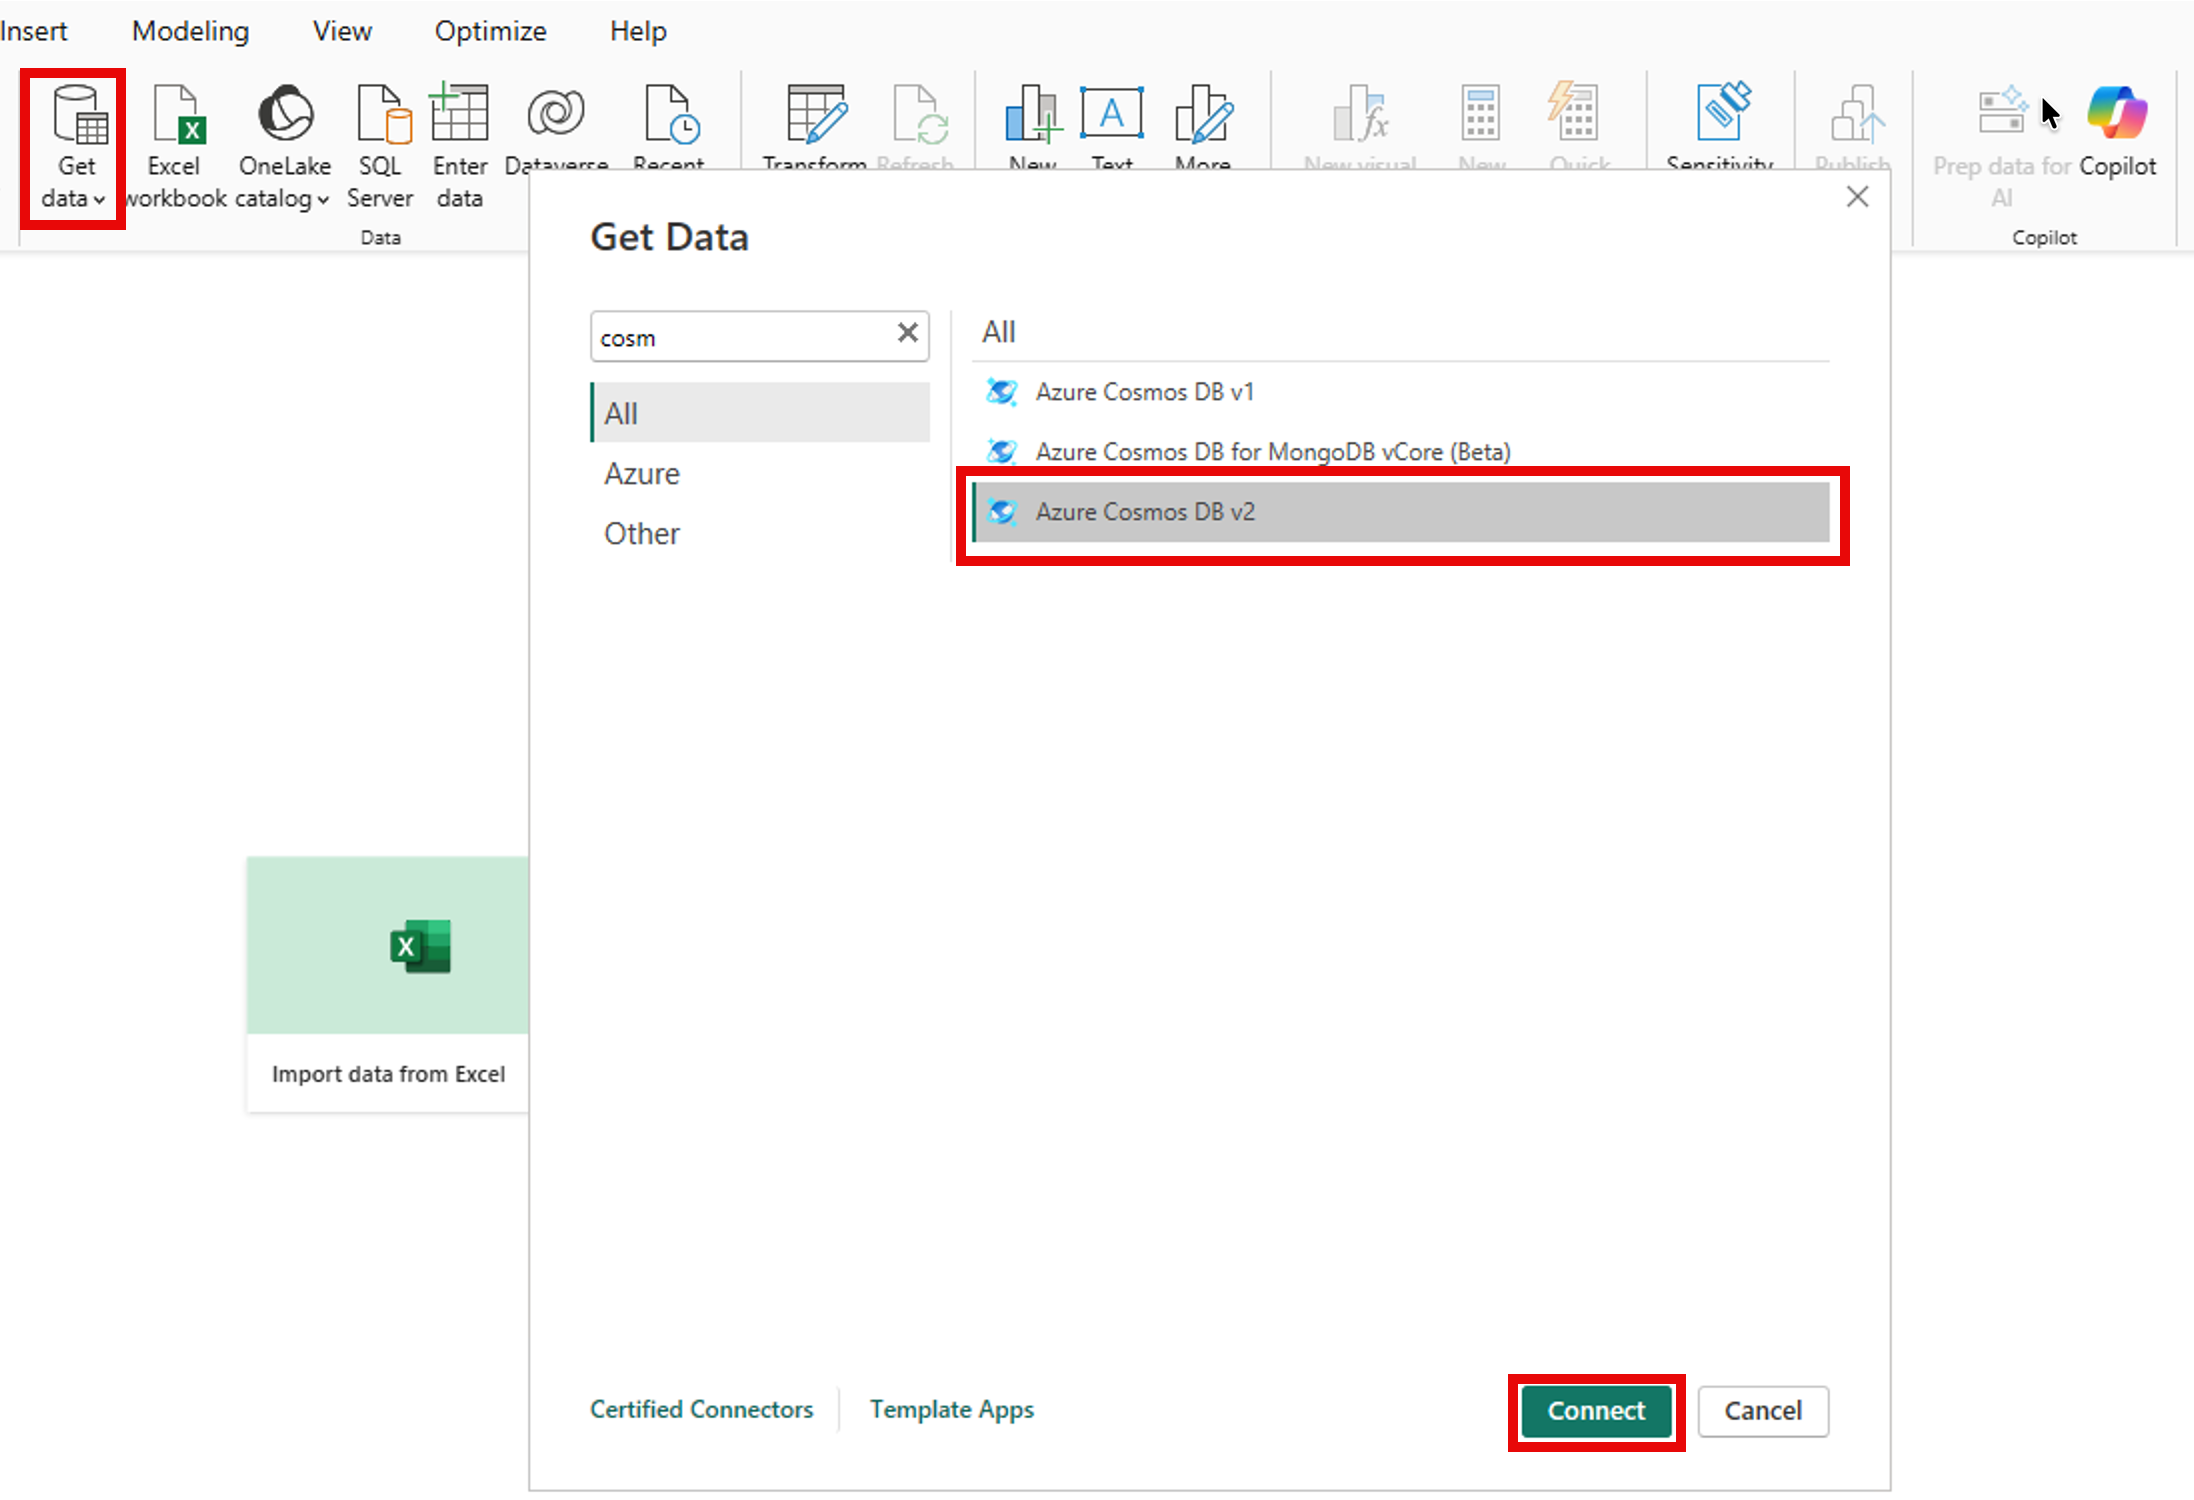
In the connection dialog, provide the Cosmos DB endpoint and for Data Connectivity mode, select DirectQuery. Select OK.
Note
If prompted for authentication, select Organizational account, sign in with your Microsoft Fabric credentials, and select Connect.
In the Navigator pane, expand the Cosmos DB database and select the
SampleDataandSampleData_PriceHistory[]tables from the SampleData container.Select Transform Data to open the Power Query Editor.
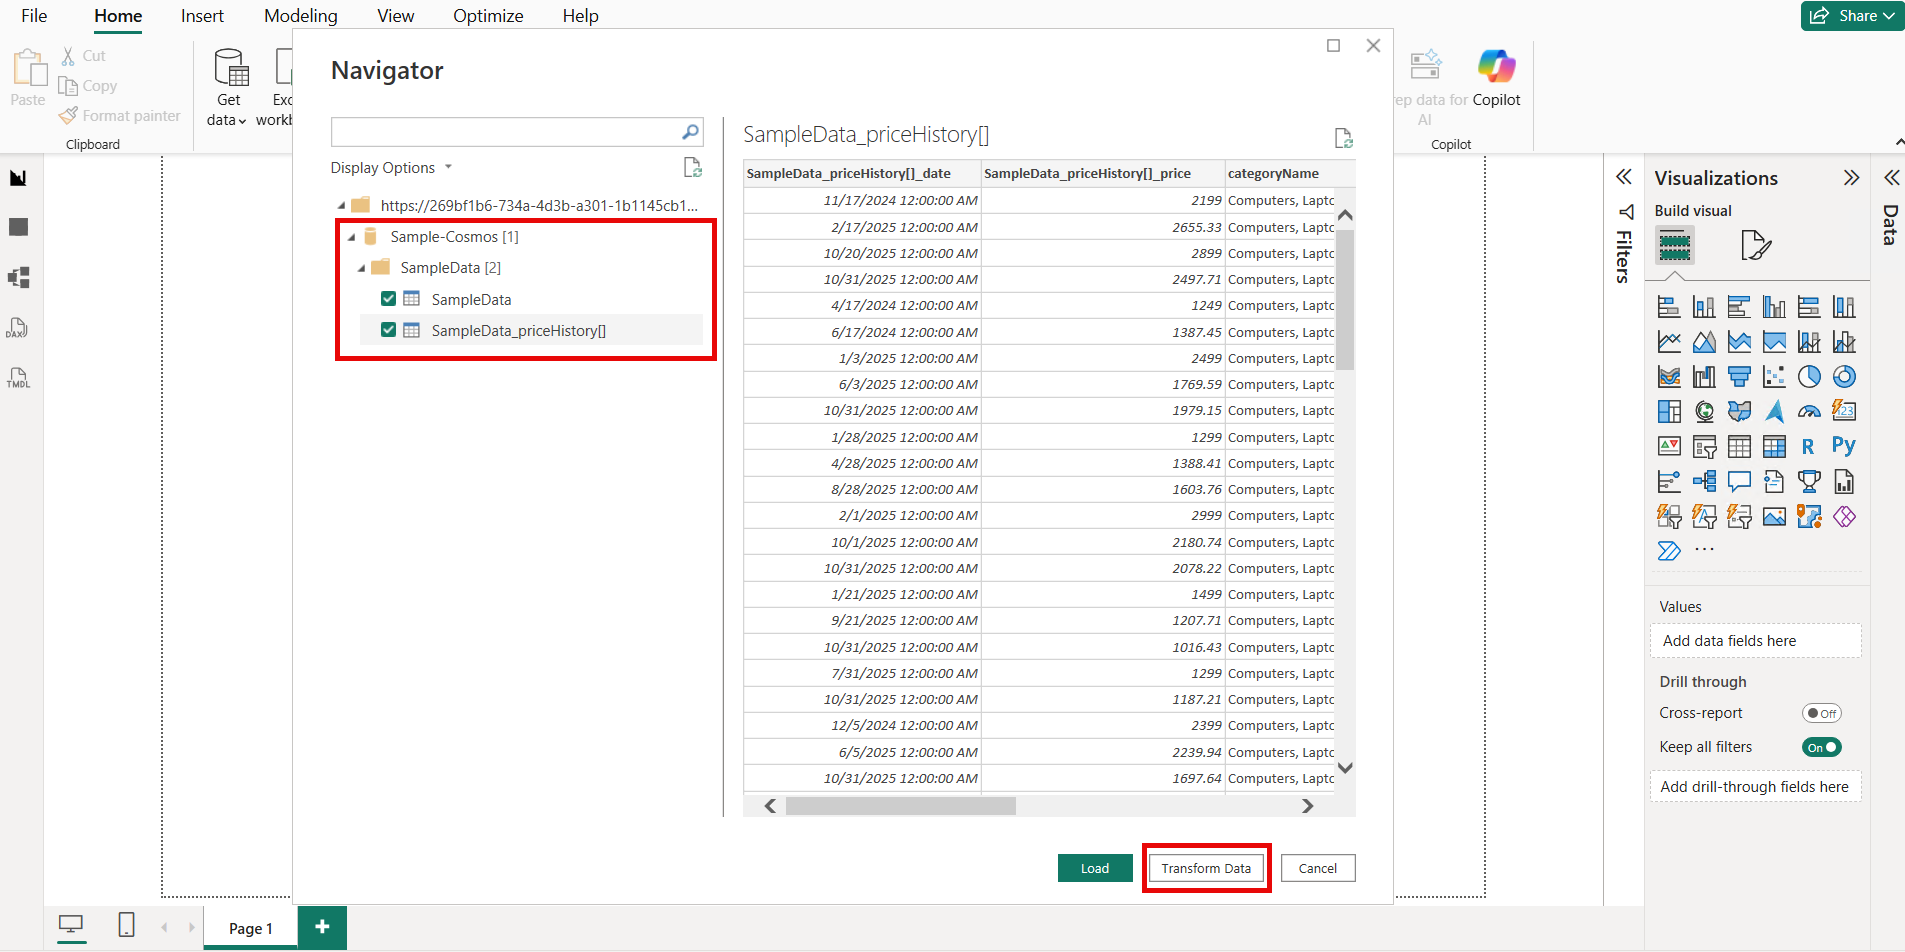
In the Power Query Editor, rename the SampleData_priceHistory[] table to PriceHistory by right-clicking the table in the left pane and selecting Rename.
Select the SampleData table. On the Home tab, select Choose Columns and keep only these columns:
categoryName,currentPrice,docType,name, andproductId. Select OK.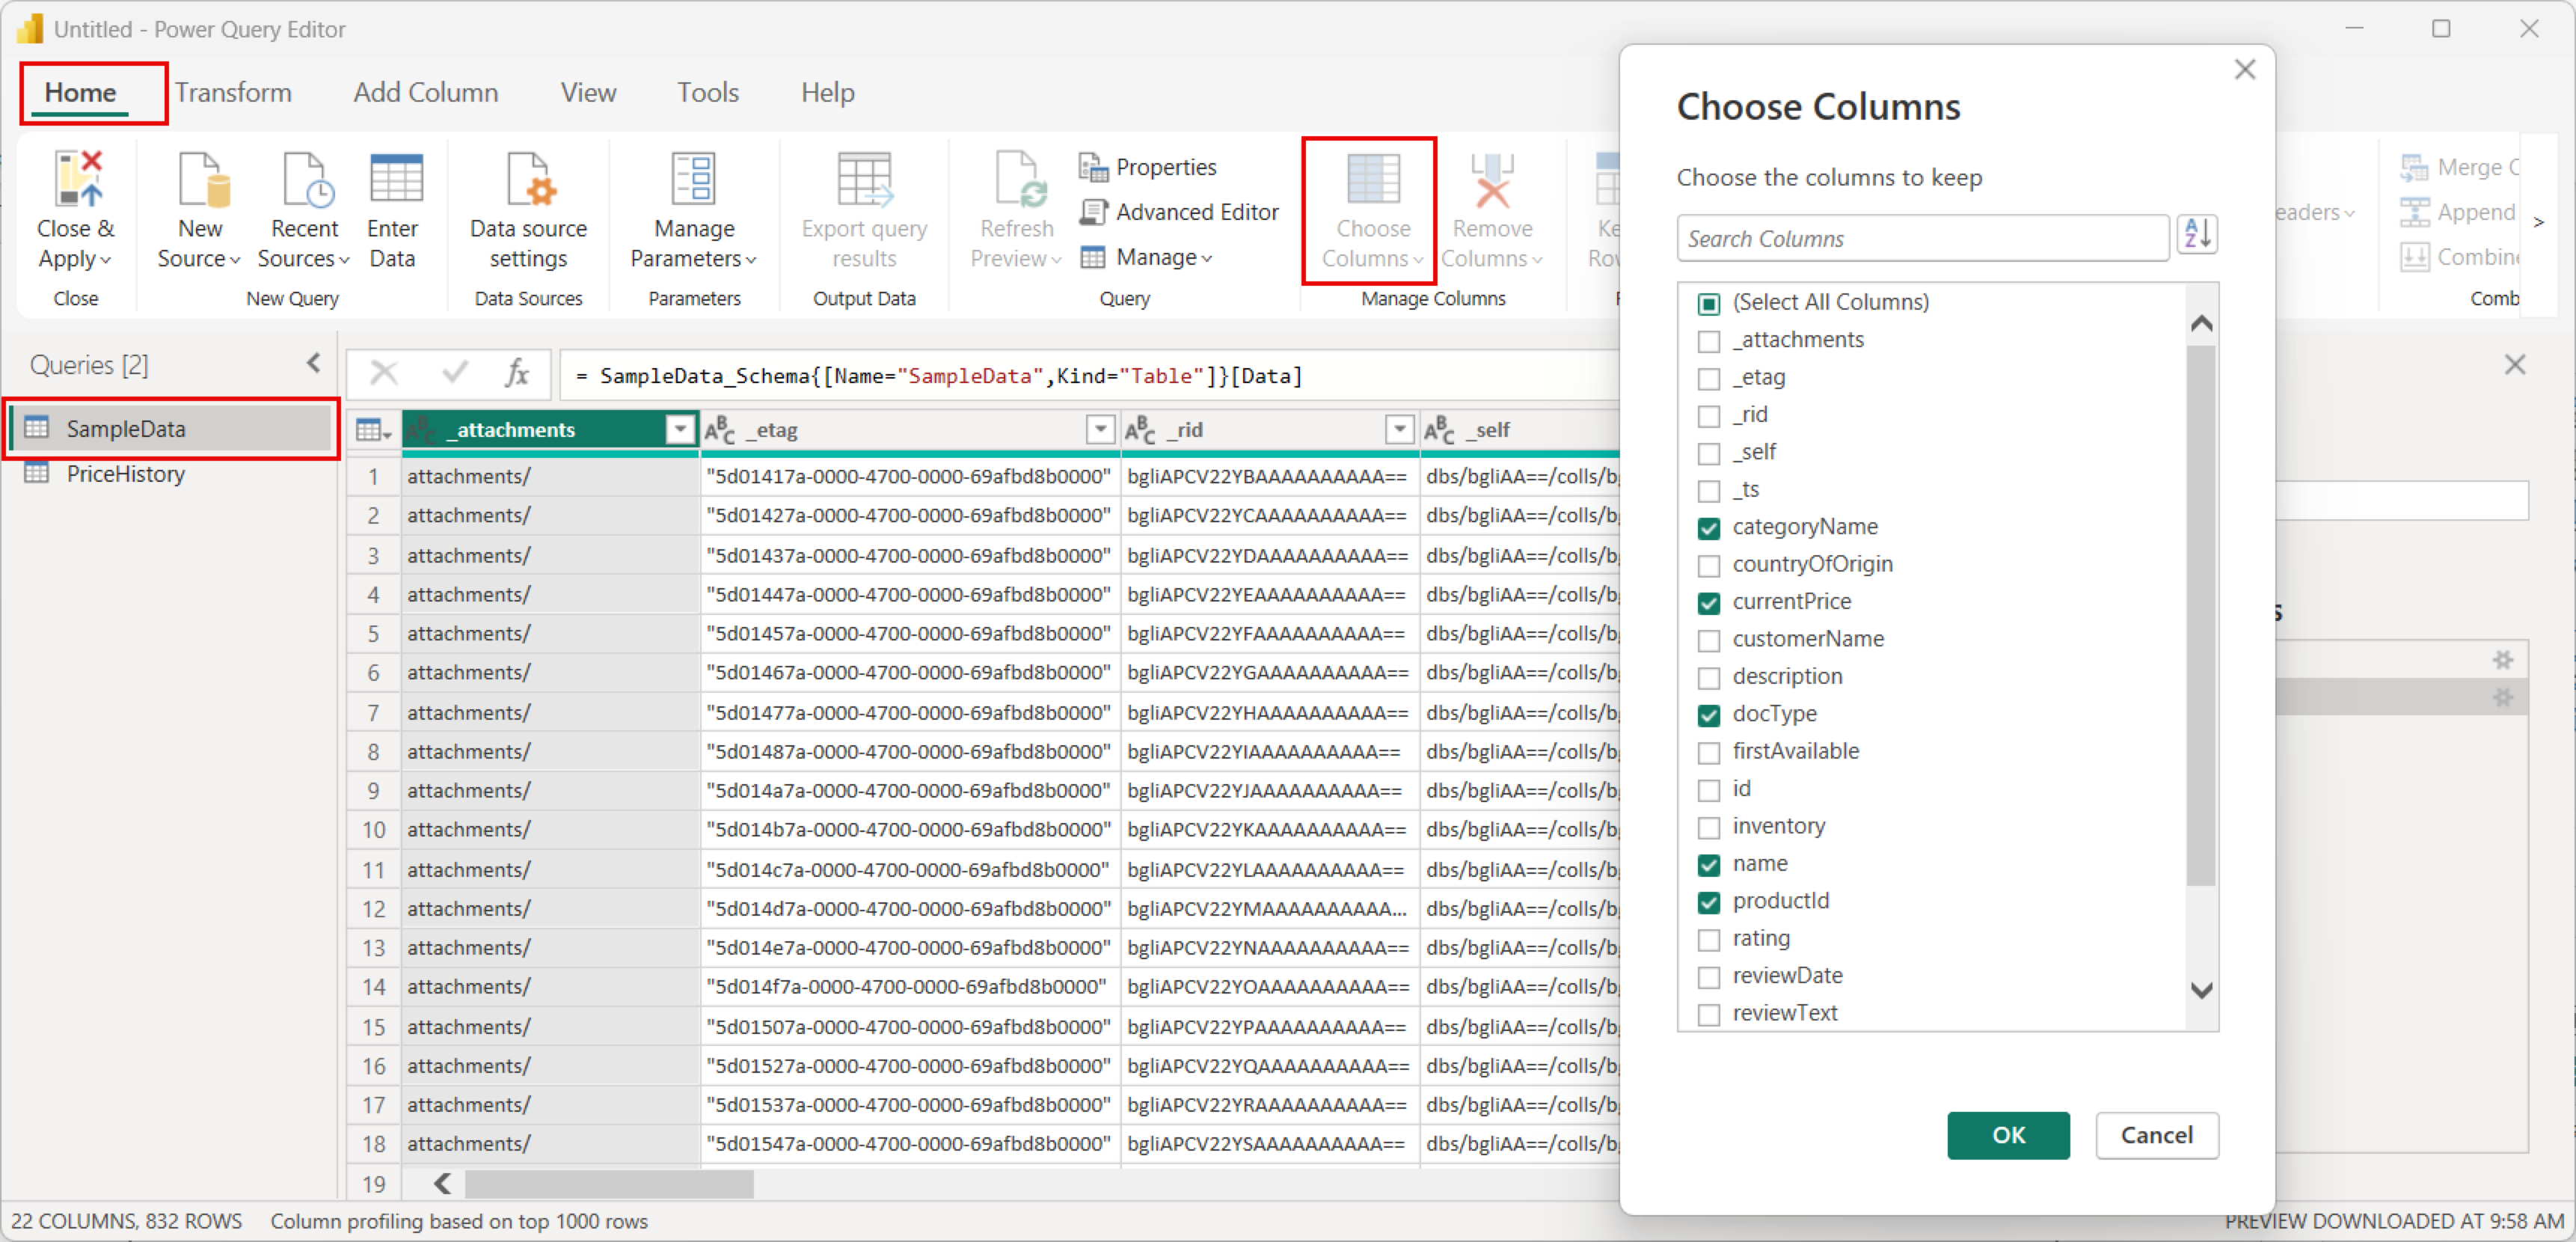
Select the docType column in the SampleData table and filter to only include rows where
docTypeequalsproduct.Select the PriceHistory table and remove the following columns:
SampleData(categoryName),SampleData(id), andcategoryNameby right-clicking the column headers and selecting Remove.Rename
SampleData_priceHistory[]_datetodateandSampleData_priceHistory[]_pricetoprice.Select Close and Apply to load the data into Power BI.
Create the interactive report
Build report visuals and connect the User data function to enable price updates from the report.
Switch to the Model view in Power BI Desktop and select Manage Relationships from the top menu.
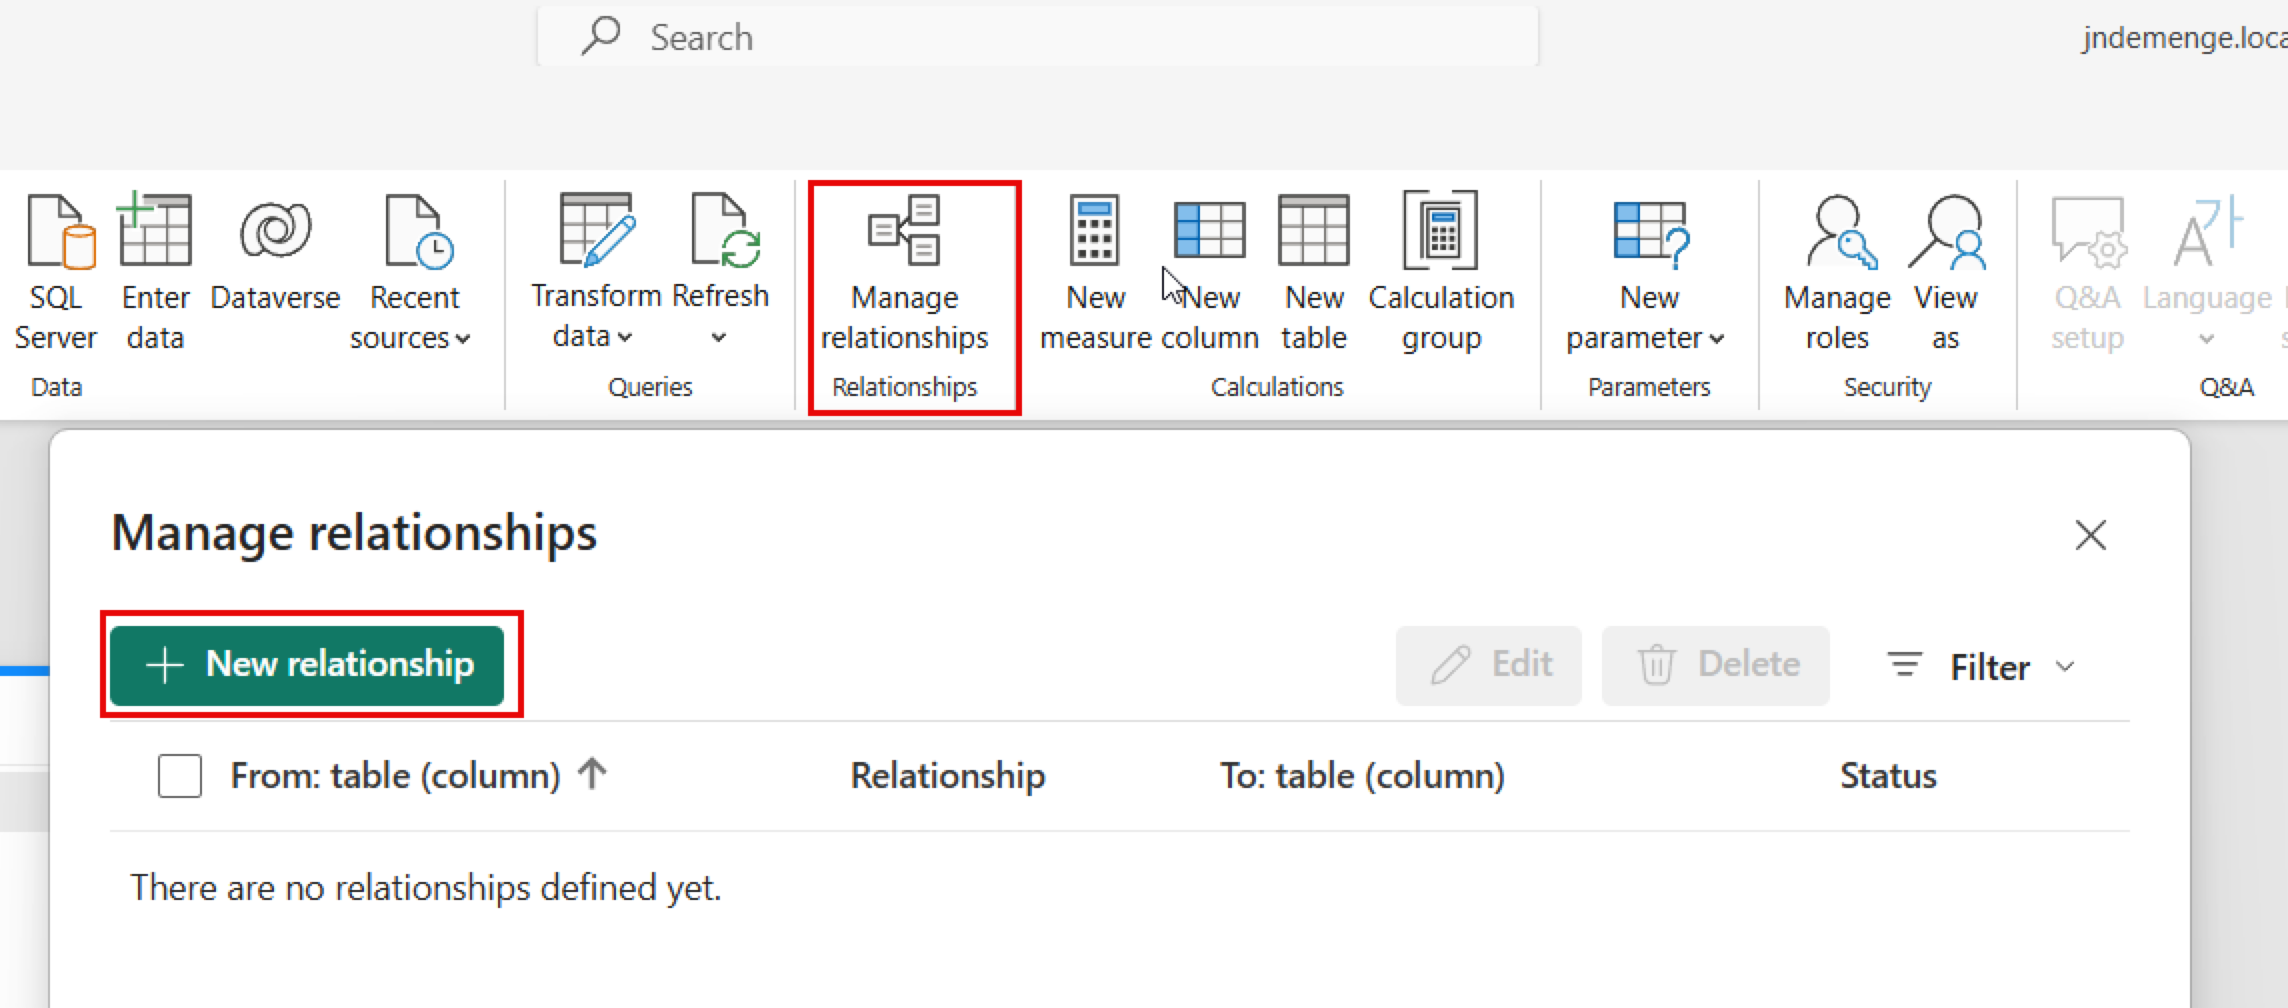
Select New Relationship and create a relationship between the
productIdfield in theSampleDatatable and theidfield in thePriceHistorytable. Select Save and close the Manage Relationships dialog.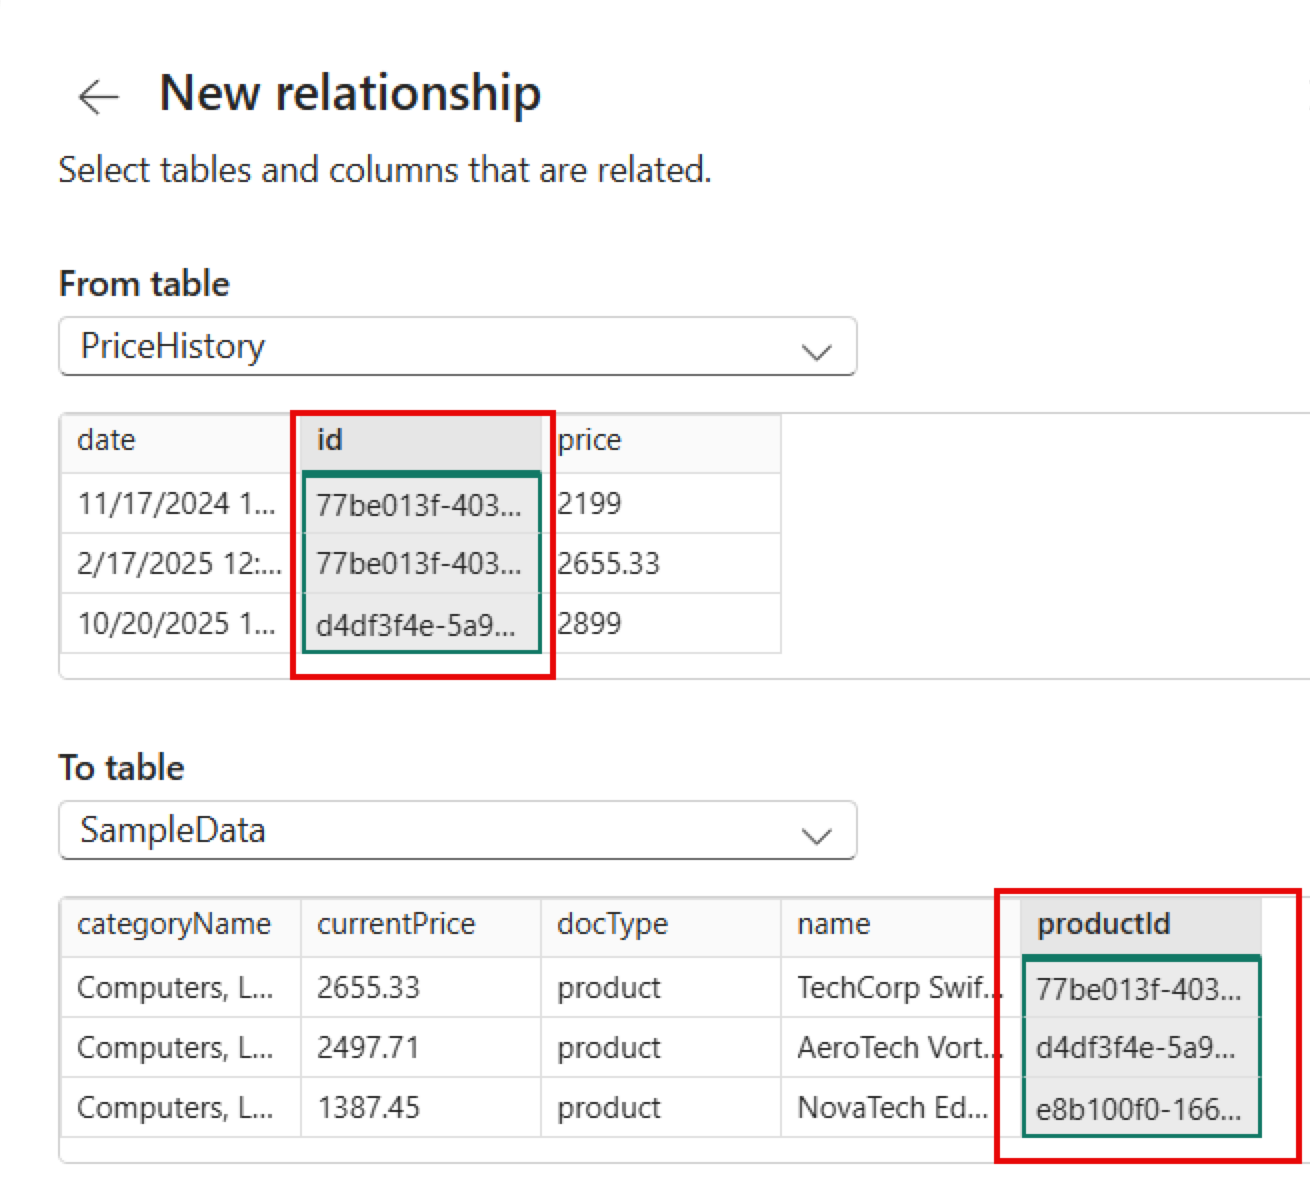
Select the SampleData table in the Data pane. On the top menu, select New measure.
Copy the DAX code below and paste it into the formula bar, then select the checkmark icon to save the measure. This measure formats the current price for display in the report.
currentPriceDisplay =
VAR v = SELECTEDVALUE('SampleData'[currentPrice])
RETURN
IF(
    HASONEVALUE('SampleData'[categoryName]) &&
    HASONEVALUE('SampleData'[name]),
    IF(
        v >= 100000,
        "$" & FORMAT(v / 1000, "#,0.##") & "K",
        "$" & FORMAT(v, "#,0.##")
    ),
    BLANK()
)
Switch to Report view on the left navigation bar.
In the Visualizations pane on the right, select the Slicer visual and add the
categoryNamefield from theSampleDatatable.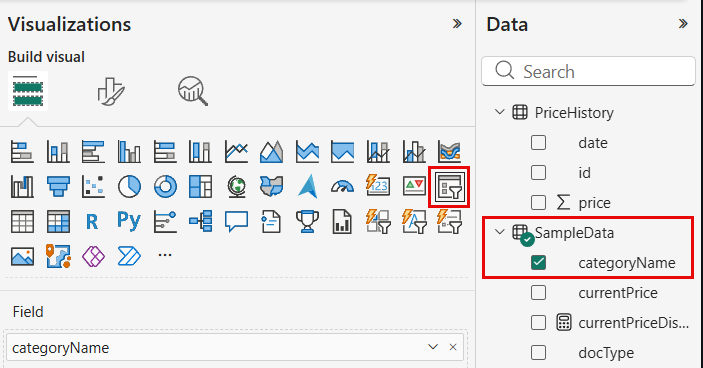
In the Format Visual tab, under Slicer Settings, change the Style to Dropdown.
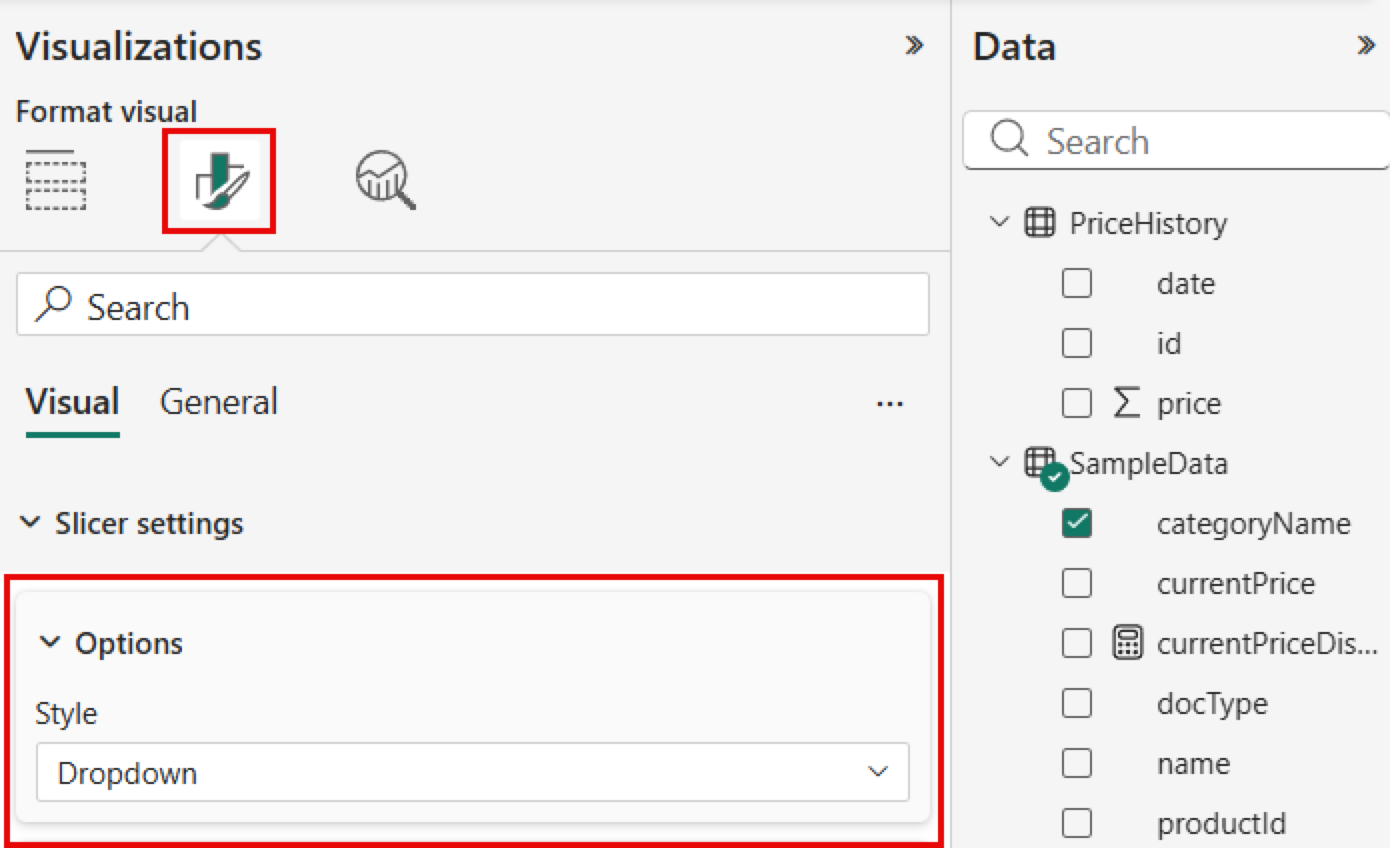
Add another Slicer visual for the
namefield from theSampleDatatable.Add a Card visual and drag the
currentPriceDisplaymeasure to the Value well.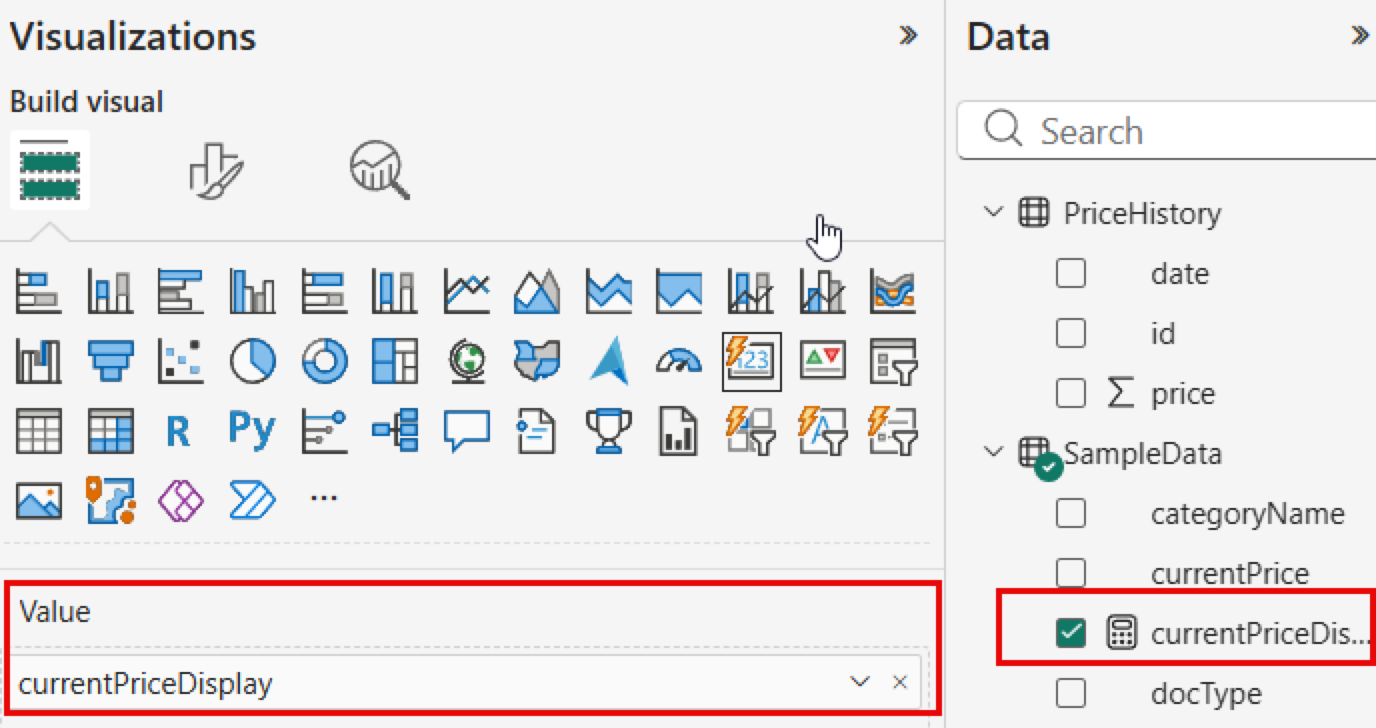
Toggle off Label in the Format Visual tab under Visual > Callout.
Toggle on Title under General and set the title text to
Current Price.Add a Line Chart visual on the report canvas.
Drag the
datefield from the PriceHistory table to the X axis well and thepricefield to the Y axis well.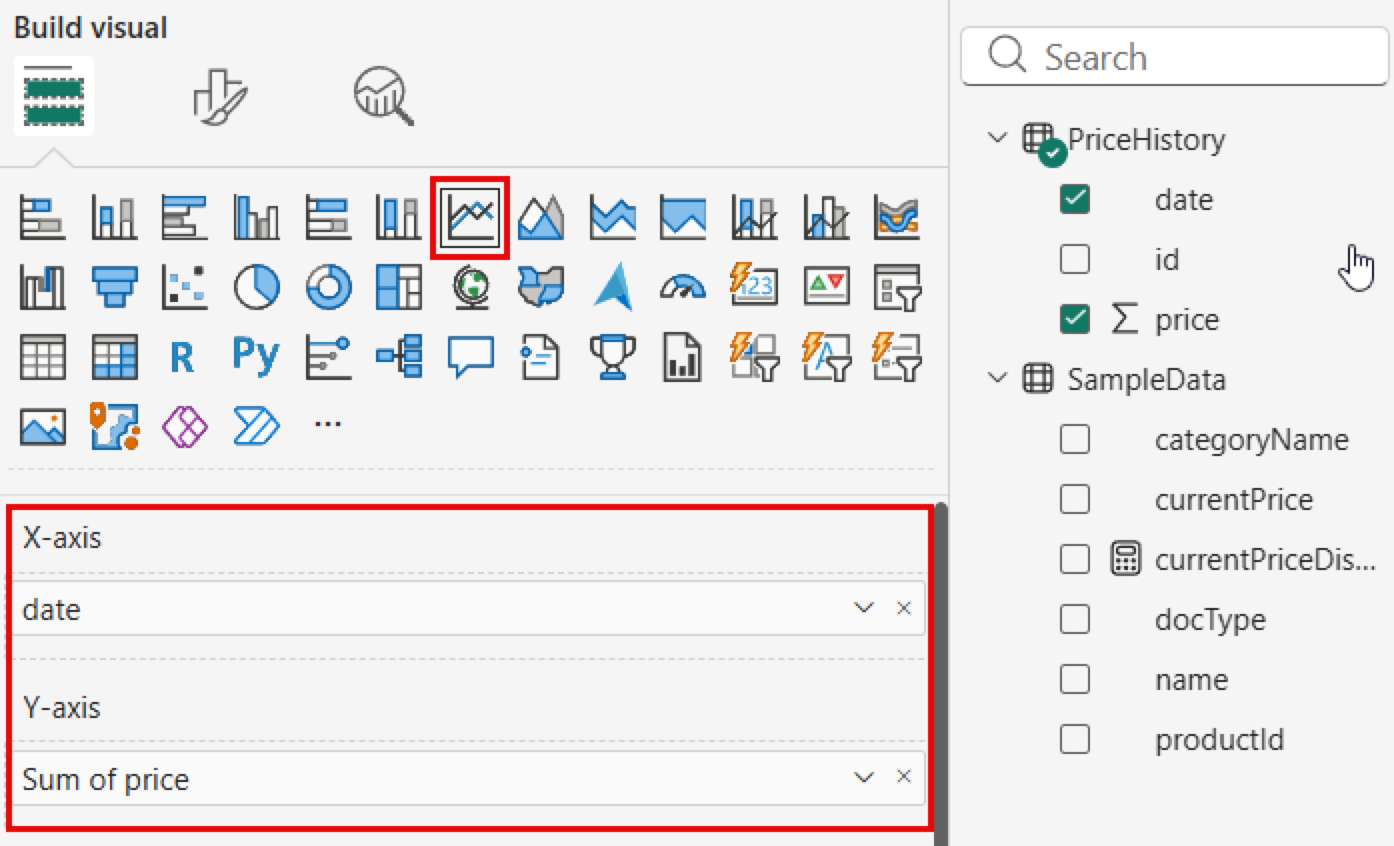
Add an Input Slicer visual to the report canvas.
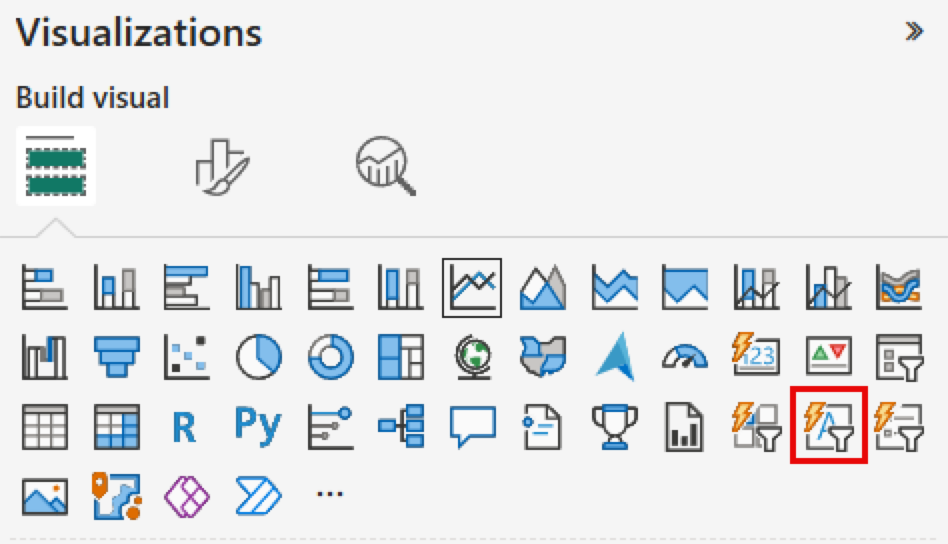
Select the input slicer and in the Format Visual > General > Title options, set the title to
Enter new price.From the top navigation bar, select Insert > Buttons, and in the dropdown, select Blank to add a blank button to the report.
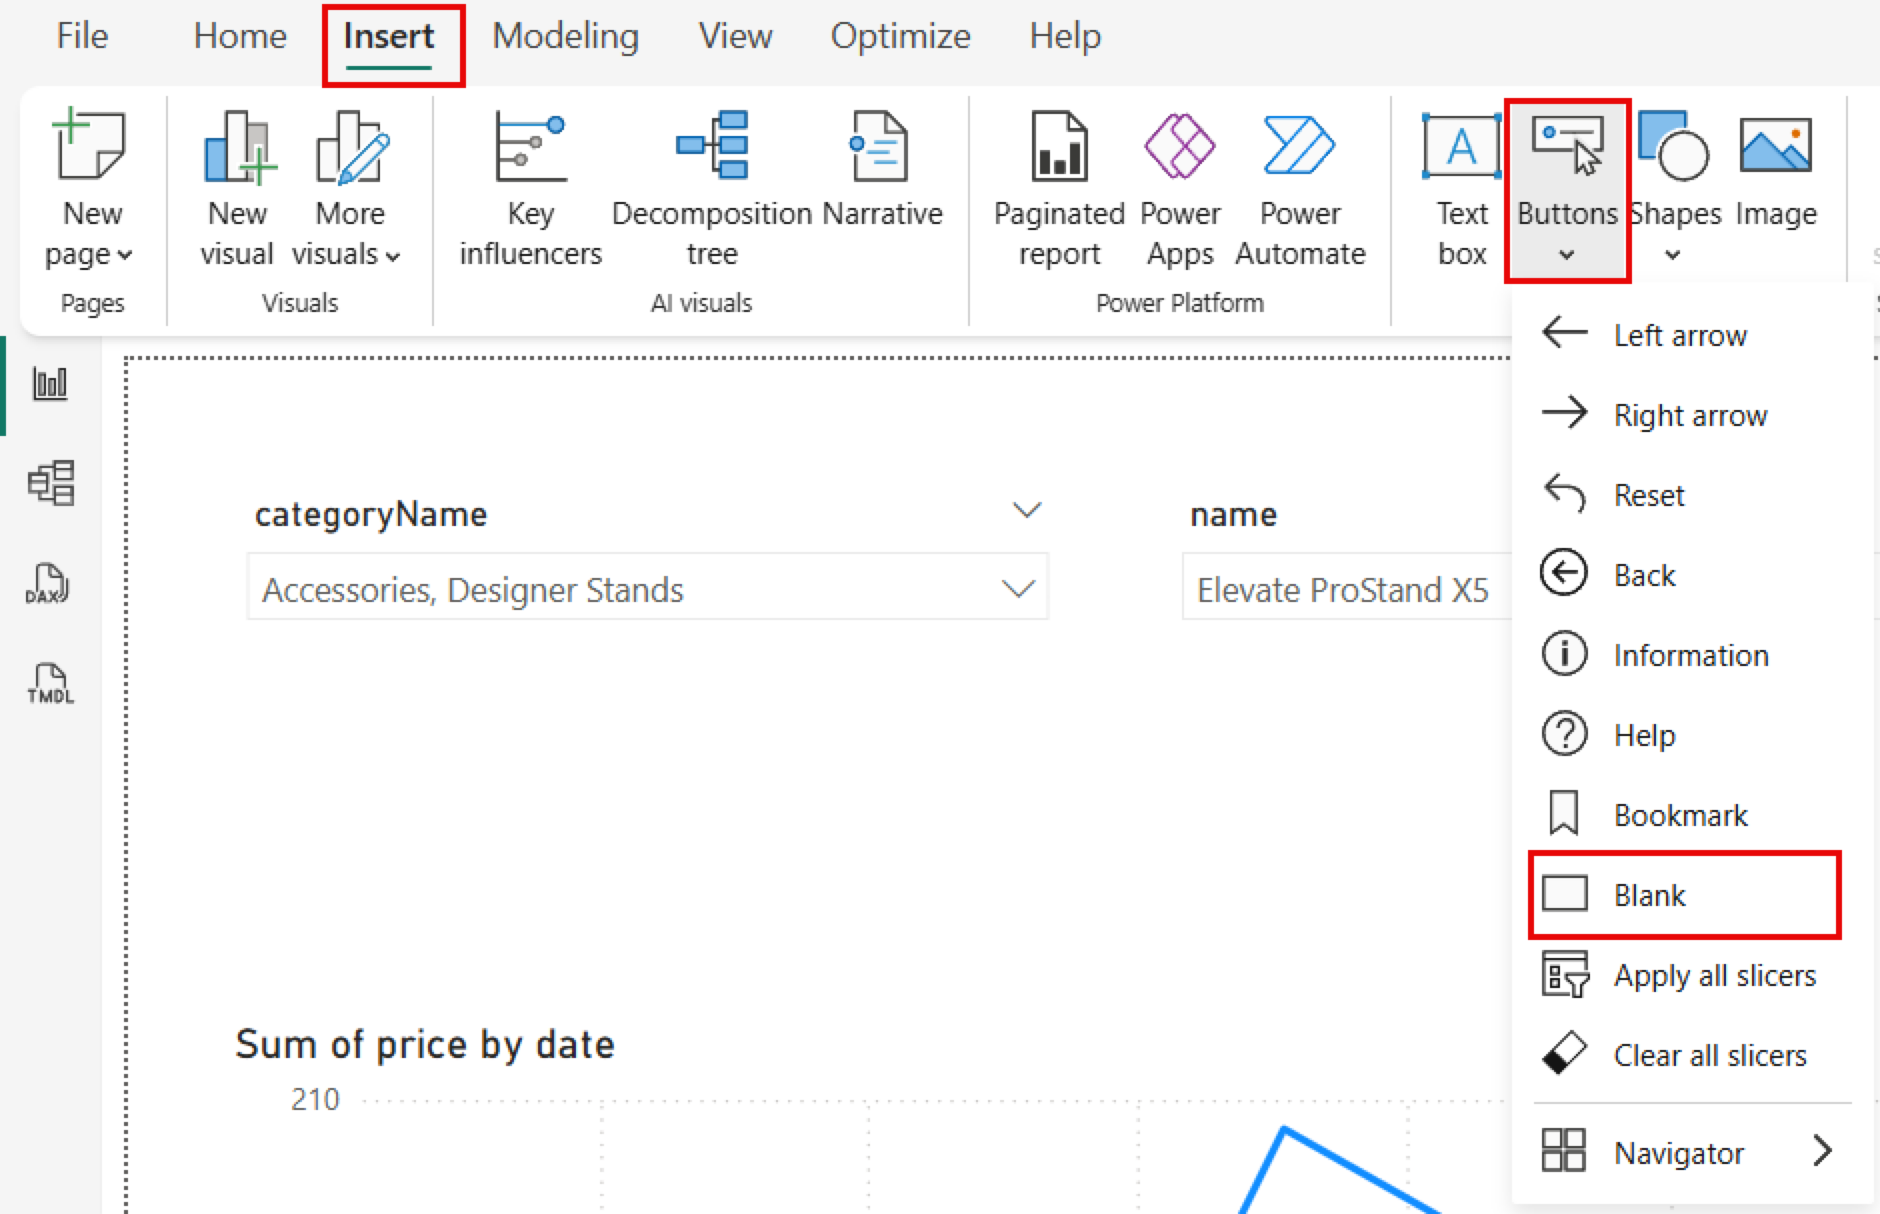
Position the button below the input slicer.
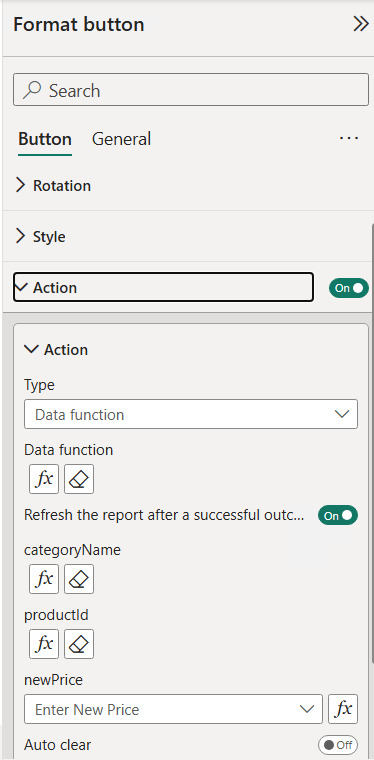
Select the button and in the Format button pane, expand Action and turn it On.
Configure the Action section with the following values:
- Type: Data function
- Data function: Select the fx button, expand
update_price_writeback, and selectupdate_price. Select Connect.
Map the function parameters:
- categoryName: Select the fx button and select the
categoryNamefield from theSampleDatatable. - productId: Select the fx button and select the
productIdfield from theSampleDatatable. - newPrice: Select
Enter New Pricefrom the dropdown.
- categoryName: Select the fx button and select the
In the Format button pane, expand Style, turn Text on, and set the button text to
Submit.In Style > Apply settings to, switch the State to Loading. Expand Text and set the value to
Submitting.
Publish and run the task flow
Save your Power BI report and select Publish from the Home tab to publish the report to your Fabric workspace.
Navigate to your Fabric workspace and open the published report.
Note
On first opening, you might encounter an error: The data source Extension is missing credentials and cannot be accessed. To resolve this:
- Open the semantic model for your report and from the top menu bar, select Settings.
- Expand the Data source credentials setting.
- Select Edit credentials.
- Select OAuth2 as the Authentication method.
- Select Sign in and sign in with your Microsoft Fabric credentials.
In the input slicer, enter a new price for the selected product.
Select Submit to invoke the User Data Function and update the product price in Cosmos DB.
After the function completes, the current price card and price history line chart update to reflect the new price. If the visuals don't refresh automatically, select the refresh button in the top menu bar.