Lineage in Fabric
In modern business intelligence (BI) projects, understanding the flow of data from the data source to its destination can be a challenge. The challenge is even bigger if you've built advanced analytical projects spanning multiple data sources, data items, and dependencies. Questions like "What happens if I change this data?" or "Why isn't this report up to date?" can be hard to answer. They might require a team of experts or deep investigation to understand. Fabric's lineage view helps you answer these questions.

In lineage view, you see the lineage relationships between all the items in a workspace, as well as data sources external to the workspace one-step upstream.
Every workspace automatically has a lineage view.
Note
Lineage in Fabric is in preview, and not all connections between items are fully supported yet. It is possible that the lineage between some items will be incorrectly shown.
Permissions
Any user with a role in a workspace can access that workspace's lineage view. However, users with the Viewer role won't see data sources.
Open lineage view
Lineage is accessible from multiple locations. Typically, you can get to it
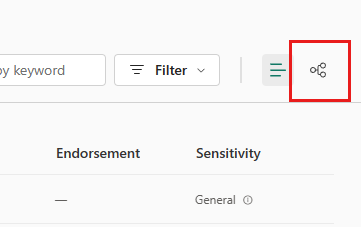
From the workspace toolbar
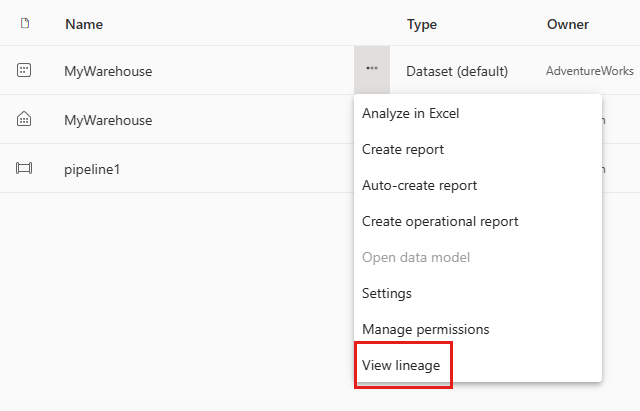
From an item's option menu (for instance, in the OneLake data hub)
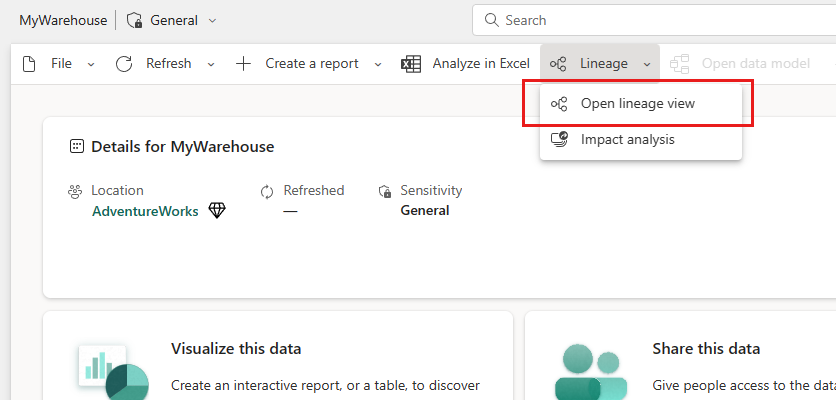
From the menu items at the top of the item's details page
What do you see in lineage view
When you open lineage view on an item, you'll see the connections between all the items in the workspace the item is located in.
Lineage view displays:
- All the items in the workspace and how they are connected to each other.
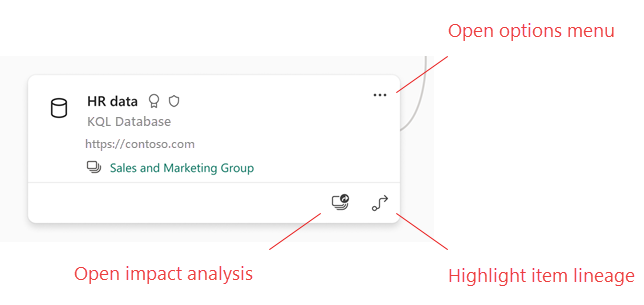
- Upstream connections outside the workspace, one level up. You can tell if an item is outside the workspace because the name of the external workspace is indicated on the card, as illustrated by the HR Data KQL Database in the image above.
Downstream items in different workspaces aren't shown. To explore an item's downstream connections outside the workspace, open the item's impact analysis.
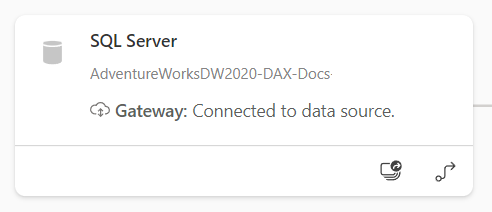
Items are represented by cards that provide some information about the item.
Data sources
You see the data sources from which the semantic models and dataflows get their data. On the data source cards, you see information that can help identify the source. For example, for Azure SQL server, you also see the database name.
Highlight an item's lineage
To highlight the lineage for a specific item, select the arrow at the bottom right corner of the card.

Fabric highlights all the items related to that item, and dims the rest.
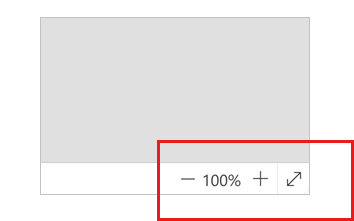
Zoom and full screen
Lineage view is an interactive canvas. You can use the mouse and touchpad to navigate in the canvas, as well as to zoom in or out.
To zoom in and out, use either the menu in the bottom-right corner or your mouse or touchpad.
To have more room for the graph itself, use the full screen option at the bottom-right corner.
Considerations and limitations
- Lineage view isn't available in Internet Explorer. For more information, see Supported browsers for Power BI.
- Correct display of the lineage between semantic models and dataflows is guaranteed only if the Get Data UI is used to set up the connection to the dataflow, and the Dataflows connector is used. Correct display of the lineage between semantic models and dataflows isn't guaranteed if a manually created Mashup query is used to connect to the dataflow.
Related content
Feedback
Coming soon: Throughout 2024 we will be phasing out GitHub Issues as the feedback mechanism for content and replacing it with a new feedback system. For more information see: https://aka.ms/ContentUserFeedback.
Submit and view feedback for