Note
Access to this page requires authorization. You can try signing in or changing directories.
Access to this page requires authorization. You can try changing directories.
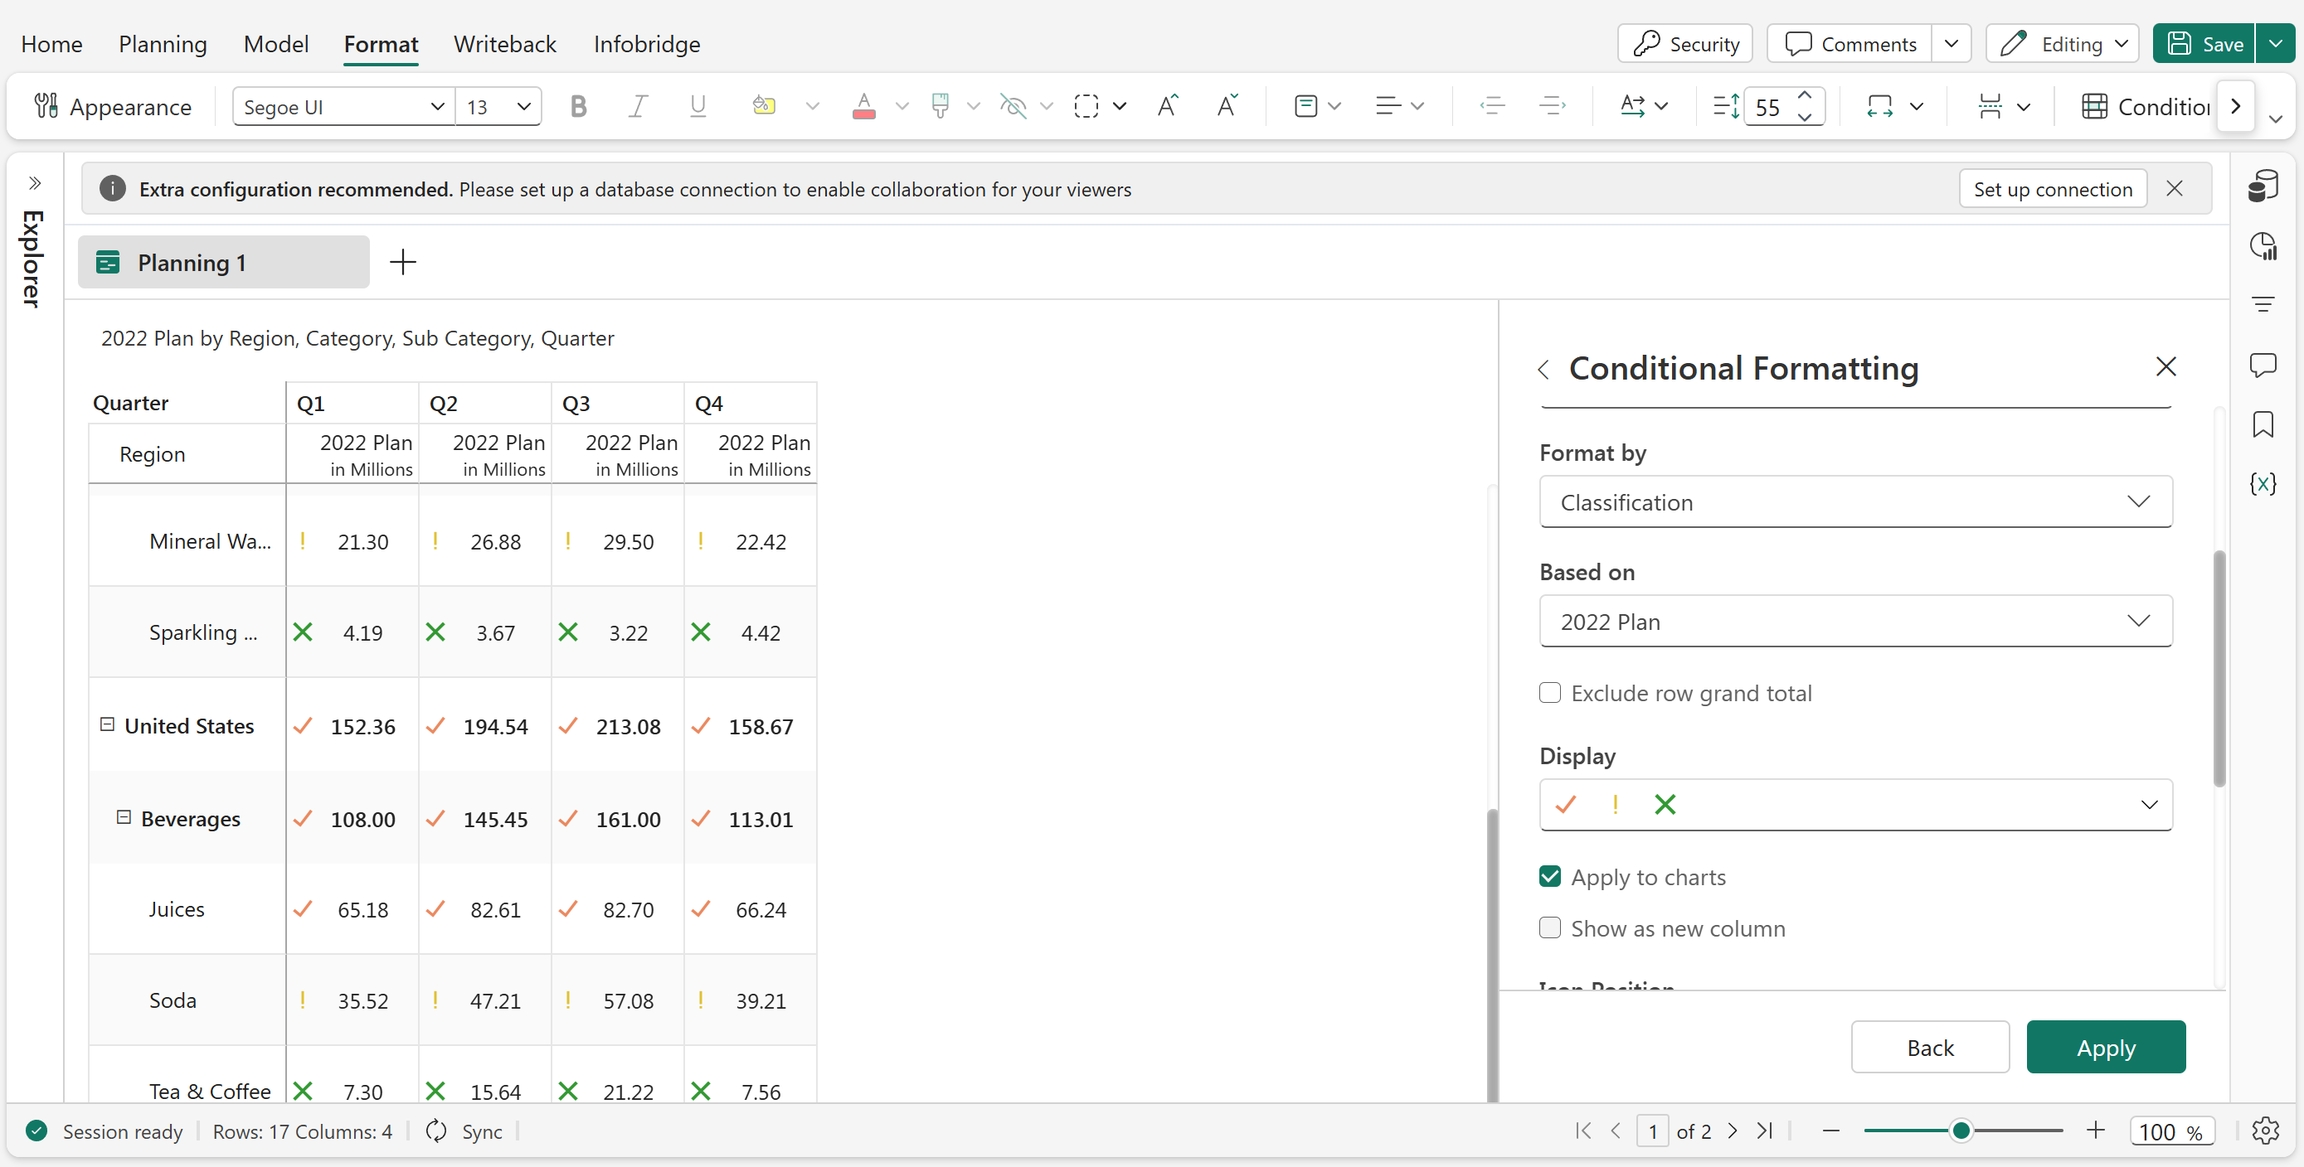
When creating conditional formatting rules, you can choose from three Format by options that determine how formatting is applied. This article explains the Classification format option in detail.
Prerequisites
- You have access to a planning sheet.
- You have created a rule in conditional formatting.
Enable format by classification
The Classification format option applies conditional formatting by grouping values into predefined categories or ranges. Each classification can be assigned a specific formatting style, such as colors, icons, or indicators, to visually differentiate values based on their category.
Classification formatting helps identify performance levels, status indicators, trends, and value distributions within the planning sheet.
Configure classification conditional formatting
You can configure the following options for classification formatting:
Display: Select the display icons from Text, Rating or Icon Set to categorize values.
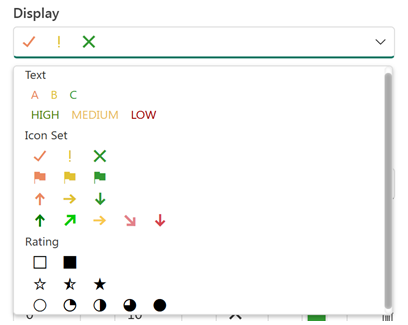
Apply to charts: Enable this option to apply the classification formatting to chart visualizations associated with the selected data.
Show as new column: Enable this option to display the classification icons in a separate column.
Icon position: Configure the position of the classification icon within the cell. It can be to the left of data, to the right of data or just the icon.
Classification ranges - Use Classification ranges to define color ranges and icons based on values or percentages. You can add or remove ranges as needed.
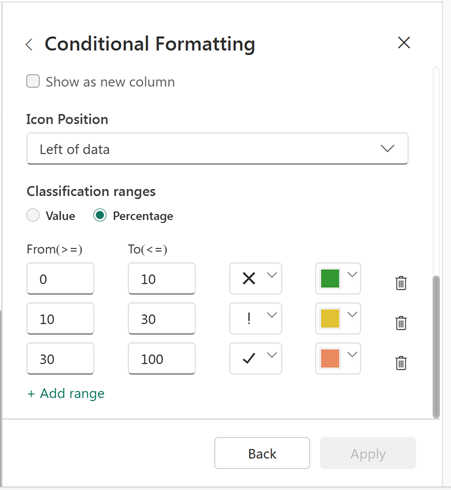
After configuring the settings, save the rule to apply classification formatting to the selected cells.