Note
Access to this page requires authorization. You can try signing in or changing directories.
Access to this page requires authorization. You can try changing directories.
In this quickstart, you use three Fabric engines to interact with the same lakehouse table. First, you query the table by using the SQL analytics endpoint. Then, you build a Power BI report in Direct Lake mode over that same table. Finally, you read the same table from a Spark notebook. Together, these steps show the core OneLake pattern: one copy of data, multiple engines.
OneLake stores tabular data in open Delta Parquet format on top of Azure Data Lake Storage (ADLS) Gen2. That shared foundation lets different Fabric engines work with the same data without having to move it or reformat it for each experience. Tools and services that support ADLS Gen2, such as Azure Databricks, Azure Synapse Analytics, and custom applications, can also reach the same data from outside Fabric.
Prerequisites
- A Fabric license. Or, sign up for a free Fabric trial.
- A Fabric workspace with a capacity assigned.
- A lakehouse that contains the
dim_productstable from the previous quickstart, Quickstart: Get data into OneLake.
Query the table by using the SQL analytics endpoint
Every lakehouse automatically gets a SQL analytics endpoint. The endpoint reads directly from the Delta tables in OneLake, so you can run T-SQL queries against your lakehouse data without copying it into a separate SQL store.
In the Fabric portal, open the workspace that contains your lakehouse and select the lakehouse.
In the upper-right corner of the lakehouse, select Analyze data with > SQL analytics endpoint from the dropdown to switch to the SQL analytics endpoint of the same item.
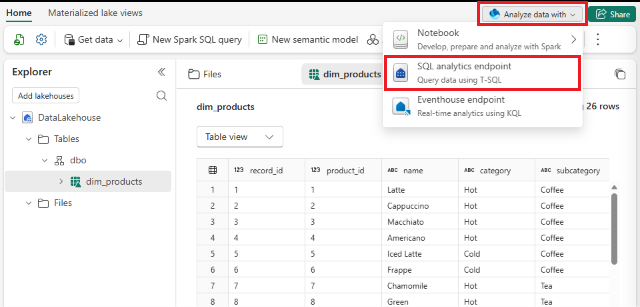
On the SQL analytics endpoint menu, select New SQL query.
In the query editor, run the following query against the
dim_productstable:This query groups by category and subcategory to show product counts and average price.
SELECT
   category,
   subcategory,
   COUNT(*) AS products,
   ROUND(AVG(standard_price), 2) AS avg_price
FROM (
   SELECT
      product_id,
      category,
      subcategory,
      standard_price,
      ROW_NUMBER() OVER (
         PARTITION BY product_id
         ORDER BY from_date DESC
      ) AS rn
   FROM dbo.dim_products
) latest
WHERE rn = 1
GROUP BY category, subcategory
ORDER BY avg_price DESC;
Review the results in the query output pane.
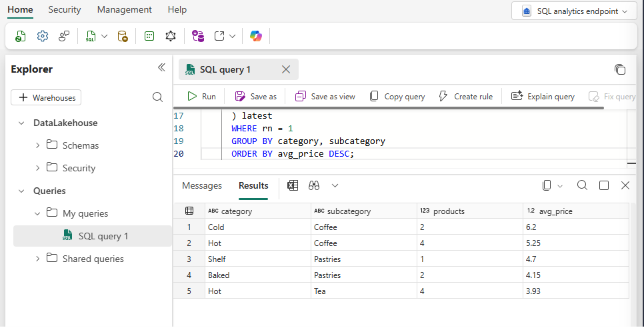
You queried the table without moving or duplicating it. The SQL analytics endpoint read the same Delta files in OneLake that the lakehouse uses.
Build a Power BI report in Direct Lake mode
Direct Lake is a Power BI storage mode that reads Delta tables from OneLake, so a semantic model can serve reports without importing or duplicating the data. Direct Lake has two modes that both read data from OneLake: Direct Lake on OneLake and Direct Lake on SQL. They differ in how the semantic model discovers tables and enforces permissions. Because this quickstart starts from the SQL analytics endpoint, the flow creates a Direct Lake on SQL semantic model.
In this section, you build a semantic model and a simple report over the same dim_products table.
The report view shows average product price by category, with each bar split by subcategory.
From the SQL analytics endpoint menu, select New semantic model.
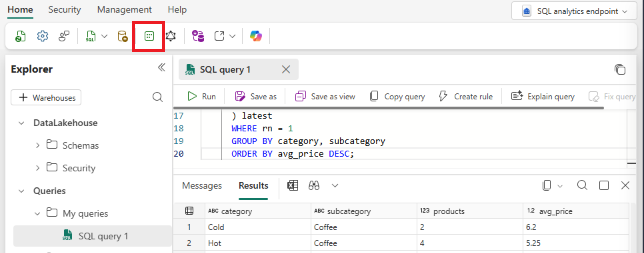
Enter a name for the semantic model, like
dim_products_model. Select thedim_productstable, and then select Confirm.From the semantic model menu, select New report.
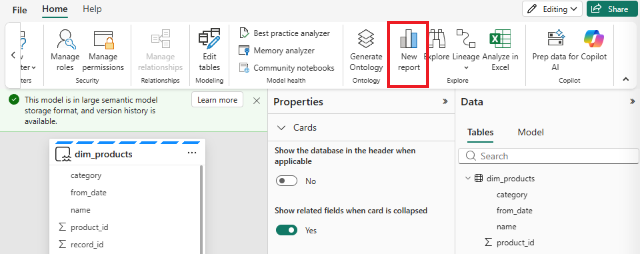
In the report authoring experience, expand the
dim_productstable in the Data pane.In the Visualizations pane, select Stacked column chart.
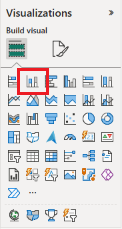
Drag
categoryto X-axis.Drag
standard_priceto Y-axis, then set the aggregation to Average.Drag
subcategoryto Legend to split each category into subcategories.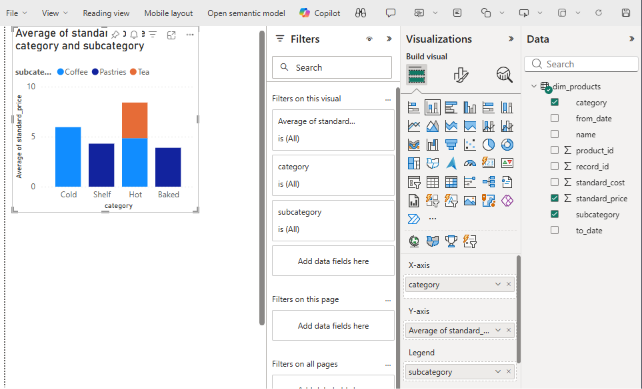
On the ribbon, select File > Save and save the report to your workspace.
The report reads from the same Delta table in OneLake that you just queried with T-SQL. You didn't create a second copy of the data to power the report.
Read the same table from a Spark notebook
Fabric notebooks give you a third engine over the same data. Spark reads the dim_products Delta table directly from OneLake, without going through the SQL analytics endpoint or the semantic model. This step shows that an engine with a completely different query stack works from the same underlying files.
Go back to the lakehouse that contains
dim_products.On the lakehouse menu, select Analyze data with > Notebook > New notebook. The notebook opens with your lakehouse already attached as the default lakehouse.
In the first code cell, paste the following PySpark code:
This code uses
from_dateas a time dimension and summarizes product count and average price by period and category.from pyspark.sql import functions as F df = spark.read.table("dim_products") summary = ( df.groupBy("from_date", "category") .agg( F.count("*").alias("products"), F.round(F.avg("standard_price"), 2).alias("avg_price"), ) .orderBy(F.col("from_date"), F.col("avg_price").desc()) ) display(summary)Select Run cell (or press Shift+Enter) to run the cell. The output shows how average prices differ by category across effective dates.
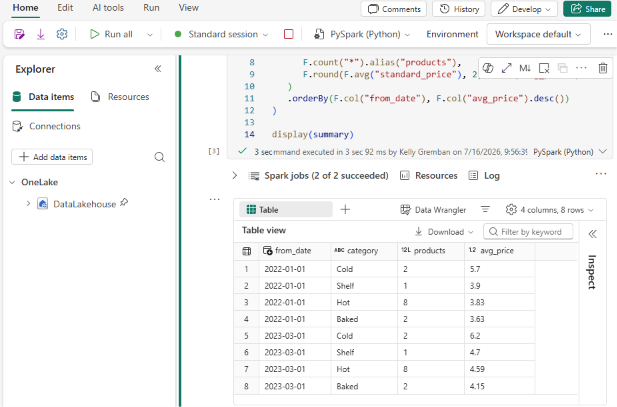
Spark reads the Delta files in OneLake directly. No data is copied into a Spark-specific store, and the table you queried is the same one that backs your semantic model. You now have one copy of data in OneLake that three engines—the SQL analytics endpoint, Power BI Direct Lake, and Spark—use through open storage and an open table format, without moving or reformatting the data.
Clean up resources
If you don't plan to continue using the semantic model, report, and notebook, delete them from your workspace:
- In your workspace, hover over the semantic model that you created and select the more options (...) menu, then select Delete.
- Repeat for the report and the notebook in your workspace.
Deleting the report, semantic model, or notebook doesn't affect the underlying lakehouse and dim_products table.