Note
Access to this page requires authorization. You can try signing in or changing directories.
Access to this page requires authorization. You can try changing directories.
In this article, you learn how to build a Power BI report using a KQL Queryset. The output of your query is used as the semantic model of your report.
To use multiple tables to build your Power BI report, see Use data from a KQL database in Power BI Desktop.
Prerequisites
- A workspace with a Microsoft Fabric-enabled capacity
- A KQL database with editing permissions
Create a report
There are three possible ways to create a report:
Option 1: Browse to a KQL queryset.
Option 2: Open the Explore your data window from a KQL database.
Write and select the query you want to build into a Power BI report. The output of this query is used as the semantic model for building the report.
From the Explore your data window, select Power BI.

Option 3: On the ribbon, select Power BI.
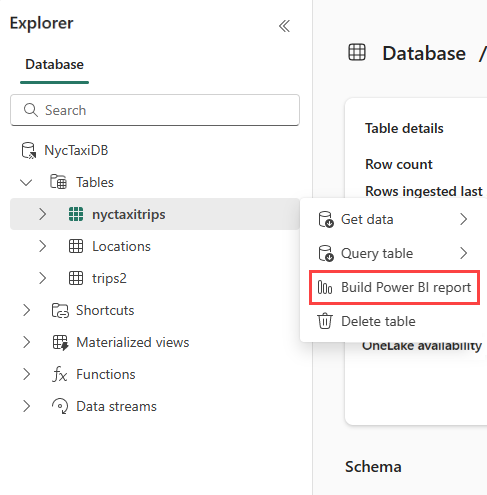
Create a report from an entire table. Browse to a KQL database.
- Select the More menu [...] of the table you want to use for the report.
- Select Power BI.

Note
When you build a report, a semantic model is created and saved in your workspace. You can create multiple reports from a single semantic model.
If you delete the semantic model, your reports will also be removed.
Report preview
You can add visualizations in the report's preview. In the Data pane, expand Kusto Query Result to see a summary of your query. For more information, see Power BI visualizations.
When you're satisfied with the visualizations, select File on the ribbon, and then Save this report to name and save your report in a workspace.

Report details
In Name your file in Power BI, give your file a name.
Select the workspace in which to save this report. The report can be a different workspace than the one you started in.

Select the sensitivity label to apply to the report. For more information, see sensitivity labels.
Select Continue.

Manage report
To view and edit your report, select Open the file in Power BI to view, edit, and get a shareable link.
