Stream real-time events from a custom app to a Microsoft Fabric KQL database
In this tutorial, you learn how to use the Microsoft Fabric event streams feature to stream real-time events from your custom application into a KQL database. You also discover how to create a near-real-time Power BI report to effectively monitor your business data.
In this tutorial, you learn how to:
- Create a KQL database and an eventstream in Microsoft Fabric.
- Configure a source (custom app) and a destination (KQL database) for the eventstream.
- Send events to the eventstream by using the custom app.
- Build a near-real-time Power BI report on data in the KQL database.
Prerequisites
Before you start, you must complete the following prerequisites:
- Get access to a premium workspace with Contributor or higher permissions where your eventstream and KQL database are located.
- Download and install the latest long-term support (LTS) version of Node.js.
- Download and install Visual Studio Code (recommended) or any other integrated development environment (IDE).
Create a KQL database and an eventstream in Microsoft Fabric
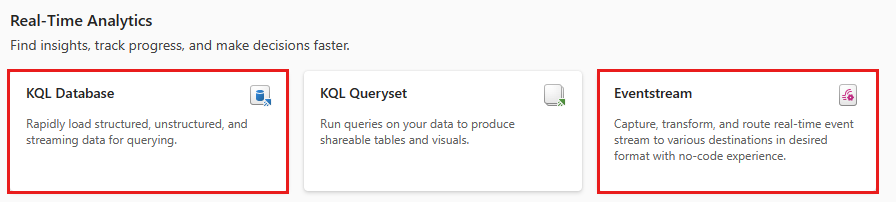
You can create a KQL database and an eventstream from the Workspace page or the Create hub page. Follow these steps to create the database, and then again to create an eventstream:
Change your Fabric experience to Real-time Analytics, and select KQL Database or Eventstream to create these items in your workspace or hub. (For best results, create the KQL database first and the eventstream second.)
On the Workspace page, select New, and then select KQL Database or Eventstream.
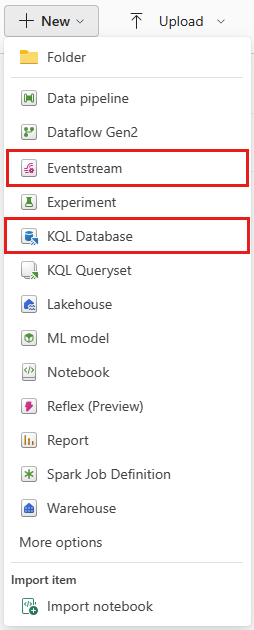
On the Create hub page, select KQL Database or Eventstream.
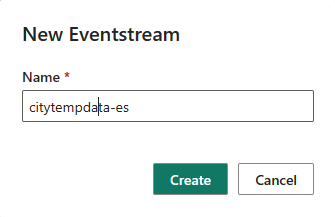
Enter the name for the new KQL database or eventstream, and then select Create. The examples in this article use citytempdb for the KQL database and citytempdata-es for the eventstream.
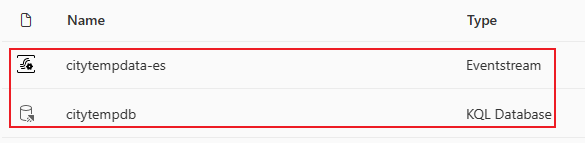
Confirm that citytempdb and citytempdata-es appear in your workspace.


Add a custom application source to the eventstream
With a custom application source, you can seamlessly connect your own application and transmit event data to your eventstream. The connection endpoint is readily available and exposed within the custom application source, so the process is streamlined.
Follow these steps to add a custom application source to your eventstream:
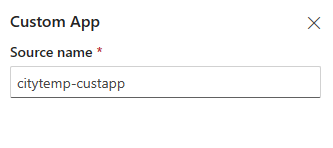
Select New source on the ribbon or the plus sign (+) in the main editor canvas, and then select Custom App. The Custom App configuration dialog appears.
Enter a Source name value for the custom app, and then select Add.
After you successfully add the custom application source, a new source node appears on the canvas. Select this node to view key information about the source on the Details tab located in the lower pane.
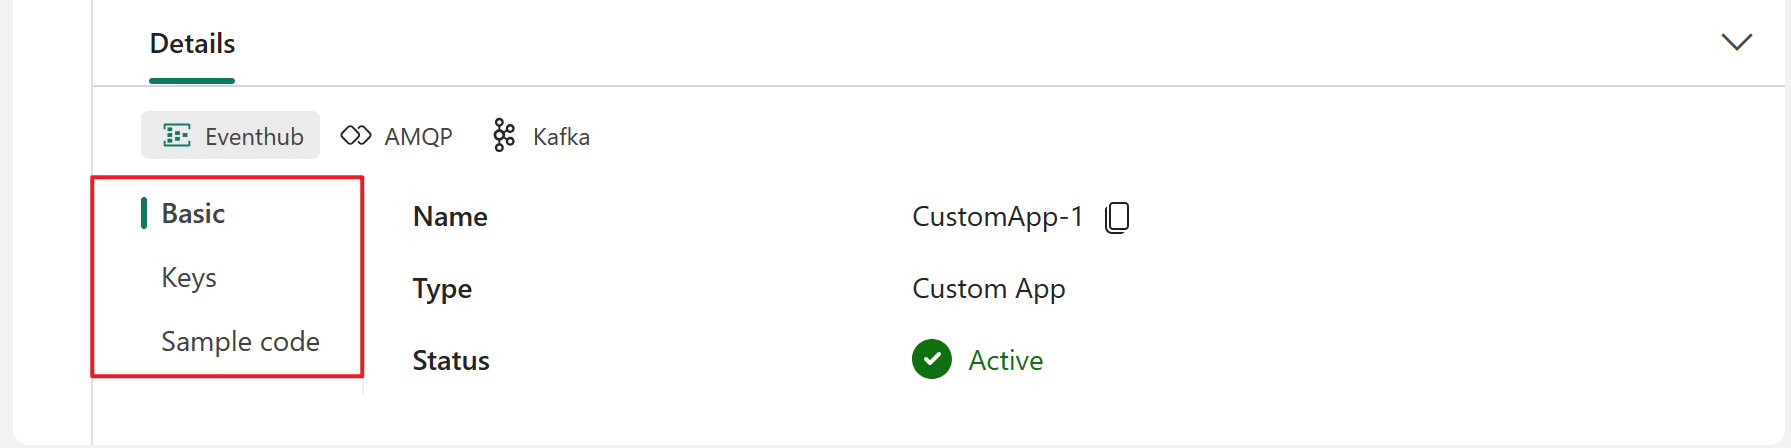
- Basic: Shows the name, description, type and status of your custom app.
- Keys: Shows the connection string for your custom app, which you can copy and paste into your application.
- Sample code: Shows sample code, which you can refer to or copy to push the event data to this eventstream or pull the event data from this eventstream.
For each tab (Basic / Keys / Sample code), you can also switch three protocol tabs: Eventhub, AMQP and Kafka to access diverse protocol formats information.
The connection string displayed on the Details tab is compatible with Azure Event Hubs. You can copy and use this connection string in your application to send events to your eventstream. The following example shows what the connection string looks like:
Endpoint=sb://eventstream-xxxxxxxx.servicebus.windows.net/;SharedAccessKeyName=key_xxxxxxxx;SharedAccessKey=xxxxxxxx;EntityPath=es_xxxxxxxx

Create an application to send events to the eventstream
With a connection string to an event hub readily available in the custom app source, you can create an application that sends events to your eventstream. In the following example, the application simulates 10 sensor devices that transmit temperature and humidity data nearly every second.
Open your code editor, such as Visual Studio Code.
Create a file called sendtoes.js, and paste the following code into it. Replace the placeholders with the real values in Connection string-primary key or Connection string-secondary key.
For example:
Endpoint=sb://eventstream-xxxxxxxx.servicebus.windows.net/;SharedAccessKeyName=key_xxxxxxxx;SharedAccessKey=xxxxxxxx;EntityPath=es_xxxxxxxx
In this example, the connection string is
Endpoint=sb://eventstream-xxxxxxxx.servicebus.windows.net/;SharedAccessKeyName=key_xxxxx;SharedAccessKey=xxxxxxxx. The entity name is the string afterEntityPath=, which ises_xxxxxxxx.const { EventHubProducerClient } = require("@azure/event-hubs"); var moment = require('moment'); const connectionString = "CONNECTION STRING"; const entityName = "ENTITY NAME"; //Generate event data function getRowData(id) { const time = moment().toISOString(); const deviceID = id + 100; const humidity = Math.round(Math.random()*(65-35) + 35); const temperature = Math.round(Math.random()*(37-20) + 20); return {"entryTime":time, "messageId":id, "temperature":temperature, "humidity":humidity, "deviceID":deviceID}; } function sleep(ms) { return new Promise(resolve => setTimeout(resolve, ms)); } async function main() { // Create a producer client to send messages to the eventstream. const producer = new EventHubProducerClient(connectionString, entityName); // There are 10 devices. They're sending events nearly every second. So, there are 10 events in one batch. // The event counts per batch. For this case, it's the sensor device count. const batchSize = 10; // The event batch count. If you want to send events indefinitely, you can increase this number to any desired value. const batchCount = 5; // Generating and sending events... for (let j = 0; j < batchCount; ++j) { const eventDataBatch = await producer.createBatch(); for (let k = 0; k < batchSize; ++k) { eventDataBatch.tryAdd({ body: getRowData(k) }); } // Send the batch to the eventstream. await producer.sendBatch(eventDataBatch); console.log(moment().format('YYYY/MM/DD HH:mm:ss'), `[Send events to Fabric Eventstream]: batch#${j} (${batchSize} events) has been sent to eventstream`); // sleep for 1 second. await sleep(1000); } // Close the producer client. await producer.close(); console.log(moment().format('YYYY/MM/DD HH:mm:ss'), `[Send events to Fabric Eventstream]: All ${batchCount} batches have been sent to eventstream`); } main().catch((err) => { console.log("Error occurred: ", err); });To run this script, you need to install the required packages. Open your PowerShell command prompt, go to the same folder as sendtoes.js, and run the following commands:
npm install @azure/event-hubs
npm install moment
Run
node sendtoes.jsin a PowerShell command prompt to execute the file. The window should display messages about sending events.C:\wa>node sendtoes.js 2023/06/12 20:35:39 [Send events to Fabric Eventstream]: batch#0 (10 events) has been sent to eventstream 2023/06/12 20:35:41 [Send events to Fabric Eventstream]: batch#1 (10 events) has been sent to eventstream 2023/06/12 20:35:42 [Send events to Fabric Eventstream]: batch#2 (10 events) has been sent to eventstream 2023/06/12 20:35:44 [Send events to Fabric Eventstream]: batch#3 (10 events) has been sent to eventstream 2023/06/12 20:35:45 [Send events to Fabric Eventstream]: batch#4 (10 events) has been sent to eventstream 2023/06/12 20:35:47 [Send events to Fabric Eventstream]: All 5 batches have been sent to eventstreamGo to your eventstream's main editor canvas and select your eventstream node. Then select the Data preview tab on the lower pane.
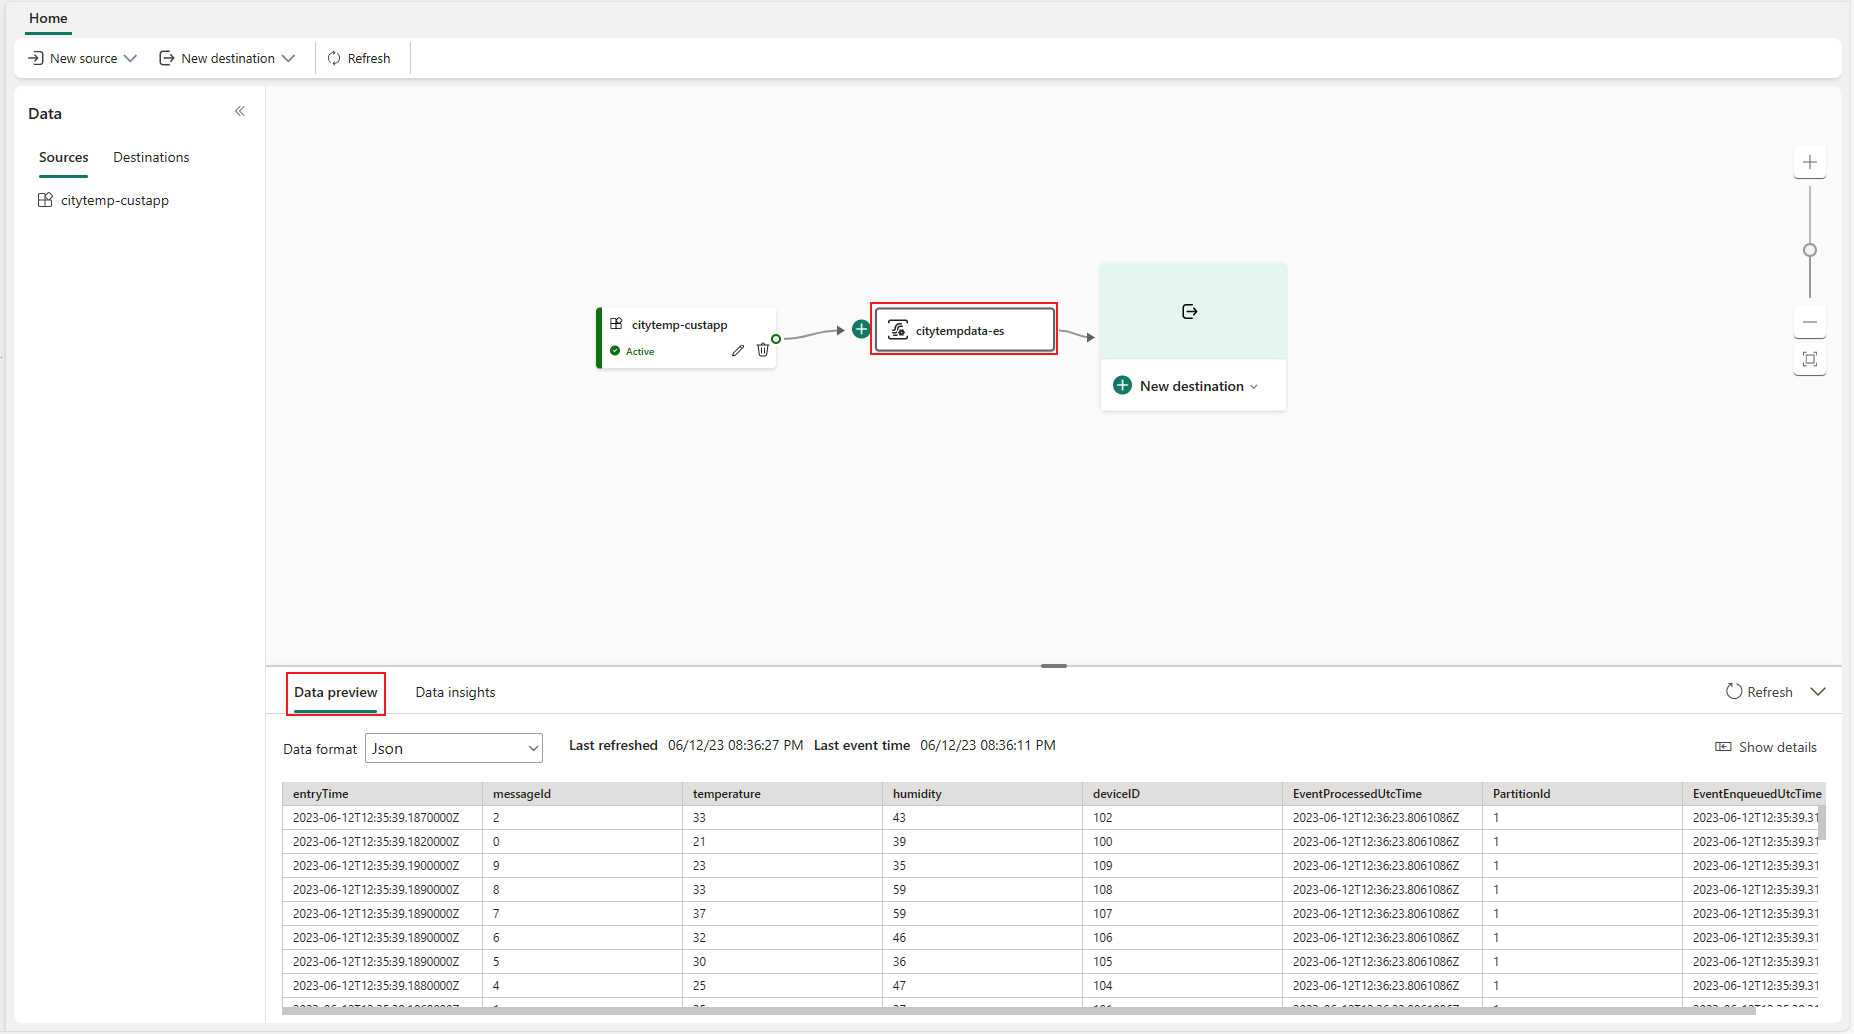
You can also view the data metrics to confirm that the data streamed into your eventstream by selecting the Data insights tab.


Add a KQL Database destination to the eventstream
While the custom application is streaming events into your eventstream, you can add and configure the KQL Database destination to receive the events from your eventstream. To add a KQL Database destination, follow these steps:
Select New destination on the ribbon or + in the main editor canvas, and then select KQL Database.
Enter a destination name, select a workspace, and choose a KQL database from the selected workspace.

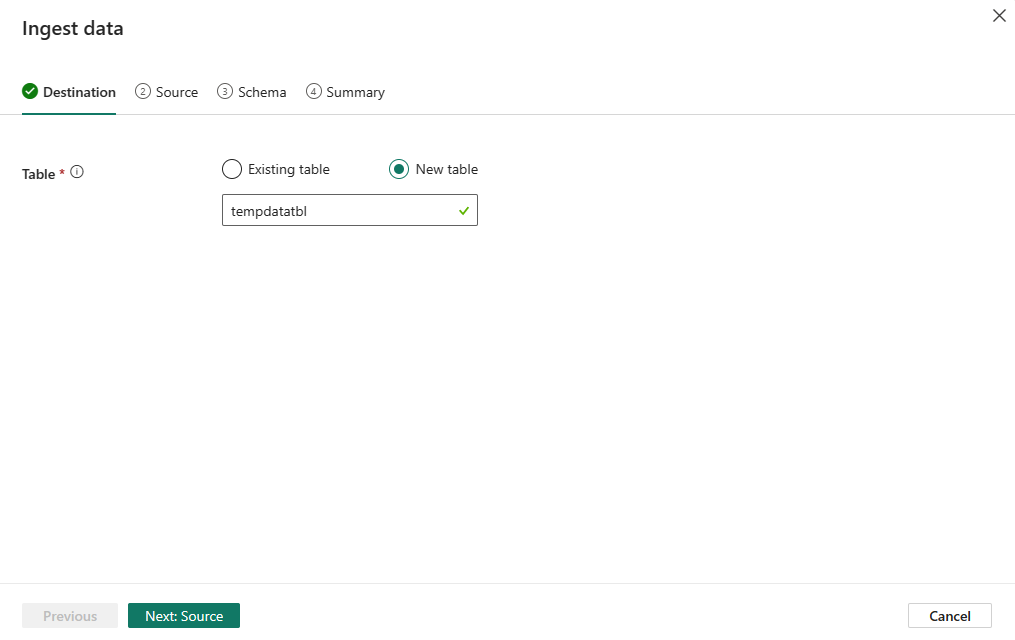
Select Add and configure to start the data ingestion wizard. On the Destination tab, enter a name for the KQL table and then select Next: Source.
On the Source tab, verify your eventstream source and then select Next: Schema.

On the Schema tab, select JSON as the data format. You can preview the data on the right pane. If the data type doesn't meet your expectations, you can modify it by selecting the arrow in the table heading. You can also add or remove columns based on your requirements. When you're done, select Next: Summary.

On the Summary tab, you can review the configuration and status summary. If everything is correct, select Done to finish the configuration. Event data starts flowing into your KQL database, and the KQL Database destination appears on the canvas.
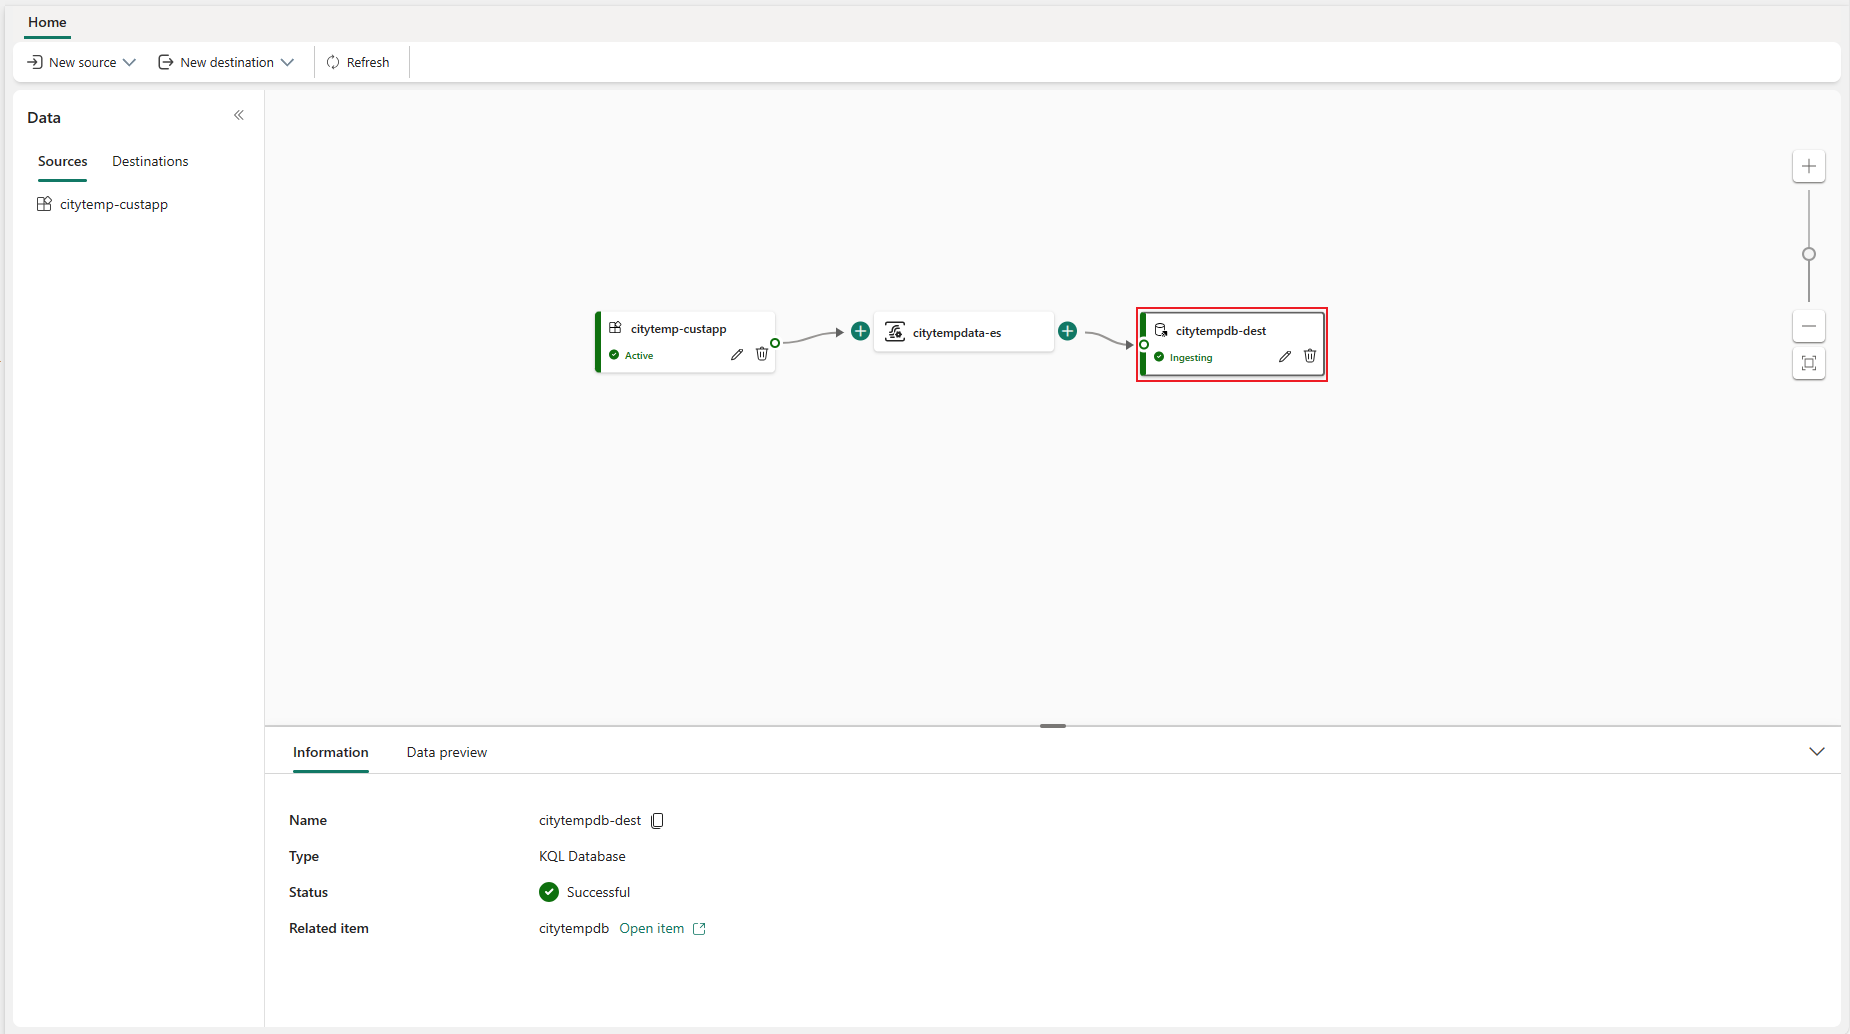


Verify data in the KQL database
To verify the event data in your new KQL database:
On the canvas, select the KQL database destination node. Then select the Information tab on the lower pane.
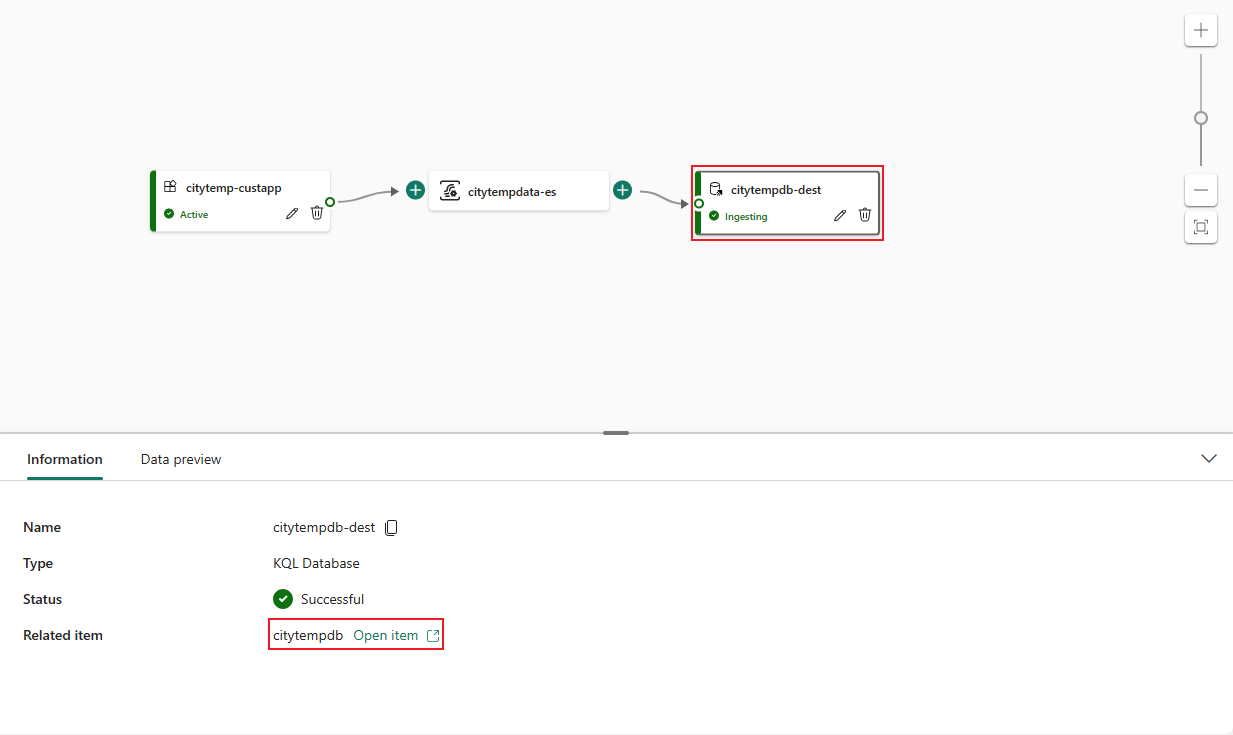
On the Information tab, select Open item next to citytempdb.
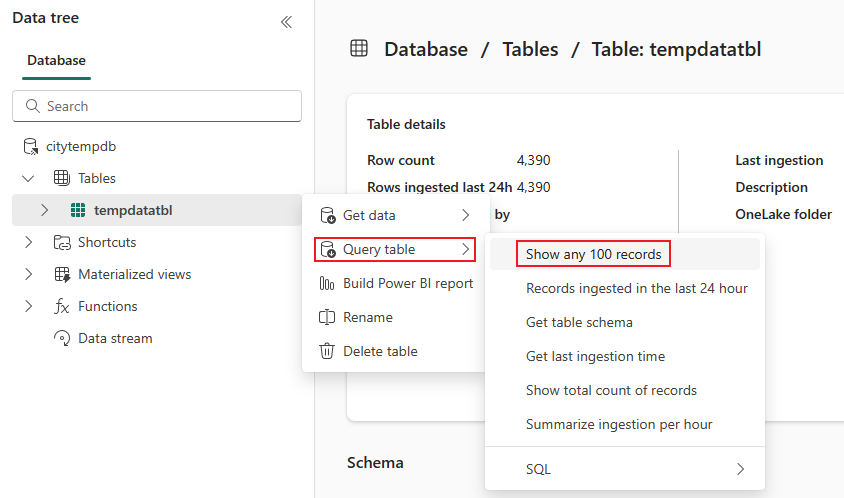
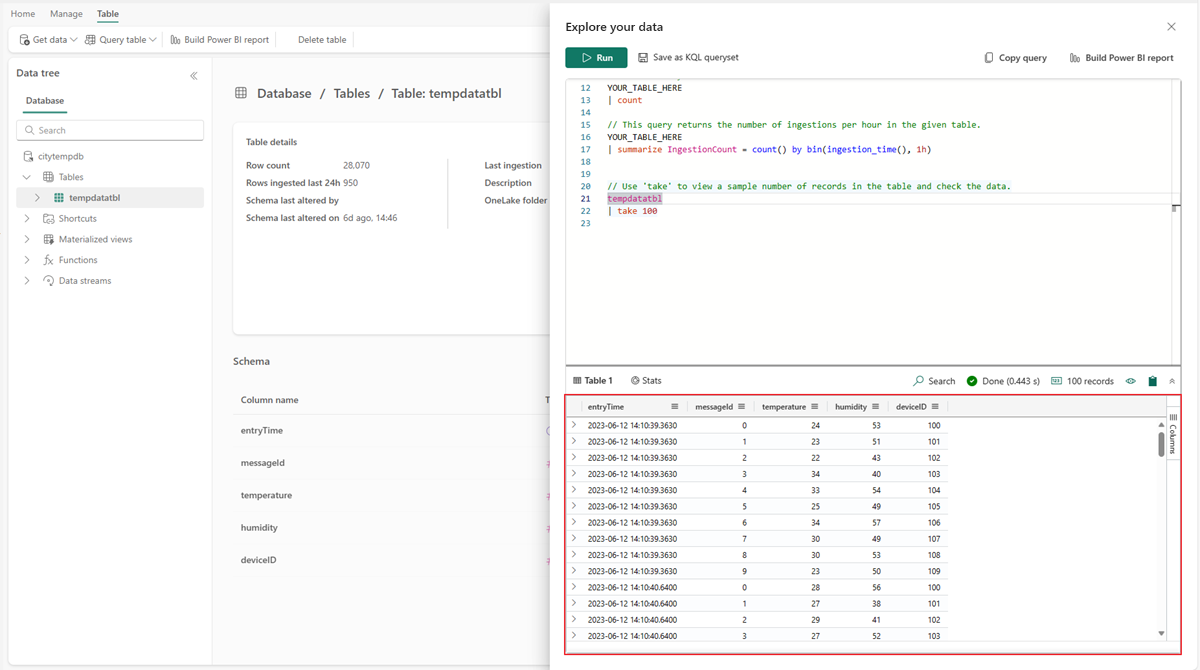
In the citytempdb KQL database, select the tempdatatbl table. Then select Query table > Show any 100 records to view the data.
Confirm that the data appears in the lower section of the Explore your data panel.


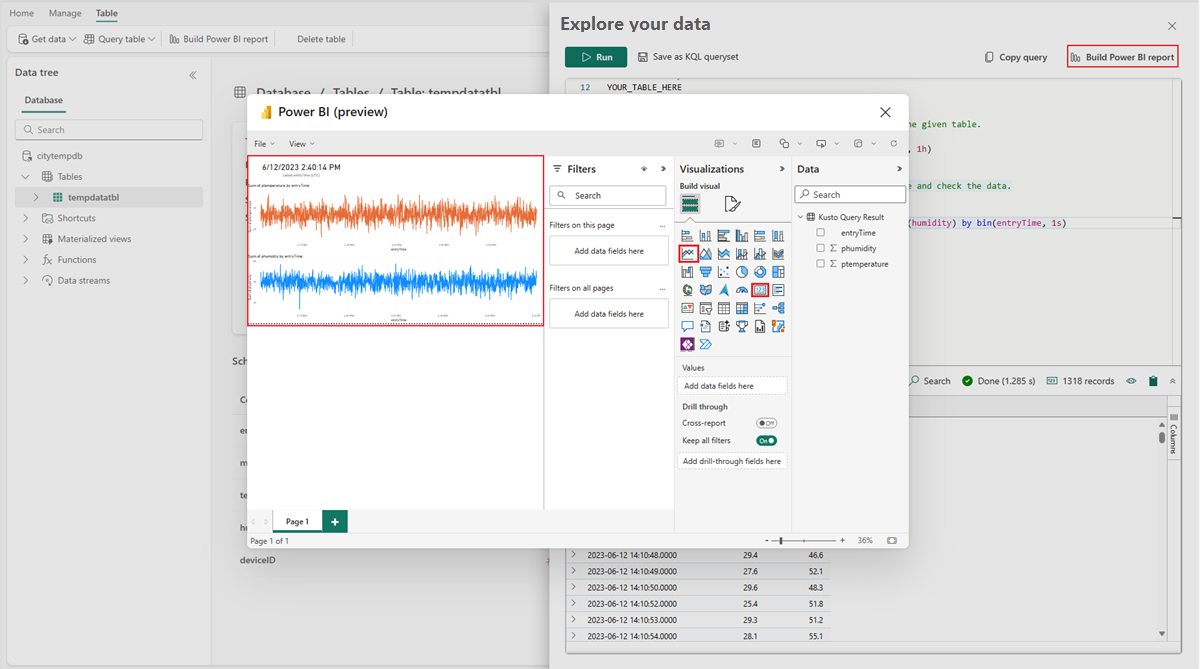
Build a near-real-time Power BI report with the event data ingested in the KQL database
After the data is ingested into your KQL database, you can analyze it according to your specific needs. For example, if you want to track the temperature and humidity trends over the last two hours in near real time, you can write a KQL query to retrieve that data. Then you can enable automatic refresh and visualize the results in a Power BI report.
In a KQL query window that shows any 100 records, modify the query as follows:
// Use 'take' to view a sample number of records in the table and check the data.
tempdatatbl
| where entryTime > now(-2h)
| summarize ptemperature = avg(temperature), phumidity = avg(humidity) by bin(entryTime, 1s)
Note
You use the
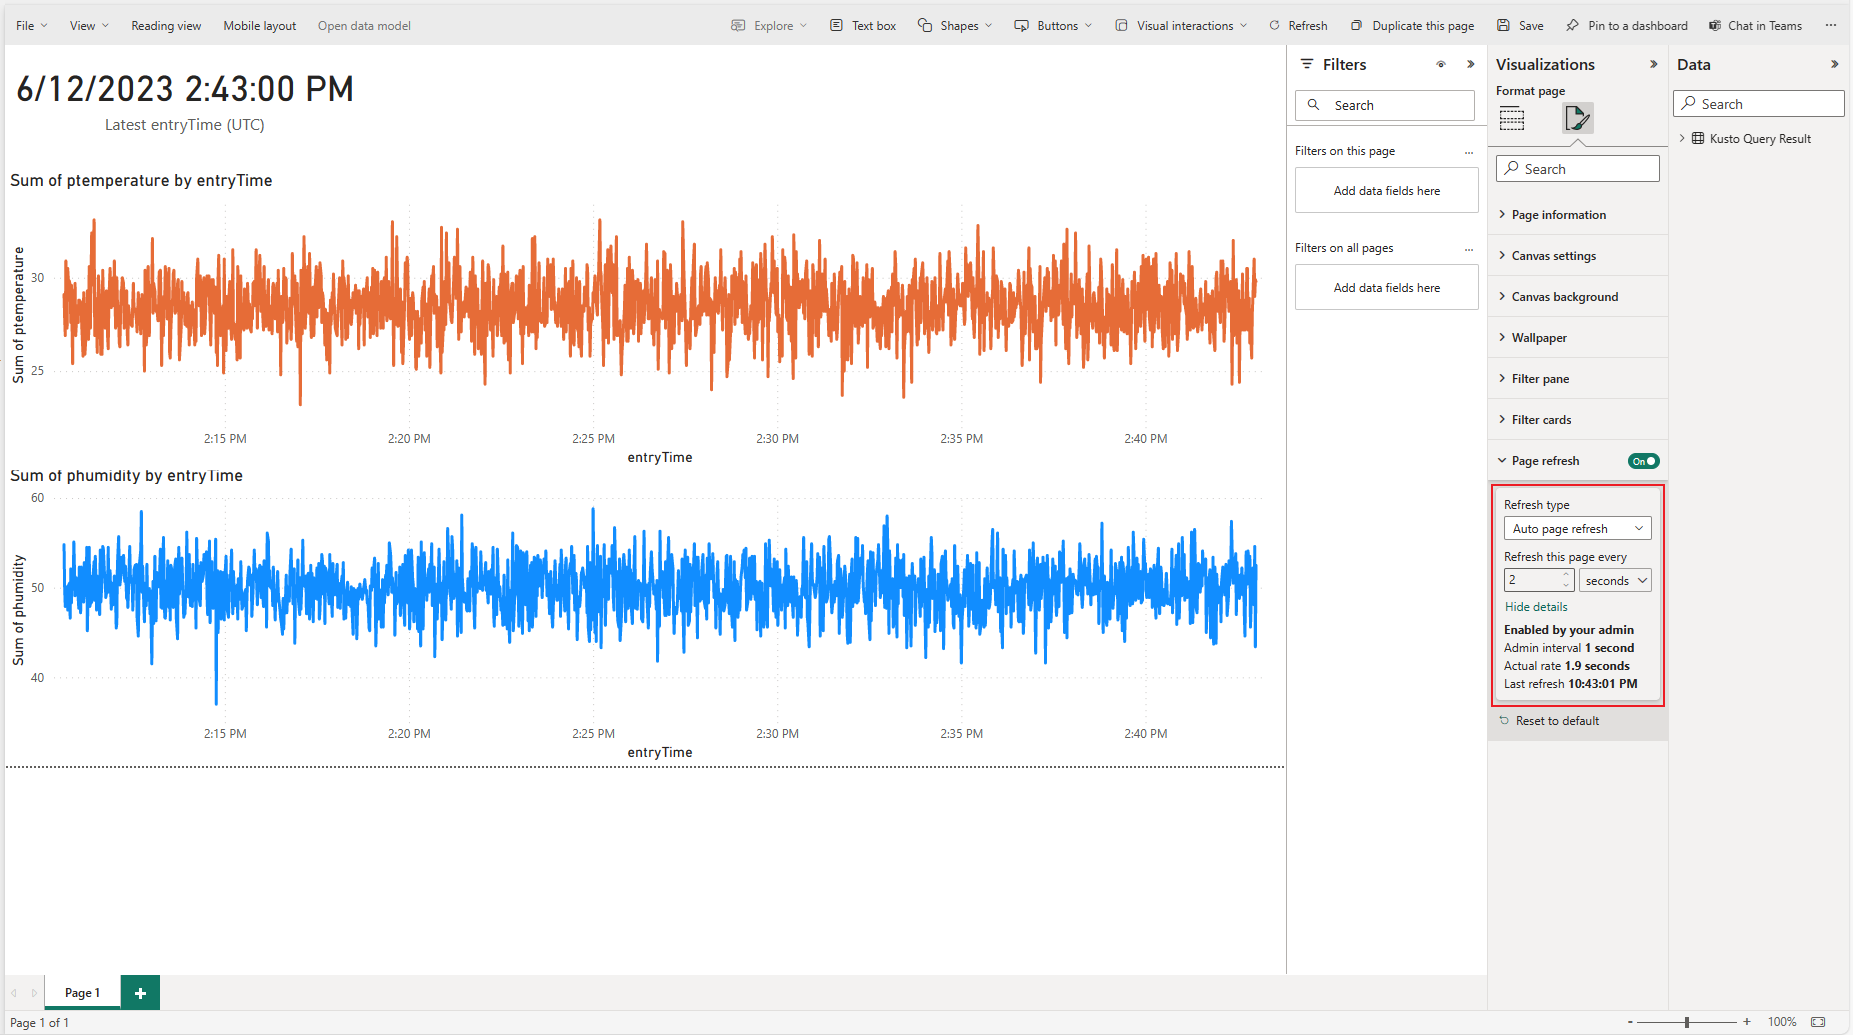
avgoperator because 10 sensor devices emit data every second.Select Build Power BI report to create your report. In the Power BI report dialog, add two line charts into the report. Select temperature, humidity and entryTime data for both charts to monitor the data. You can also add a card to the report to display the latest entryTime data, so you can monitor the most recent event time.
After you complete the report configuration, select File > Save to save this report to your workspace.
For automatic data refreshes, select Edit in the Power BI report. Go to the Format page under Visualizations, select Page refresh, and set the refresh interval.
Note
The admin interval controls the minimum refresh interval.


Related content
In this tutorial, you learned how to stream real-time events from your own application to a KQL database. Then you used the KQL query semantic model to create a near-real-time Power BI report, which enables you to visualize business insights from your event data.
If you want to discover more advanced functionalities for working with Fabric eventstreams, you might find the following resources helpful:
Feedback
Coming soon: Throughout 2024 we will be phasing out GitHub Issues as the feedback mechanism for content and replacing it with a new feedback system. For more information see: https://aka.ms/ContentUserFeedback.
Submit and view feedback for