What is Real-Time Analytics in Fabric?
The last few decades have seen a paradigm shift in the way we access and consume information, as users have become used to data that is interactive, on demand, and accessible to all. This shift has been powered by big data, streaming data ingestion, and indexed, keyword-based search. All together they form a simplified user experience. With Real-Time Analytics in Microsoft Fabric, we enable organizations to focus and scale up their analytics solution while democratizing data for the needs of both the citizen data scientist all the way to the advanced data engineer. Real-time analytics have become essential in many scenarios in the enterprise world, such as cybersecurity, asset tracking and management, predictive maintenance, supply chain optimization, customer experience, energy management, inventory management, quality control, environmental monitoring, fleet management, and health and safety.
How? Real-Time Analytics reduces complexity and simplifies data integration. Gain quick access to data insights with just seconds of provisioning, automatic data streaming, indexing, and partitioning for any data source or format, and on-demand query generation and visualizations. This user process is simplified while preserving powerful analytical capabilities. Real-Time Analytics lets you focus on your analytics solutions by scaling up seamlessly with the service as your data and query needs grow.

Real-Time Analytics is a fully managed big data analytics platform optimized for streaming, and time-series data. It utilizes a query language and engine with exceptional performance for searching structured, semi-structured, and unstructured data. Real-Time Analytics is fully integrated with the entire suite of Fabric products, for both data loading, data transformation, and advanced visualization scenarios.
What makes Real-Time Analytics unique?
- Capture, transform, and route real-time events to various destinations, including custom apps.
- Easily ingest or load data from any source, in any data format.
- Run analytical queries directly on raw data without the need to build complex data models or create scripting to transform the data.
- Import data with by-default streaming that provides high performance, low latency, high freshness data analysis.
- Imported data undergoes default partitioning - both time and hash-based partitioning, and by-default indexing.
- Work with versatile data structures including query structured, semi-structured, or free text.
- Query raw data without transformation, with high performance, incredibly low response time, while using a wide variety of available operators.
- Manage an unlimited amount of data, from gigabytes to petabytes, with unlimited scale on concurrent queries and concurrent users.
- Built-in autoscale adjusts resources to match workload factors like cache, memory, CPU usage, and ingestion, optimizing performance and minimizing cost.
- Integrate seamlessly with other experiences and items in Microsoft Fabric.
When to use Real-Time Analytics?
If any one of these questions describes your data needs, Real-Time Analytics is the right solution for you:
- Do I need high freshness from data ingestion to query?
- Do I want to transform streaming data?
- Do I have a service that needs to access data with low query latency (in a matter of seconds)?
- Do I need to search or access data in different formats, like structured data, semi-structured data (including complicated data such as JSON or other arrays), or unstructured data (for example, free text)?
- Do I want the ability to query large amounts of data?
- Does my data have a time component that can benefit from the time series-optimized database structure?
- Do I want the ability to create ad-hoc queries on any field or row without prior optimization?
The types of industries that benefit from data analysis in Real-Time Analytics is varied. For example: finance, transportation and logistics, smart cities, smart buildings, manufacturing operations, automotive, and oil and gas.
Scenarios
Marketing
As a marketing specialist implementing a new campaign, Real-Time Analytics allows you to analyze the immediate impact of your campaign on sales, inventory, and logistics. You can stream large volumes of data into your KQL database through Eventstream with a latency of a few seconds, then use a KQL queryset to analyze your campaign's performance and visualize your findings in a shareable Power BI report. You can use these insights to immediately modify the different aspects of your campaign and easily view the effect in real-time. You can also grant view access for your KQL database to different teams in your company, such as the finance and production teams to analyze your streaming data and make adjustments to the cost and production of the product accordingly.
Sales
As a business analyst working for a global retail chain, you're responsible for analyzing the incoming data and communicating your insights to key stakeholders in your business. You can collect and store data from a variety of different sources, such as manufacturers, shippers, suppliers, and in a variety of formats, such as structured, semi-structured, and unstructured data. All this actionable data is captured in a KQL database, providing a scalable data solution for your growing data that can hold billions of records that can be retained for years on end for you to query and compare with the streaming data. Not only can you use a KQL queryset to perform time series analysis, but you can also create Power BI reports visualizing geospatial analytics of land and maritime routes, quickly detect anomalies, and collaborate with project managers on dashboards to make better business decisions.
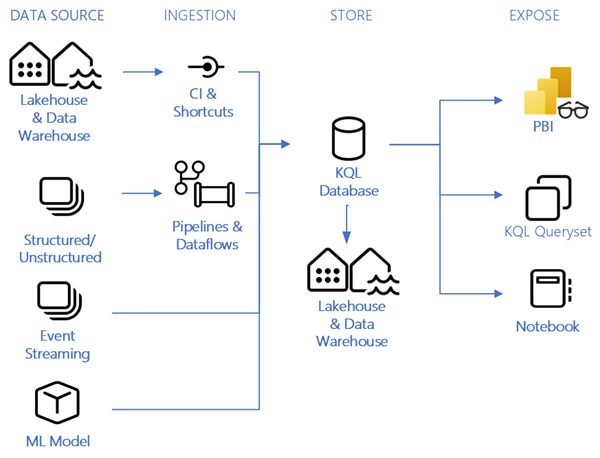
How to work in Real-Time Analytics?
The main items available in Real-Time Analytics include:
- Eventstream for capturing, transforming, and routing real-time events to various destinations with a no-code experience.
- A KQL database for data storage and management. Data loaded into a KQL database can be accessed in OneLake and is exposed to other Fabric experiences.
- A KQL queryset to run queries, view, and customize query results on data. The KQL queryset allows you to save queries for future use, export and share queries with others, and includes the option to generate a Power BI report.
See how these items work together in the end-to-end streaming data consumption and analysis scenario: Real-Time Analytics Tutorial- Introduction
Integration with other experiences
- Create Event Hubs cloud connections to stream data into Real-Time Analytics.
- Data in OneLake is accessed by Real-Time Analytics in several ways:
- Data from OneLake can be queried from Real-Time Analytics as a shortcut.
- Data from OneLake can be loaded into Real-Time Analytics.
- Data loaded into Real-Time Analytics is reflected in OneLake as one logical copy.
- Data loaded into Real-Time Analytics can be used as the underlying data for visualization in a Power BI report.
- Data loaded into Real-Time Analytics can be used for analysis in Spark Notebooks in Data Engineering.
- Trigger data loading events in Data Factory using pipelines.
- Trigger data loading events using Dataflows.
Related content
Feedback
Coming soon: Throughout 2024 we will be phasing out GitHub Issues as the feedback mechanism for content and replacing it with a new feedback system. For more information see: https://aka.ms/ContentUserFeedback.
Submit and view feedback for