Note
Access to this page requires authorization. You can try signing in or changing directories.
Access to this page requires authorization. You can try changing directories.
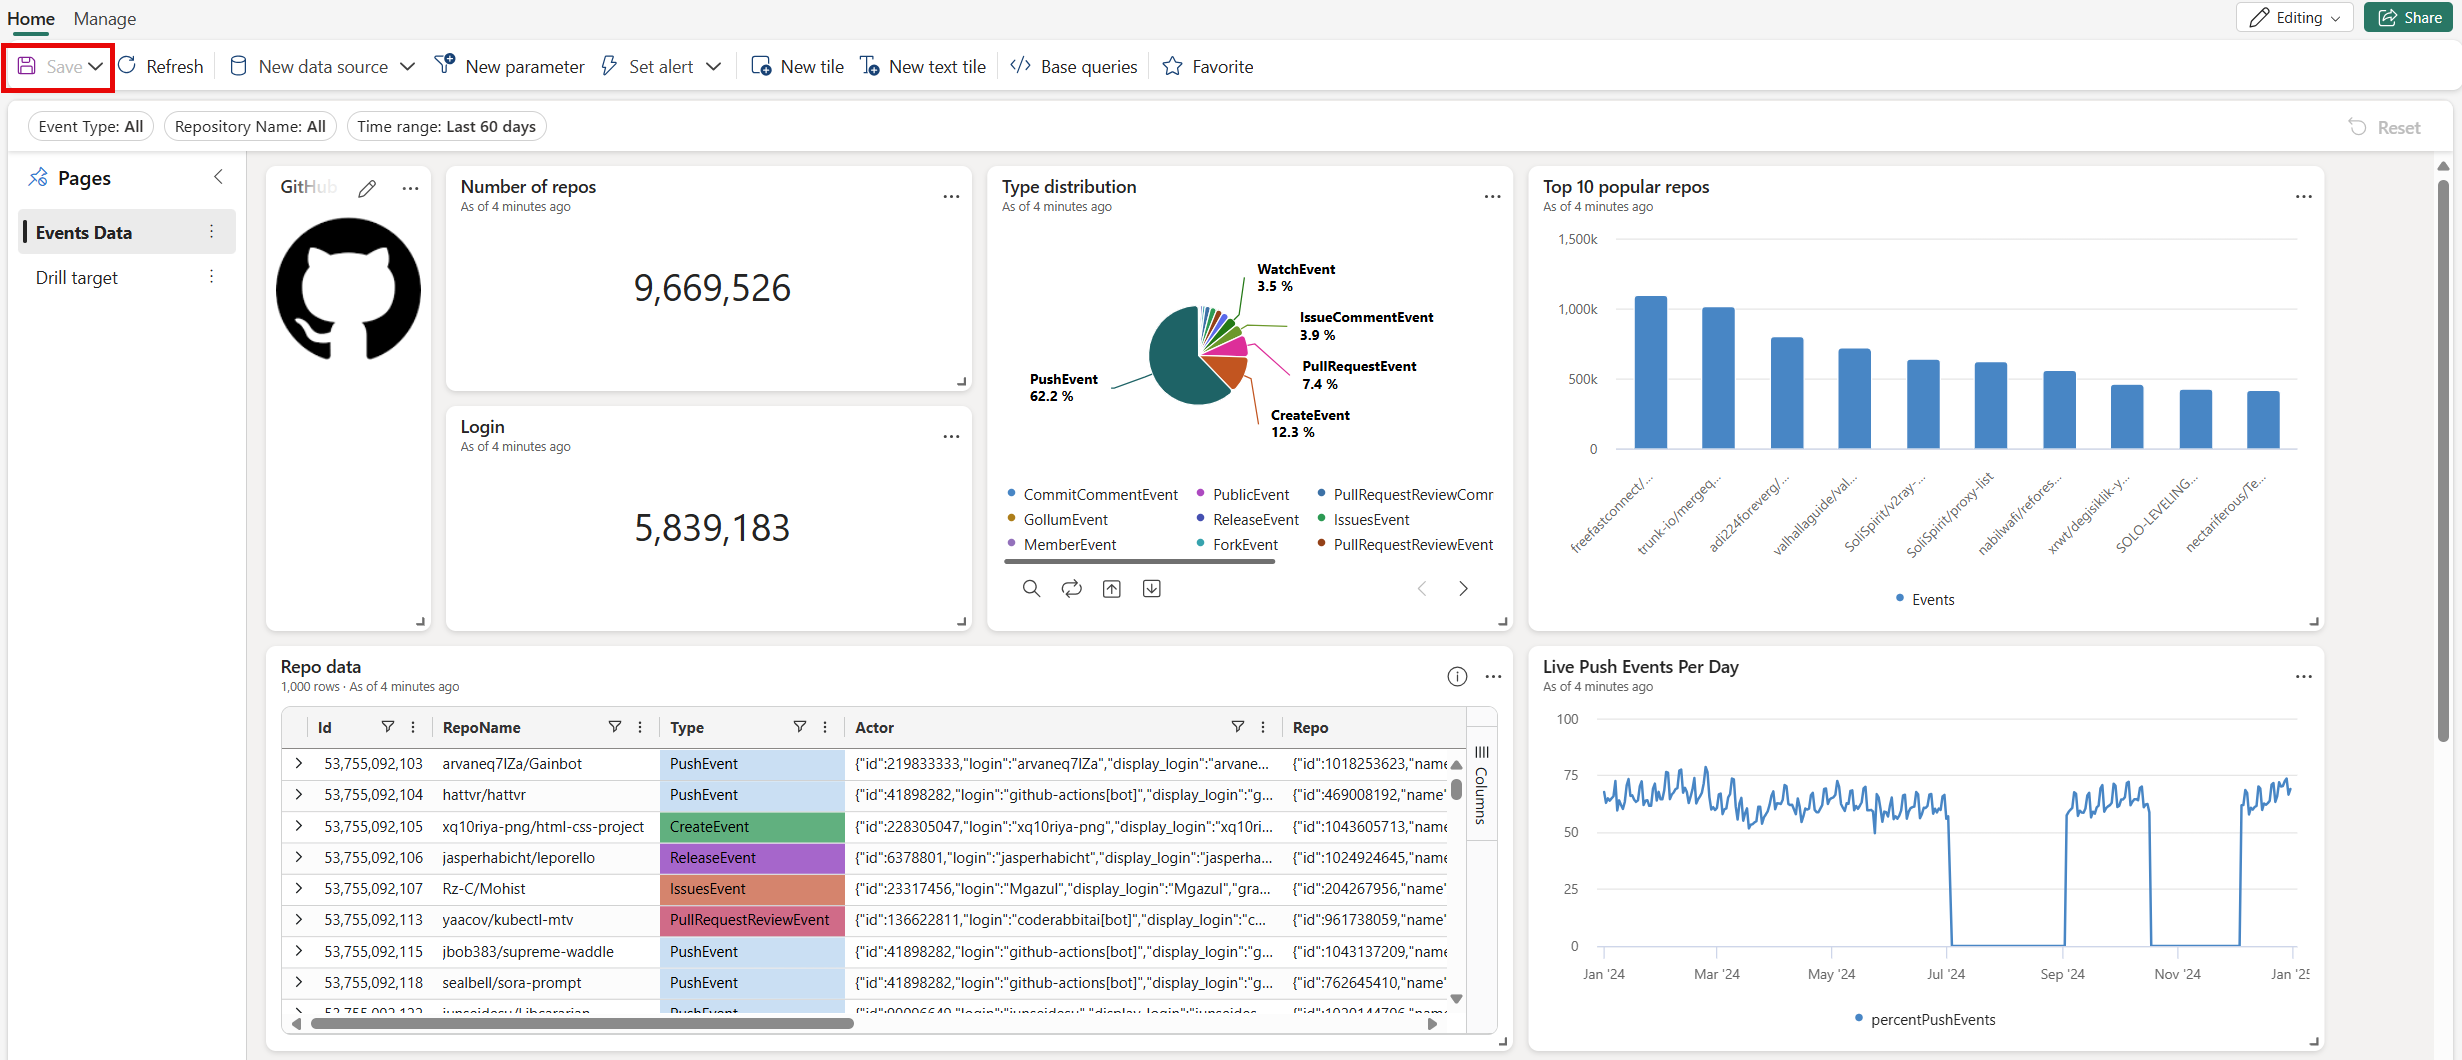
A dashboard is a collection of tiles, optionally organized in pages, where each tile has an underlying query and a visual representation. You can natively export Kusto Query Language (KQL) queries to a dashboard as visuals and later modify their underlying queries and visual formatting as needed. In addition to ease of data exploration, this fully integrated dashboard experience provides improved query and visualization performance.
In this article, you learn how to create a new Real-Time Dashboard, add data sources, and add tiles to the dashboard. You also learn how to enable auto refresh, use parameters, and export dashboards.
Important
Your data is secure. Dashboards and dashboard-related metadata about users are encrypted at rest using Microsoft-managed keys.
Prerequisites
- A workspace with a Microsoft Fabric-enabled capacity
- A KQL database with data
Enable tenant settings in the admin portal
Important
This step must be completed by the tenant admin.
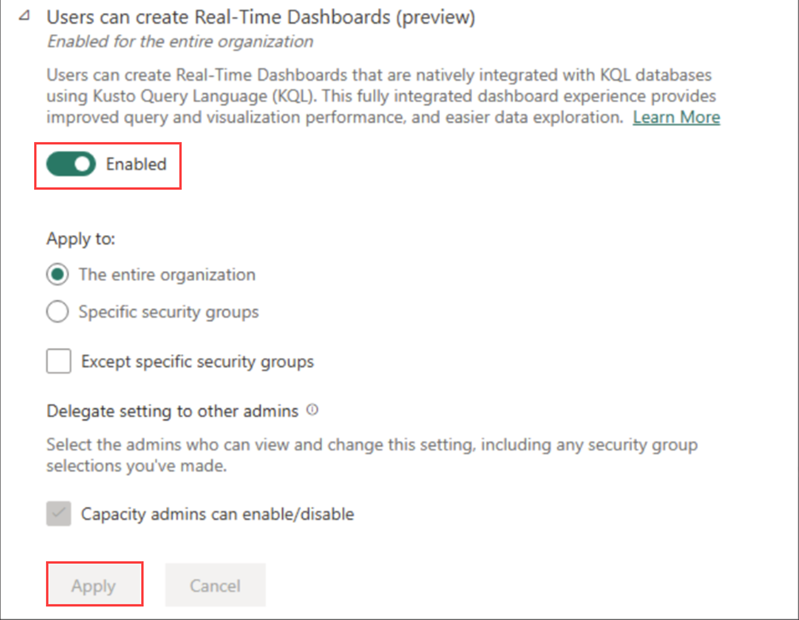
Browse to the admin portal.
In the Tenant settings tab, search for Real-Time Dashboards. For more information, see About tenant settings.
Toggle the button for Create Real-Time Dashboards to Enabled. For more information, see Tenant settings - Microsoft Fabric.
Select Apply.
Create a new dashboard
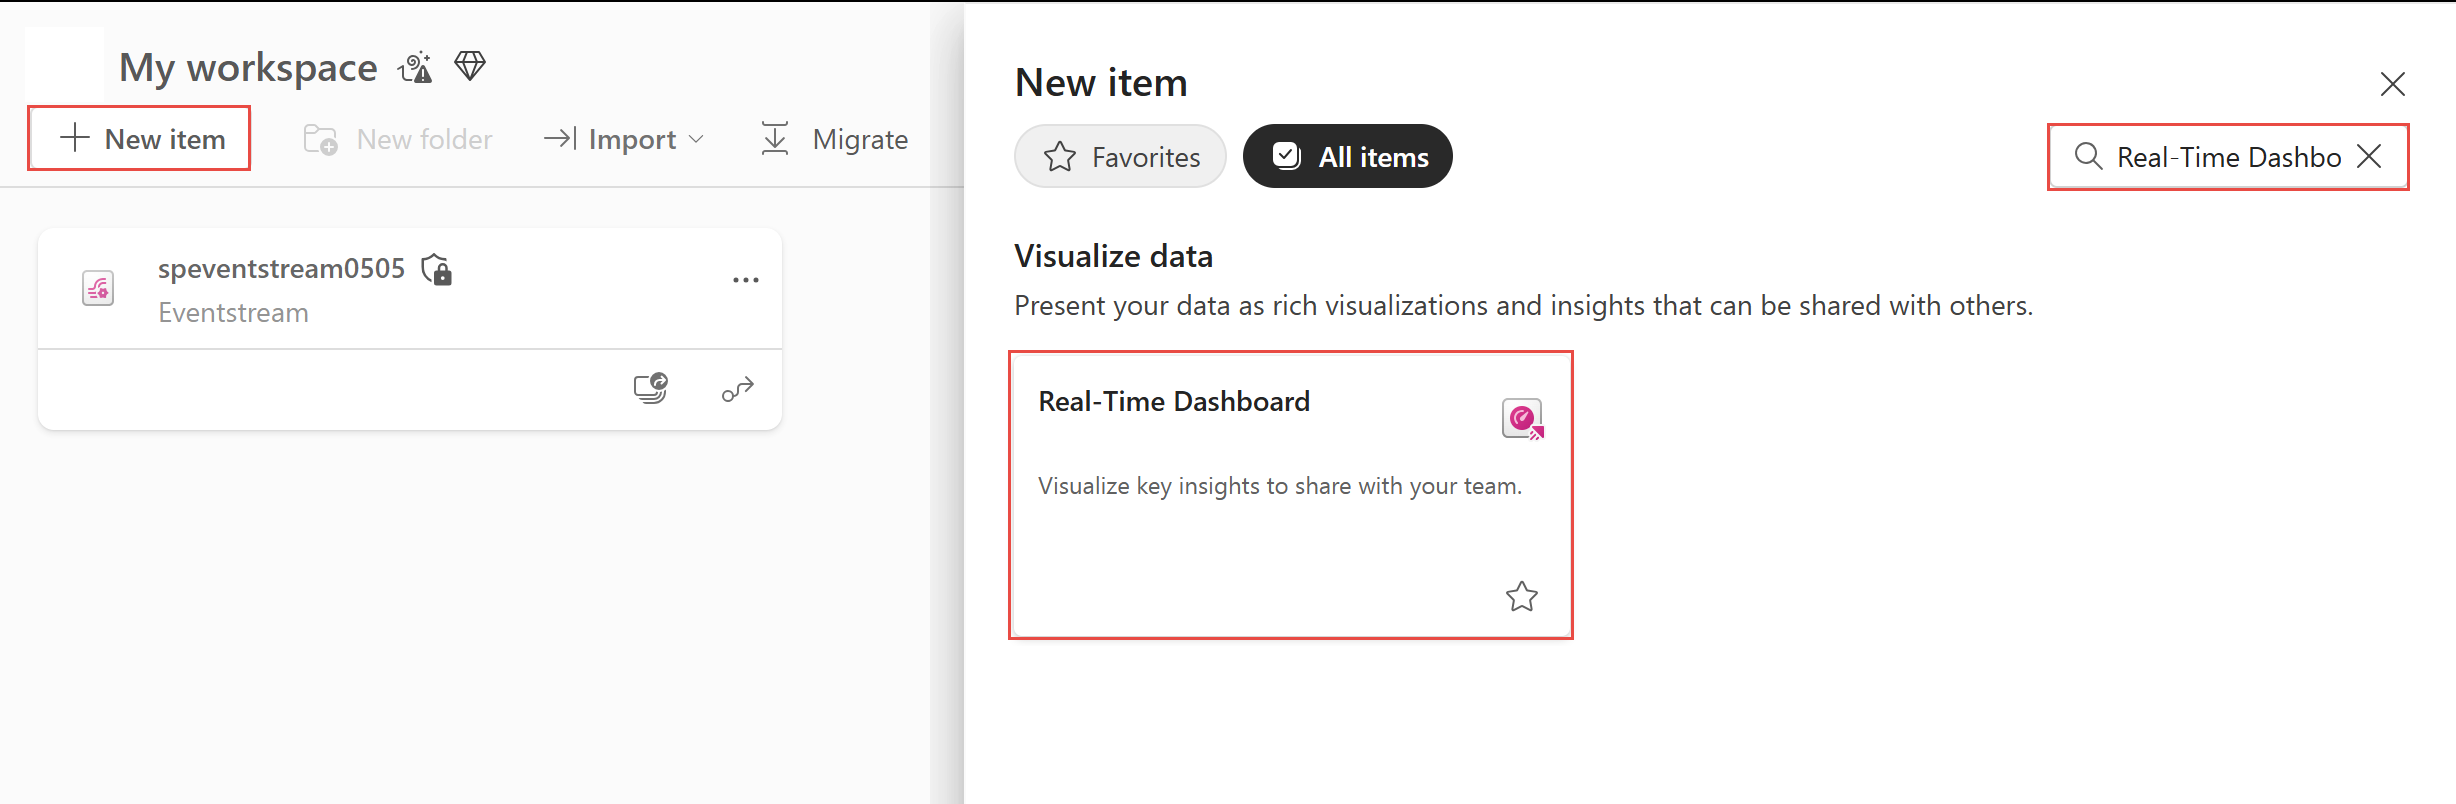
The Real-Time Dashboard exists within the context of a workspace. A new Real-Time dashboard is always associated with the workspace you're using when you create it.
Browse to the desired workspace.
Select + New item.
In the New item window, select Real-Time Dashboard. Search using the text box if needed.
On the New Real-Time Dashboard popup, enter a name for the dashboard, and select Create.
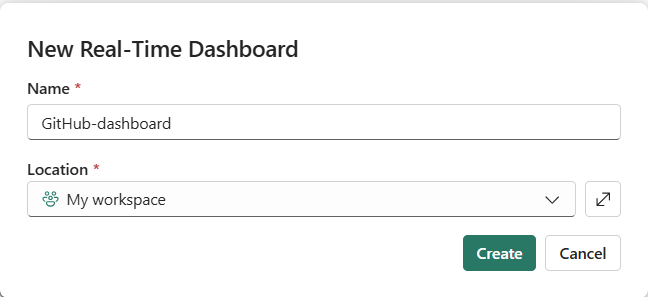
A new dashboard is created in your workspace.


Note
You can also use Copilot to help you write queries. For more information, see Use Copilot in KQL Queryset.
Edit mode
If you aren't able to edit a dashboard, ensure that you are in the Editing mode.

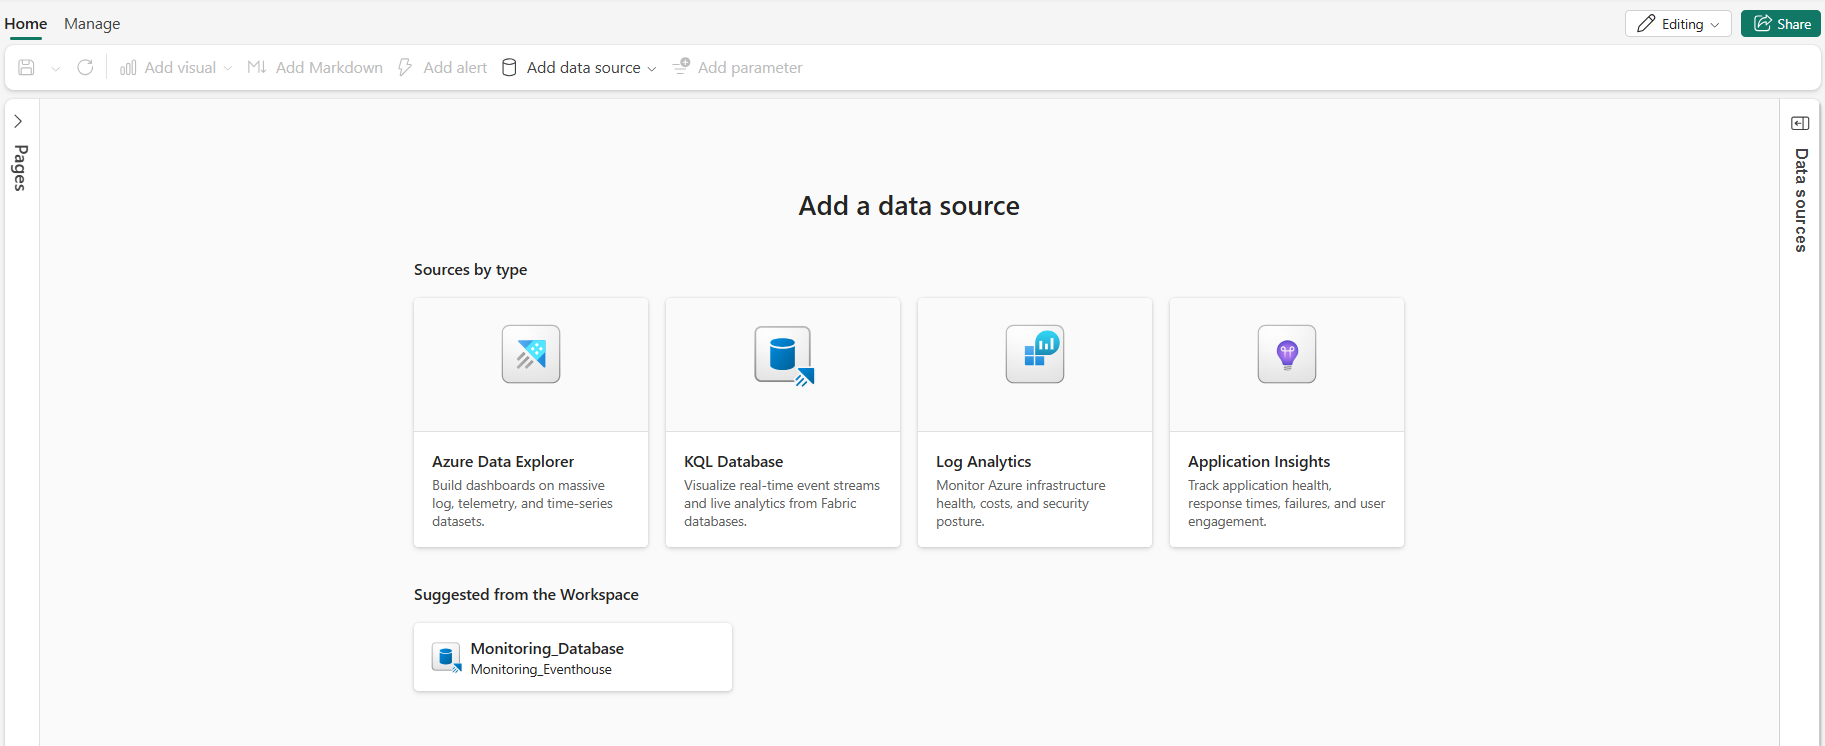
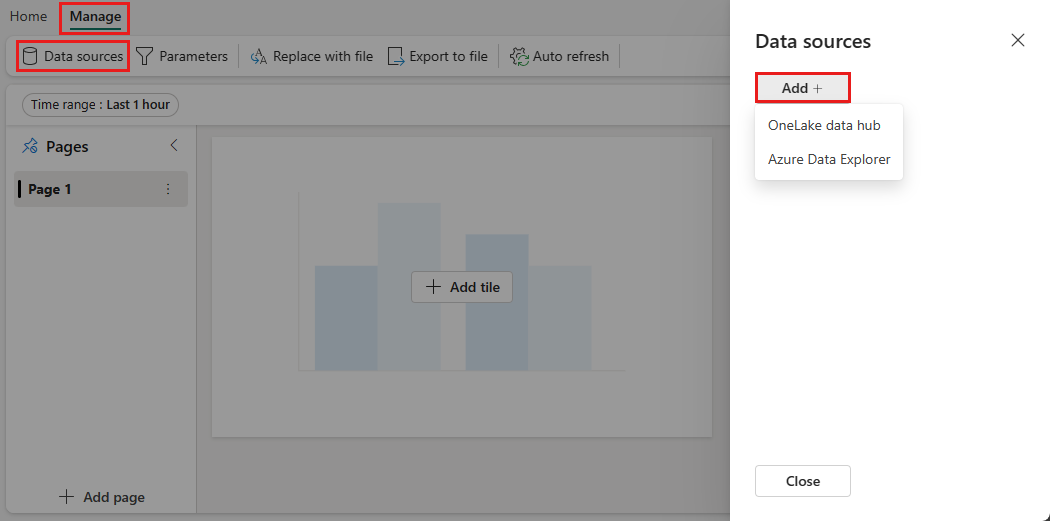
Add data source
Data sources are reusable references to a specific database in the same workspace as the Real-Time Dashboard. Different tiles can be based on different data sources.
Select New data source on the ribbon at the top, and then select Azure Data Explorer.
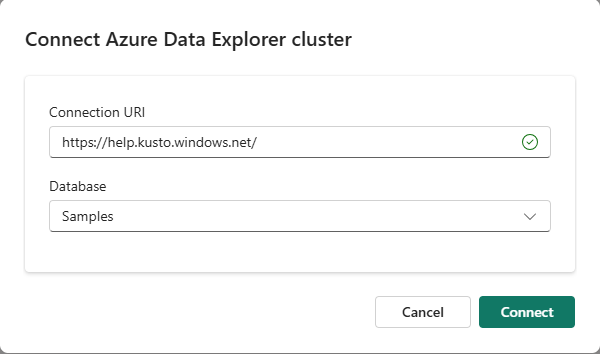
In the Connect Azure Data Explorer cluster window, follow these steps:
Enter the Connection URI for your Azure Data Explorer cluster.
Select a database in the cluster.
Select Create.
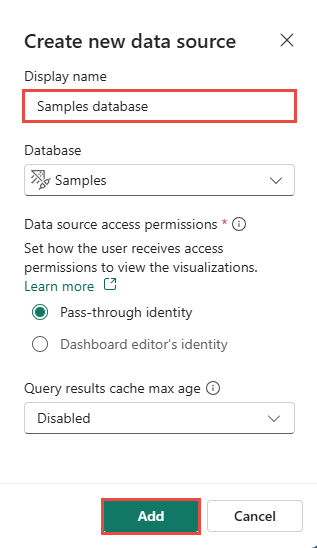
On the Create new data source page, enter a display name for the data source, and select Add.
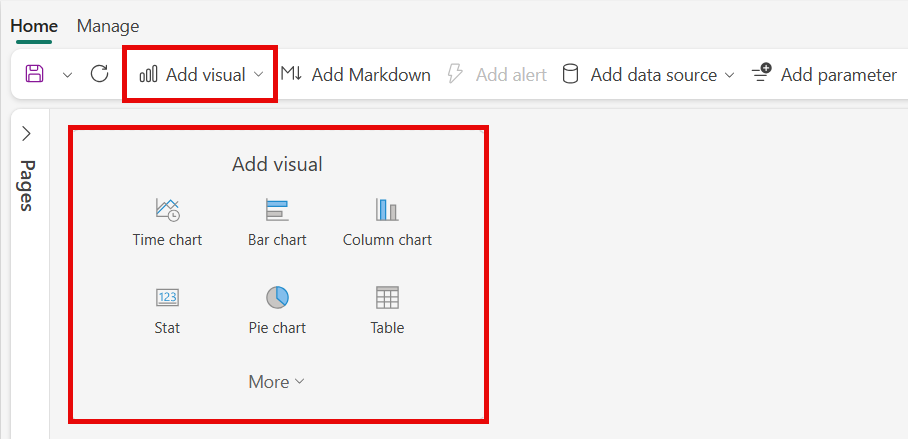
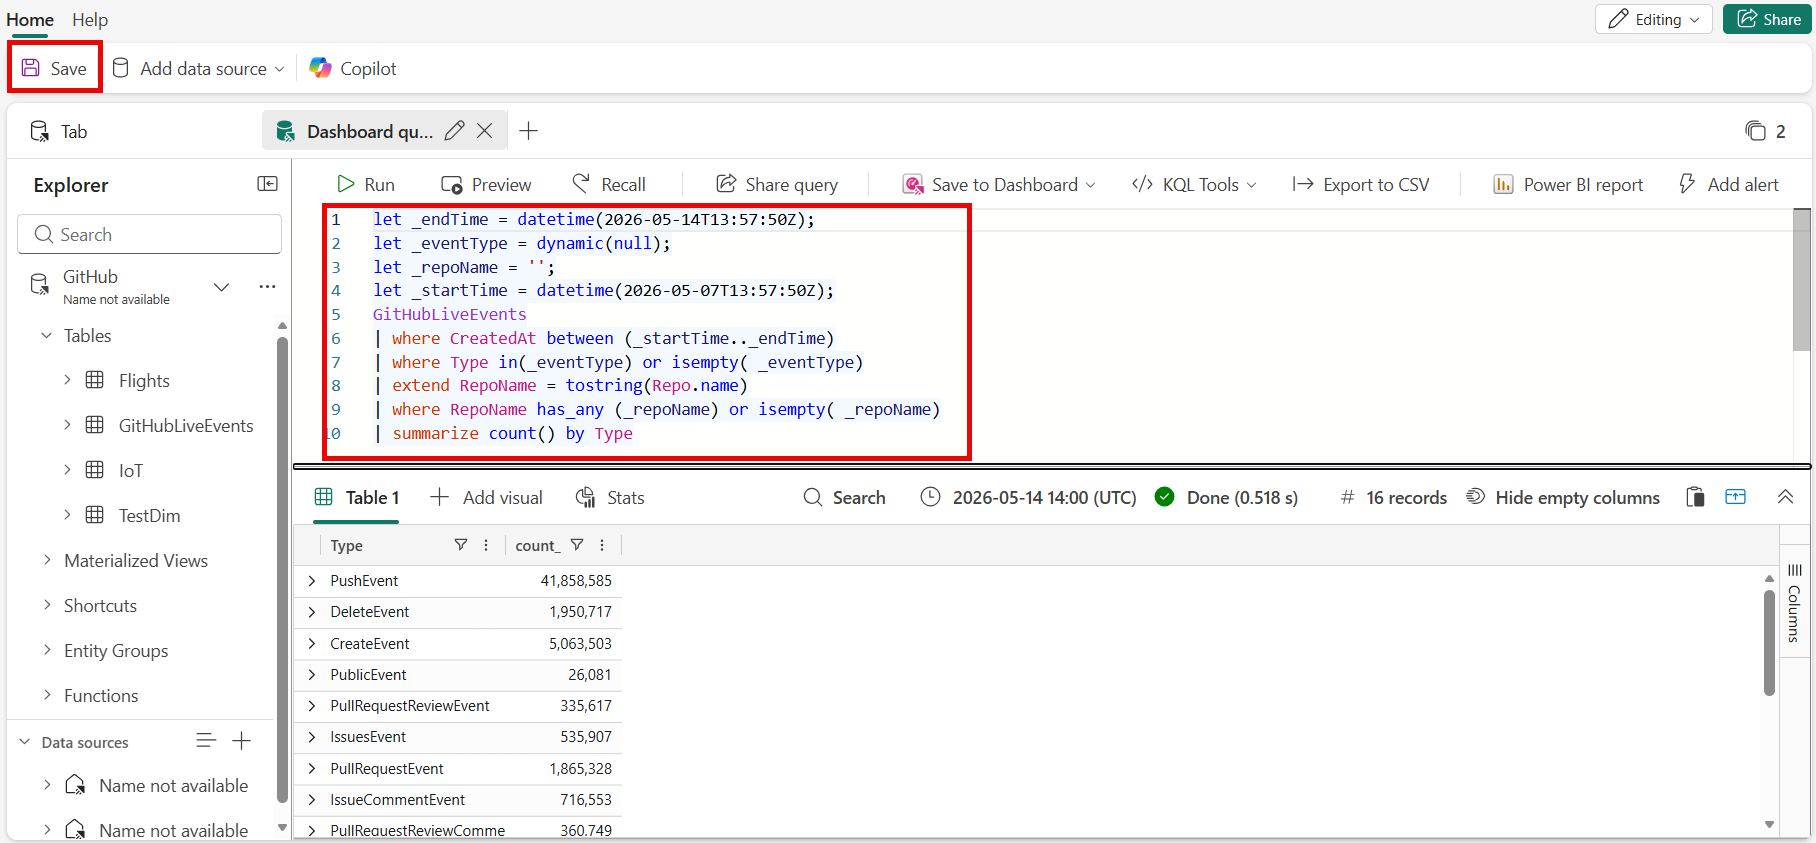
Add tile
Dashboard tiles use Kusto Query Language snippets to retrieve data and render visuals. Each tile/query can support a single visual.
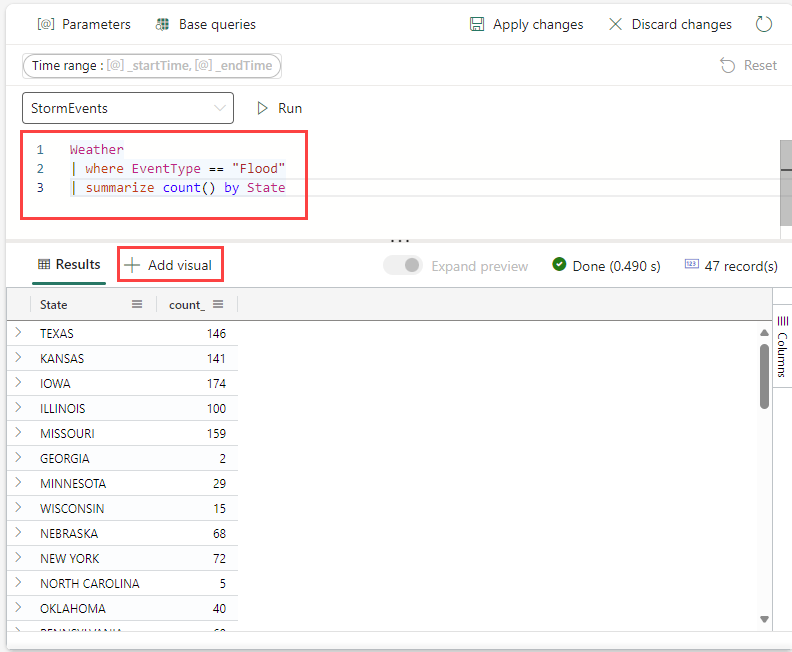
Select Add tile from the dashboard canvas or the top menu bar.
In the Query pane,
- Select the data source from the dropdown menu.
- Type the query, and the select Run. For more information about generating queries that use parameters, see Use parameters in your query.
- Select + Add visual on the ribbon for the Results pane at the bottom.
In the Visual formatting tab, select Visual type to choose the type of visual. For more information on how to customize the visual, see Customize Real-Time Dashboard visuals.
Select Apply changes to pin the visual to the dashboard.
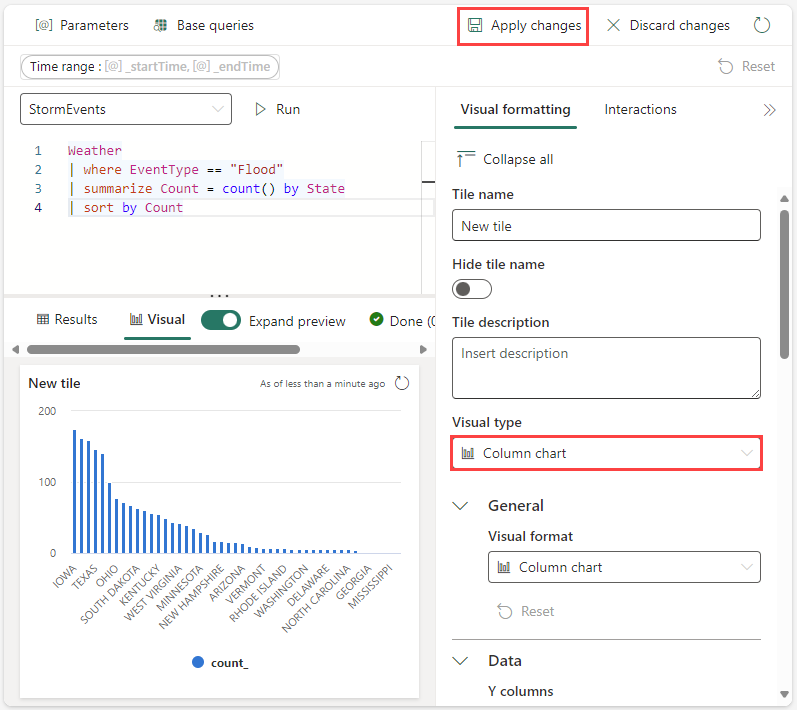
Select the Save icon.

Add tile from a queryset
You can add tiles to your dashboard directly from queries written in a KQL queryset.
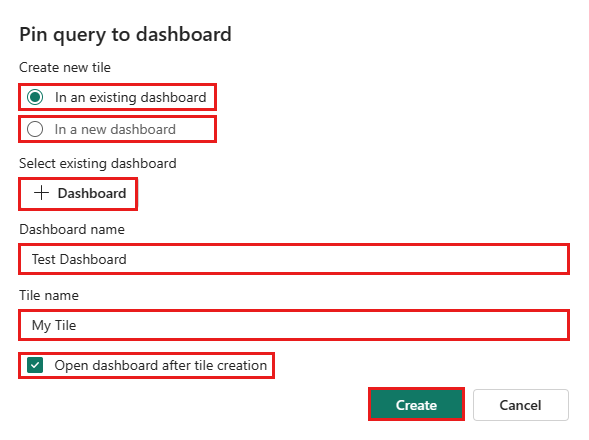
Select Pin to dashboard.
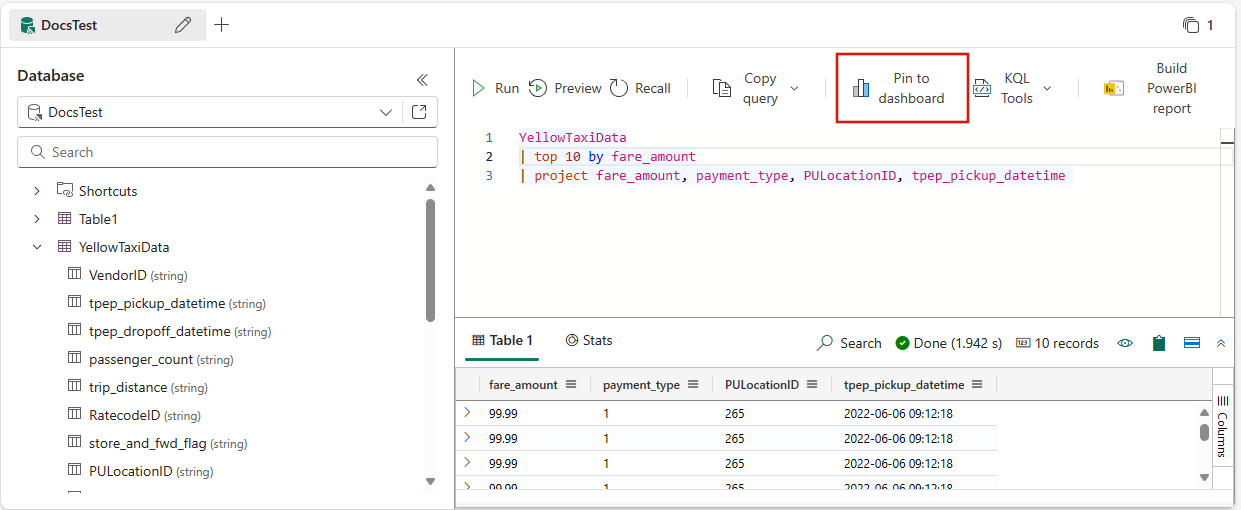
In the Pin query to dashboard window, do the following:
Select an existing dashboard or create a new dashboard.
Name your dashboard tile.
Optionally, select Open dashboard after tile creation to view your dashboard immediately after creation.
Select Create.

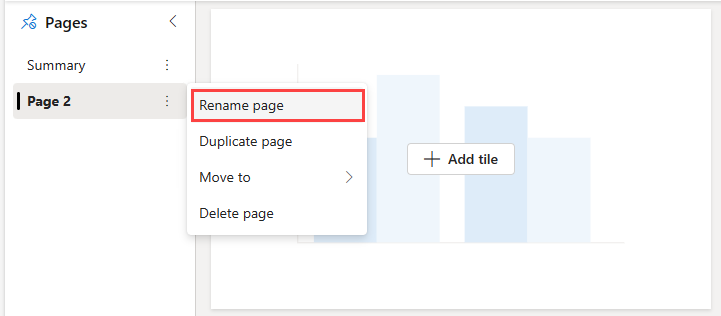
Add page
Pages are optional containers for tiles. You can use pages to organize tiles into logical groups, such as by data source or by subject area. You can also use pages to create a dashboard with multiple views, such as a dashboard with a drillthrough from a summary page to a details page.
Switch to the editing mode by selecting Editing in the top-right corner.
On the Pages pane, select + Add page.
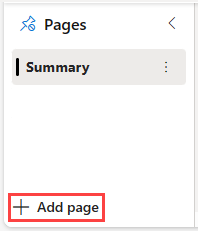
To name the page, select the vertical More menu [...] > Rename page.
Select the new page in the Pages pane, and add tiles to the page.

Use parameters
Parameters significantly improve dashboard rendering performance, and enable you to use filter values as early as possible in the query. Filtering is enabled when the parameter is included in the query associated with your tiles. For more information about how to set up and use different kinds of parameters, see Use parameters in Real-Time Dashboards.
Tile legend
You can change the position of the legend in your tiles and use the legend to interact with the data.
Change the legend location
If you have edit rights on a real-time dashboard, you can change the location of the legend in your tile. Toggle to Edit mode and select the Edit pencil icon. In the Visual formatting pane, under Legend, you can select your location preference.
Interact with your data
You can use the legend to interact with the data in your tile. You can change what data you view by selecting the specific item in the legend. Use Ctrl to add or remove items from the selection, hold shift to select a range. Items not selected are greyed out.
The Search button allows you to search and filter items.
Use the Invert button to invert your selection.
The Up and Down arrows navigate through the list in the following ways:
- When one item is selected, the up and down arrows select the previous or next item.
- When more than one item is selected, the up and down arrows scroll through the list of items, and the data for any selected items you navigate to is highlighted.

View query
You can view the query in either editing or viewing mode. Editing the underlying query of a tile is only possible in editing mode.
On the tile you want to explore, select the More menu [...] > View query. A pane opens with the query and results table.
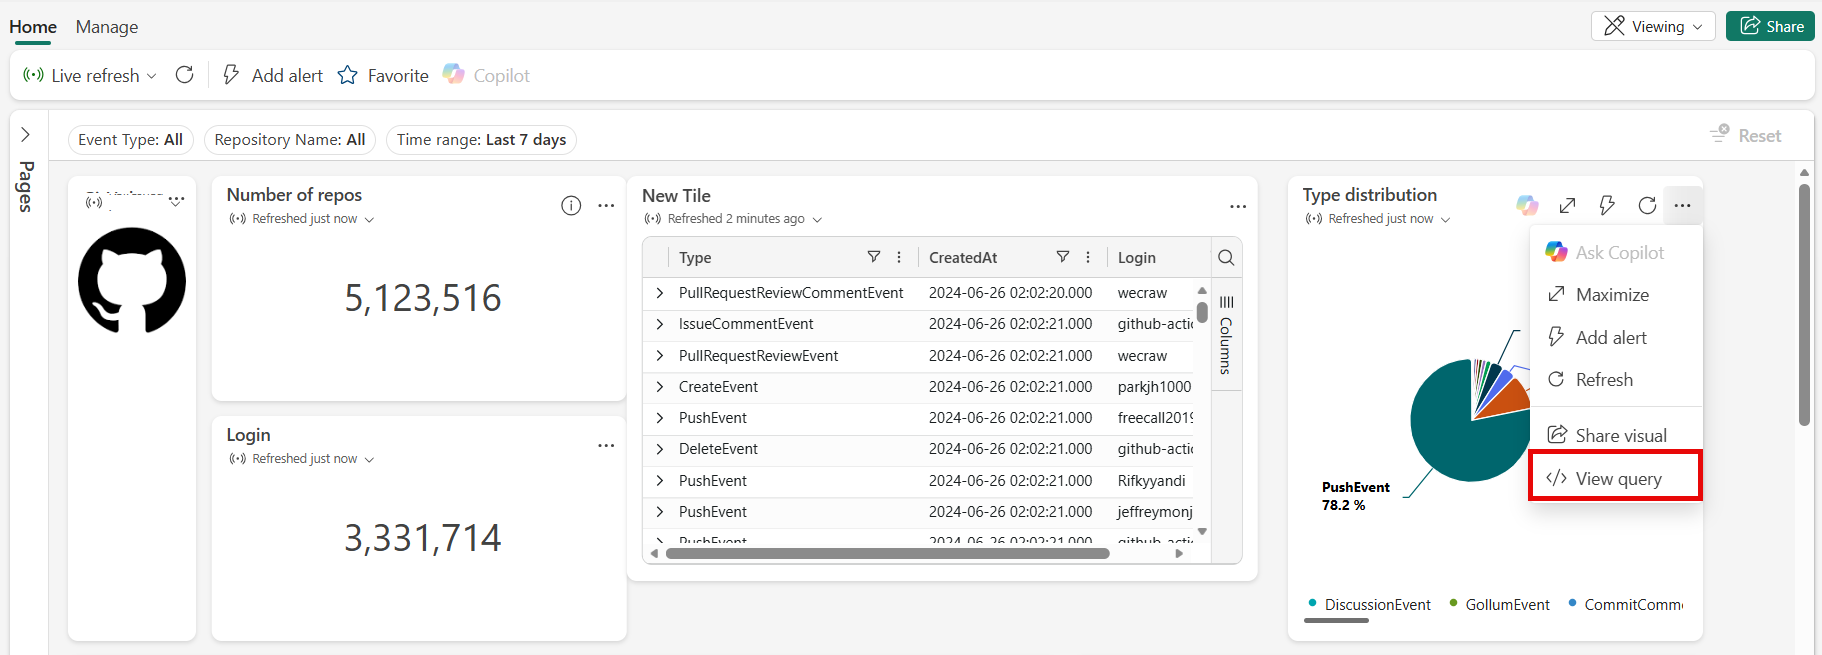
Select Edit query.
Choose either Existing KQL Queryset or New KQL Queryset. Proceed to edit the query in the KQL Queryset.
Note
Any edits made to the query using this flow won't be reflected in the original Real-Time Dashboard.


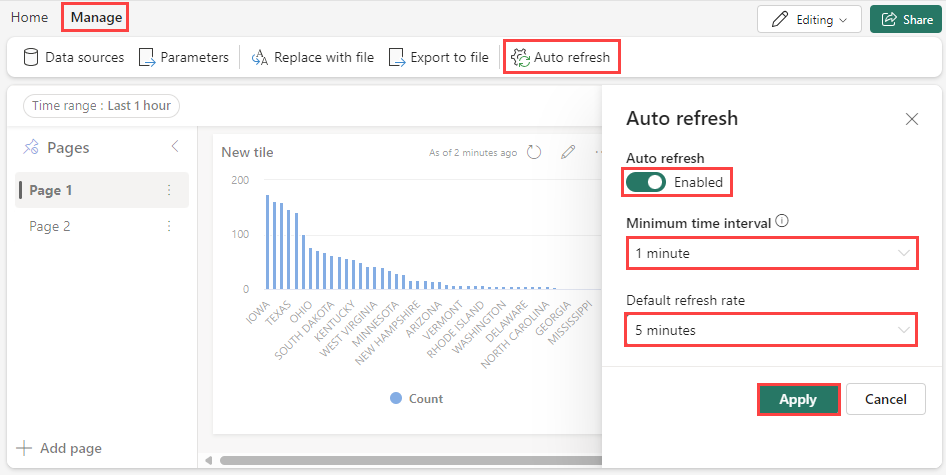
Enable auto refresh
Auto refresh is a feature that allows you to automatically update the data on a dashboard without manually reloading the page or clicking a refresh button.
Dashboard authors can configure autorefresh settings for other viewers. By default, the refresh rate is set using the Default refresh rate, but viewers can adjust this rate for their own sessions.
The Minimum time interval defines the fastest refresh rate allowed and acts as a lower limit. For example, if the author sets the default refresh rate to 1 hour and the minimum time interval to 30 minutes, viewers can choose a refresh rate between 30 minutes and 1 hour, but not lower than 30 minutes.
This setting gives authors control over how frequently dashboards can refresh, helping to manage system load and performance.
Select the Manage tab > Auto refresh.
Toggle the option so auto refresh is Enabled.
Select values for Minimum time interval and Default refresh rate.
Select Apply and then Save the dashboard.
Share the dashboard
To share the dashboard link:
Select Share in the top-right corner of the dashboard.
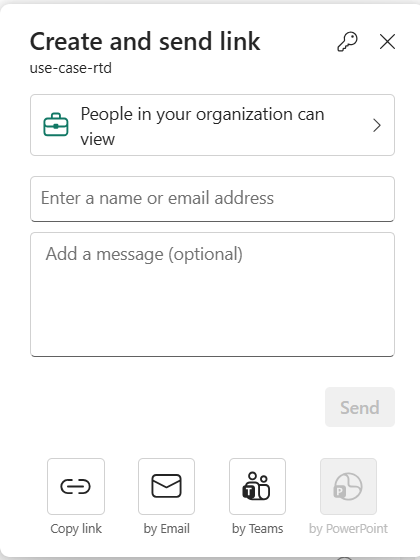
In the Create and send link window, you can do the following steps:
- To see a link to the dashboard and copy it to the clipboard, select Copy link.
- To share a link to the dashboard via email, select by Email.
- To share a link to the dashboard via Teams, select by Teams.

Export dashboards
Use the file menu to export a dashboard to a JSON file. Exporting dashboard can be useful in the following scenarios:
- Version control: You can use the file to restore the dashboard to a previous version.
- Dashboard template: You can use the file as template for creating new dashboards.
- Manual editing: You can edit the file to modify the dashboard. The file can be imported back to the dashboard.
To export a dashboard, in the dashboard, select the Manage tab > |-> Download file.

The file contains the dashboard data in JSON format, an outline of which is shown in the following snippet.
{
    "id": "{GUID}",
    "eTag": "{TAG}",
    "title": "Dashboard title",
    "tiles": [
        {
            "id": "{GUID}",
            "title": "Tile title",
            "query": "{QUERY}",
            "layout": {
                "x": 0,
                "y": 7,
                "width": 6,
                "height": 5
            },
            "pageId": "{GUID}",
            "visualType": "line",
            "dataSourceId": "{GUID}",
            "visualOptions": {
                "xColumn": {
                    "type": "infer"
                },
                "yColumns": {
                    "type": "infer"
                },
                "yAxisMinimumValue": {
                    "type": "infer"
                },
                "yAxisMaximumValue": {
                    "type": "infer"
                },
                "seriesColumns": {
                    "type": "infer"
                },
                "hideLegend": false,
                "xColumnTitle": "",
                "yColumnTitle": "",
                "horizontalLine": "",
                "verticalLine": "",
                "xAxisScale": "linear",
                "yAxisScale": "linear",
                "crossFilterDisabled": false,
                "crossFilter": {
                    "dimensionId": "dragX-timeRange",
                    "parameterId": "{GUID}"
                },
                "multipleYAxes": {
                    "base": {
                        "id": "-1",
                        "columns": [],
                        "label": "",
                        "yAxisMinimumValue": null,
                        "yAxisMaximumValue": null,
                        "yAxisScale": "linear",
                        "horizontalLines": []
                    },
                    "additional": []
                },
                "hideTileTitle": false
            },
            "usedParamVariables": [
                "{PARAM}"
            ]
        }
    ],
    "dataSources": [
        {}
    ],
    "$schema": "https://dataexplorer.azure.com/static/d/schema/20/dashboard.json",
    "autoRefresh": {
        "enabled": true,
        "defaultInterval": "15m",
        "minInterval": "5m"
    },
    "parameters": [
        {}
    ],
    "pages": [
        {
            "name": "Primary",
            "id": "{GUID}"
        }
    ],
    "schema_version": "20"
}
Update or restore an existing dashboard from a file
You can update an existing dashboard, or restore a previous version, as follows:
In the dashboard, select the Manage tab > Replace with file.
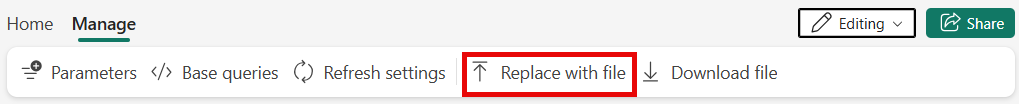
Select the file to update the dashboard.
On the Home tab, select Save.
