Note
Access to this page requires authorization. You can try signing in or changing directories.
Access to this page requires authorization. You can try changing directories.
Eventstream is a streaming platform that allows you to ingest, transform, and route data streams to KQL Database using a no-code editor. In this tutorial, we explore sample bike-sharing data to determine the minute-by-minute count of bikes rented on the streets. You learn to use Eventstream's event processor for real-time data transformations and seamlessly directing the processed data to your KQL Database.
Prerequisites
- Access to a workspace with Contributor or above permissions where your Eventstream and KQL Database are located.
- A KQL Database created in your workspace.
Create an eventstream
Follow these steps to create an eventstream in your workspace:
Navigate to the Fabric portal.
Select My workspace on the left navigation bar.
On the My workspace page, select + New item on the command bar.
On the New item page, search for Eventstream, and then select Eventstream.

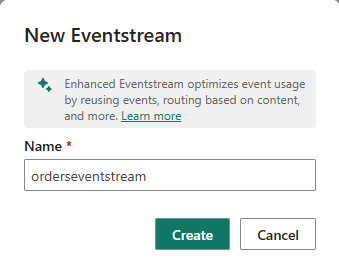
In the New Eventstream window, enter a name for the eventstream, and then select Create.
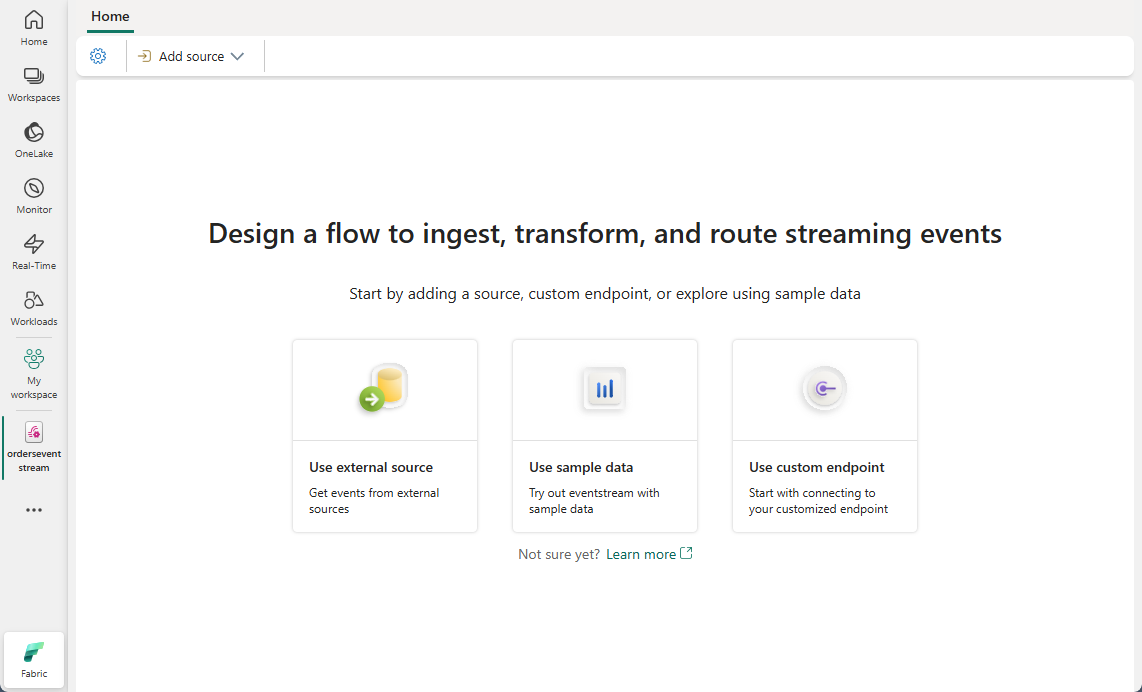
Creation of the new eventstream in your workspace can take a few seconds. After the eventstream is created, you're directed to the main editor where you can start with adding sources to the eventstream.


Add sample bike data
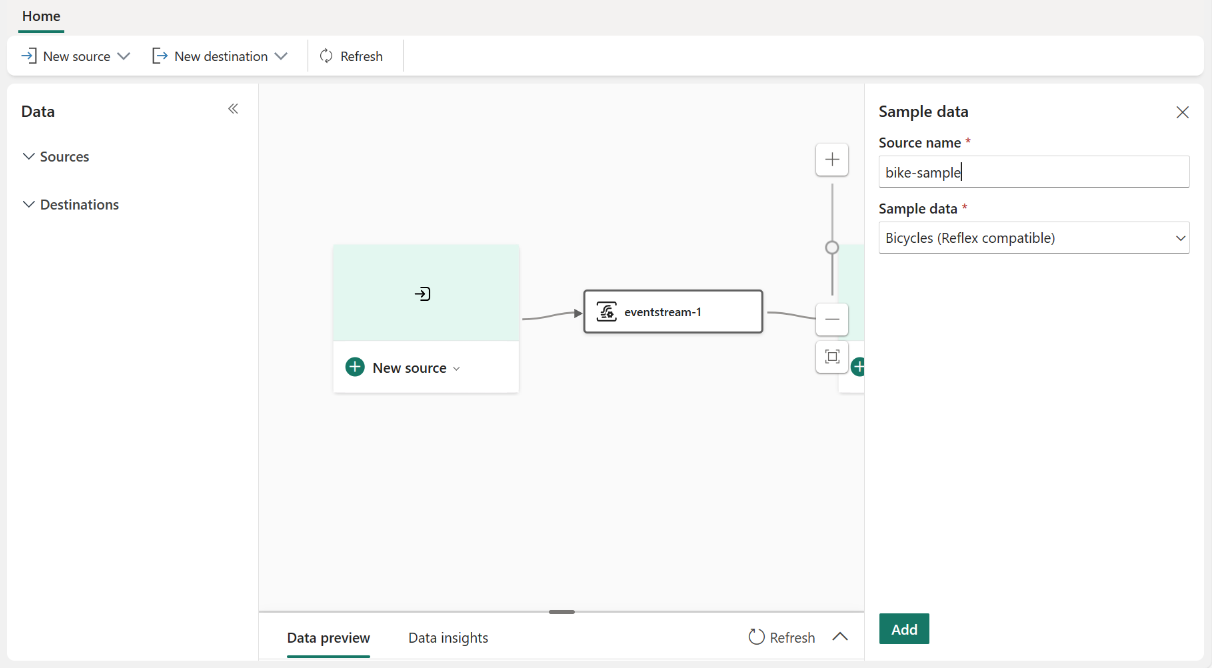
On the Eventstream canvas, expand New source and select Sample data. Give a name to the source and select Bicycles as the sample data.
You can preview the data in eventstream to verify if the sample bike data is added successfully.
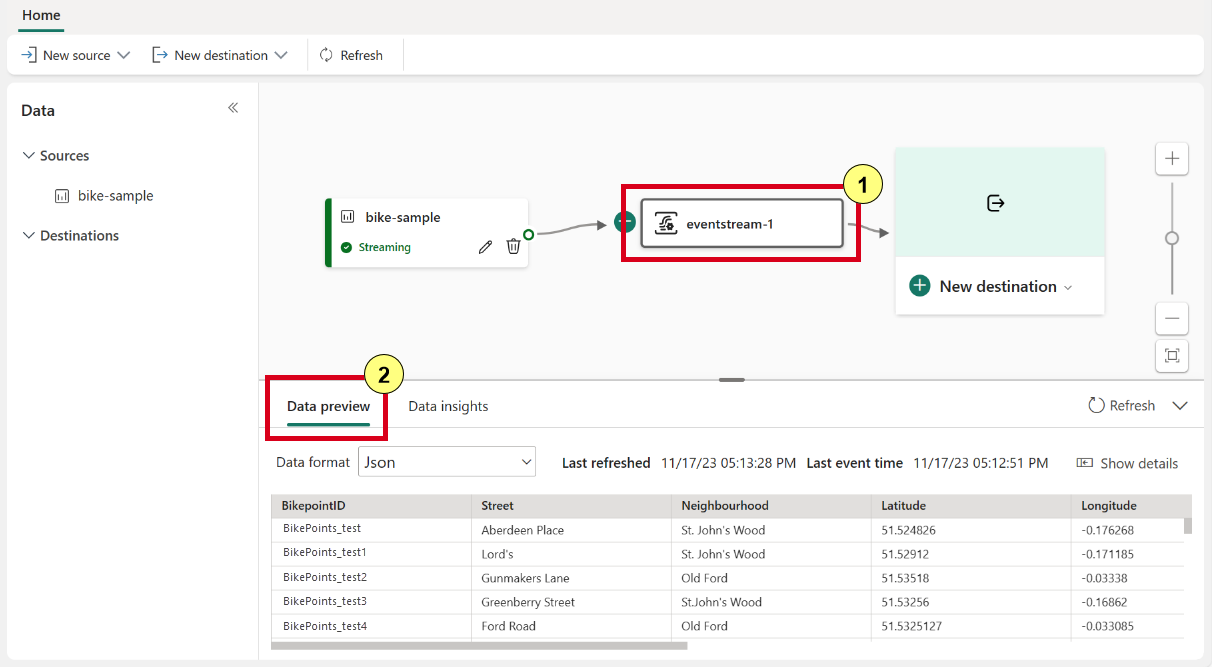
Here's the description of the columns:
Column Description BikepointID ID for the bike docking point Street Name of the street where the dock is located Neighbourhood Neighbourhood where the dock is located Latitude Latitude of the docking point Longitude Longitude of the docking point No_Bikes Number of bikes currently rented No_Empty_Docks Number of available empty docks at the docking point


Add a KQL destination with event processor
On the Eventstream canvas, expand the New destination dropdown menu and choose KQL Database. Enter the necessary details of your KQL Database.
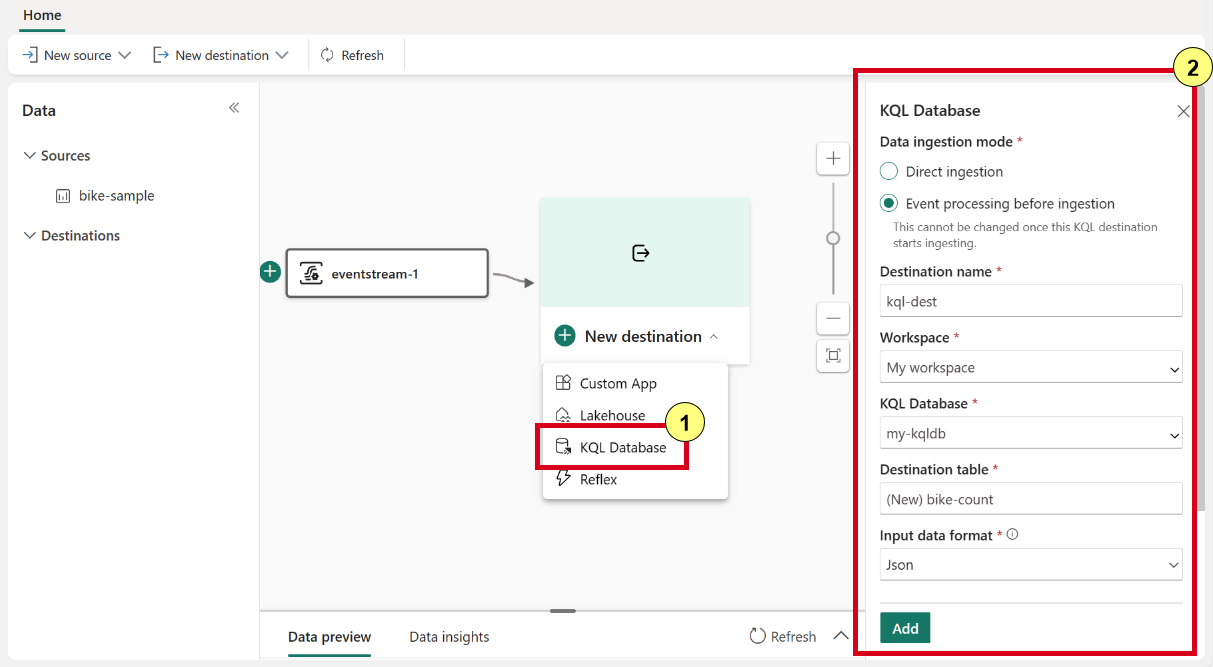
- Data ingestion mode. There are two ways of ingesting data into KQL Database:
- Direct ingestion: Ingest data directly to a KQL table without any transformation.
- Event processing before ingestion: Transform the data with Event Processor before sending to a KQL table.
Note
You CANNOT edit the ingestion mode once the KQL database destination is added to the eventstream.
- Destination name: Enter a name for this Eventstream destination, such as "kql-dest."
- Workspace: Where your KQL database is located.
- KQL database: Name of your KQL Database.
- Destination table: Name of your KQL table. You can also enter a name to create a new table for example "bike-count."
- Input data format: Choose JSON as the data format for your KQL table.
- Data ingestion mode. There are two ways of ingesting data into KQL Database:
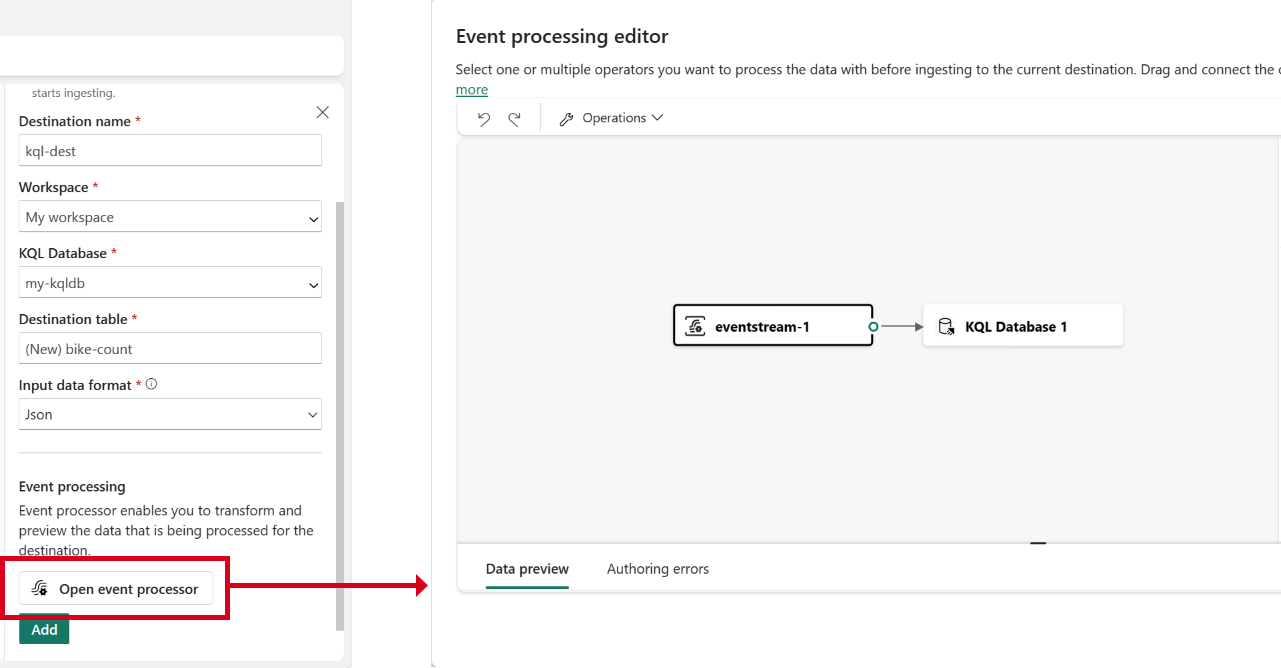
In the right pane, scroll down and select Open event processor. This action opens a new frame allowing you to add real-time operations to your data streams using a no-code editor.
On the Event processing editor, select the line between Eventstream and the KQL Database, and add a Group by operation. Our goal is to calculate the number of bikes rented every minute on the street. Under Aggregation, select SUM for the aggregation and No_Bikes for the field.
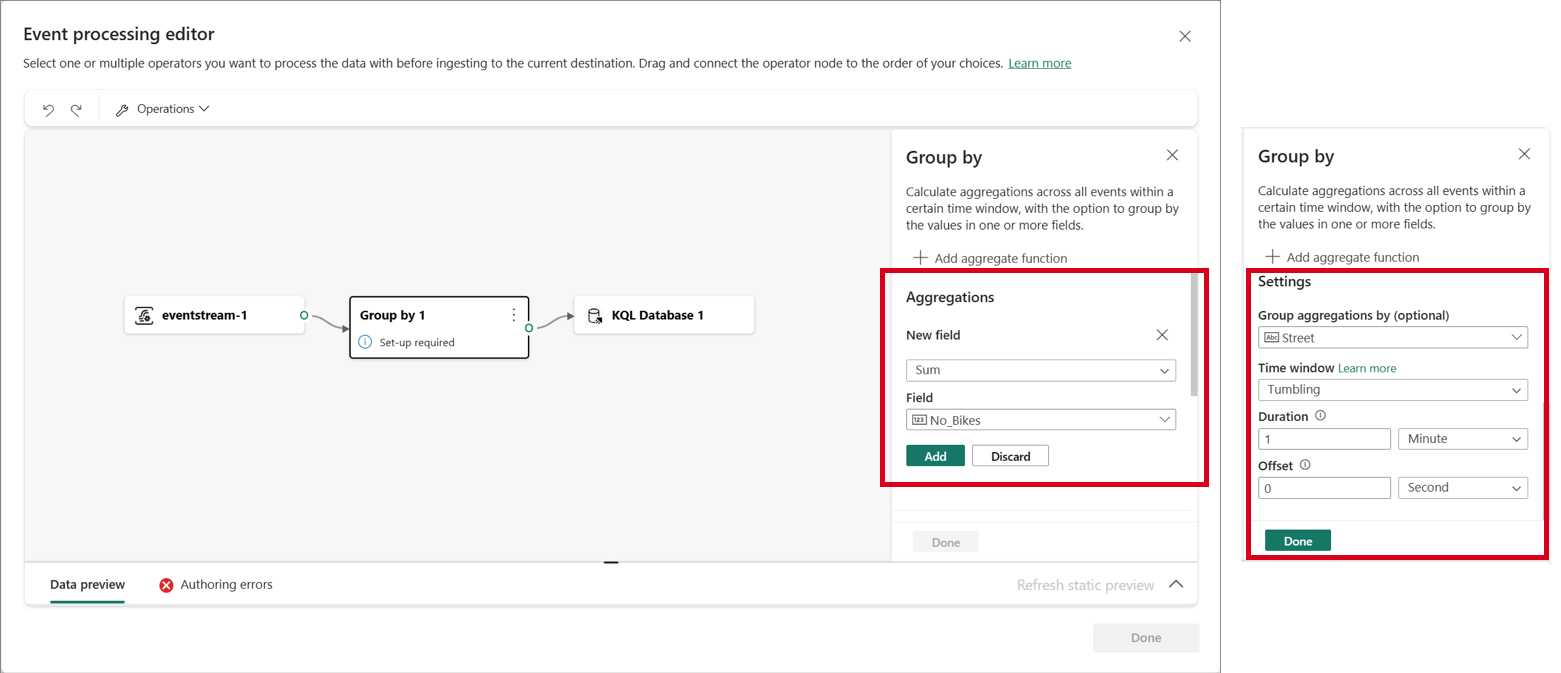
Further down in the Settings section, enter the following information and select Save to complete the Group by configuration.
- Group aggregation by: Street
- Time window: Tumbling
- Duration: 1 Minute
Select the Group by operation on the editor and preview the processing result. Then select Save to close the Event processor.
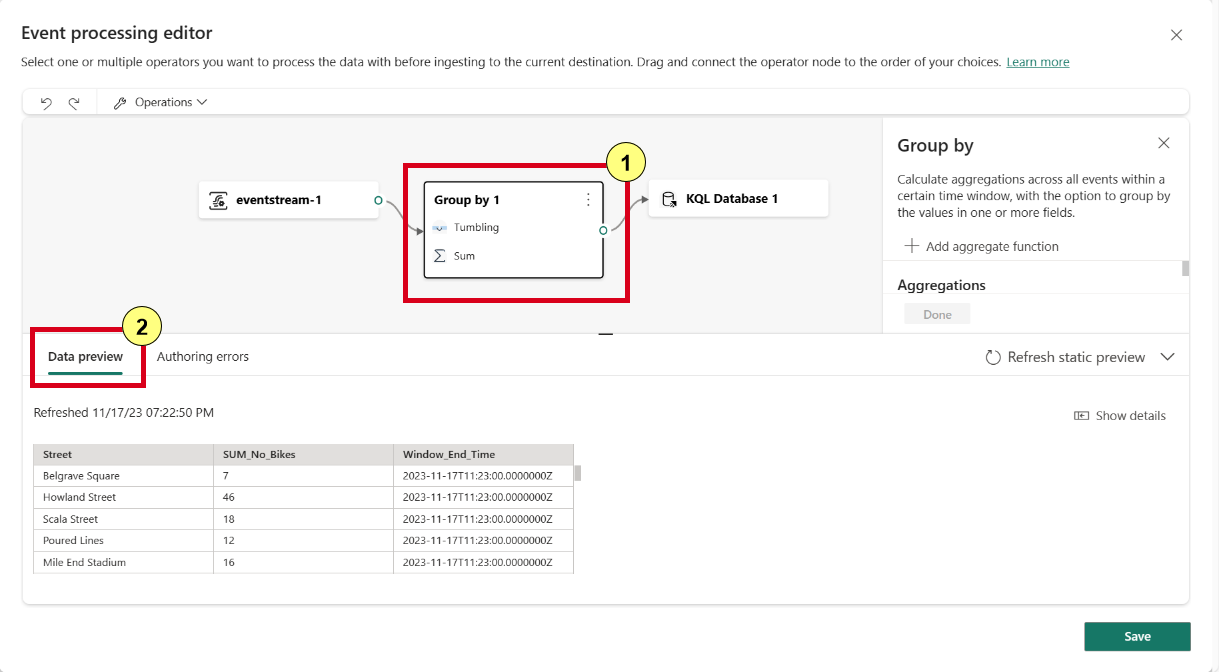
Finally, select Add to finish the configuration for KQL database destination.


View result in the KQL table
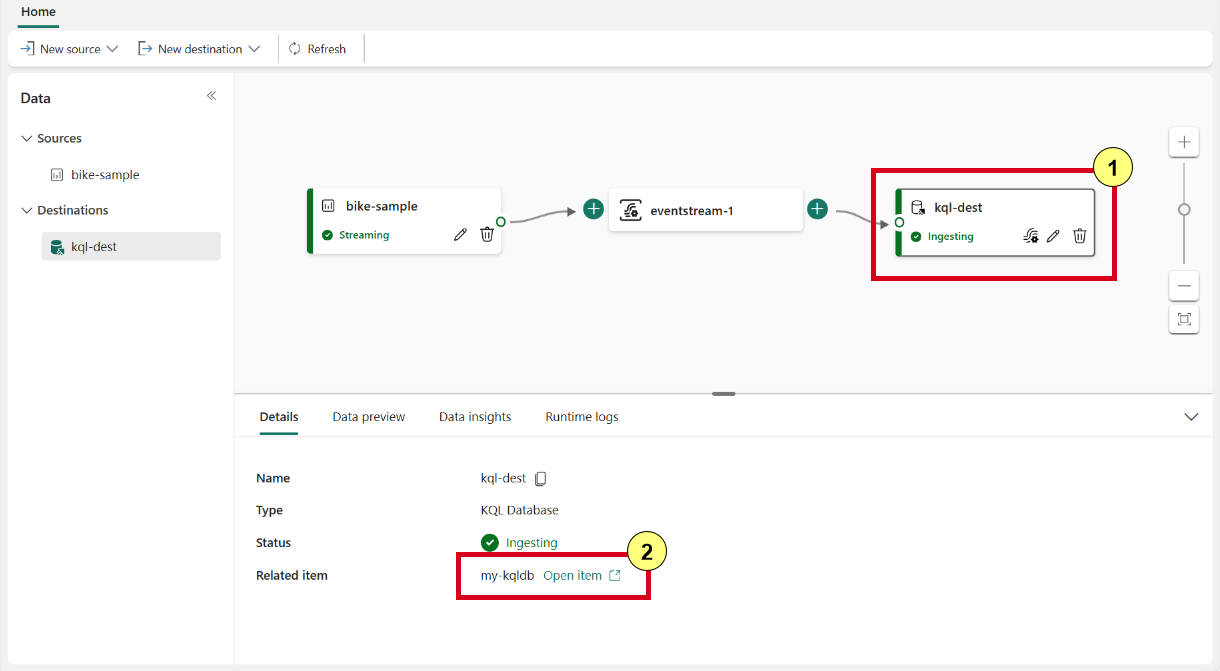
Now the KQL Database destination is added to your Eventstream. Let's ensure that the processing results are appropriately stored in the designated KQL table. Follow these steps:
On the canvas, select the KQL destination, and select Open item to access your KQL Database.
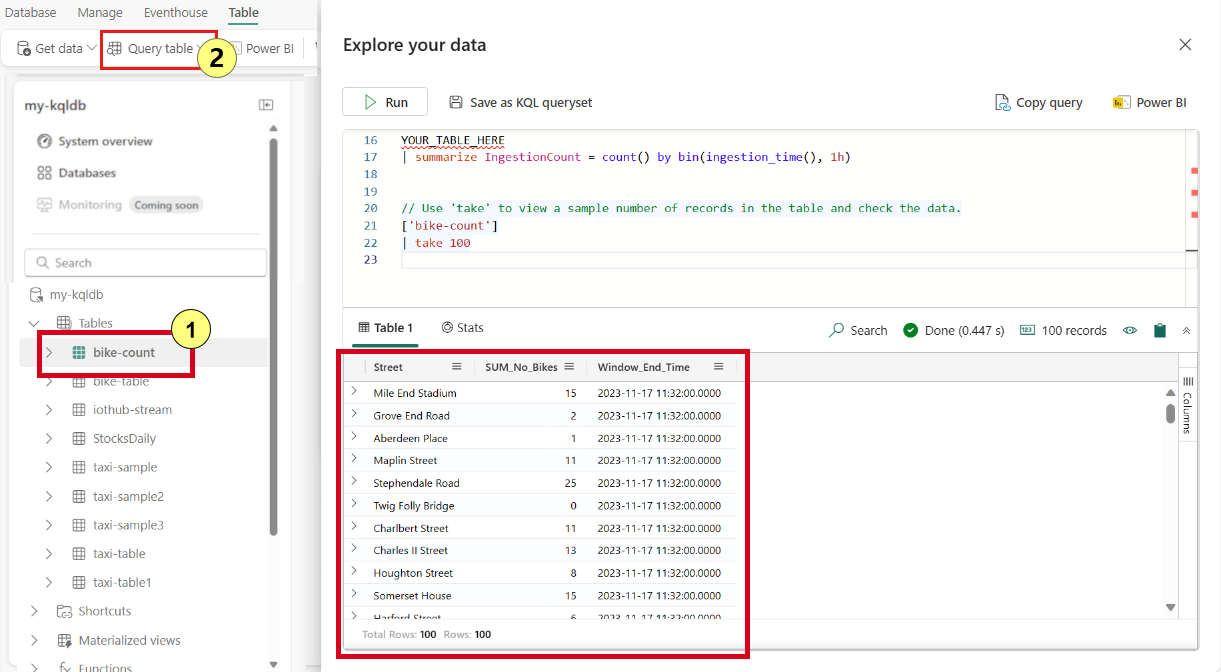
Within the KQL database interface, locate the bike-count table. Select on Query table and choose Show any 100 records. This action opens the right pane, allowing you to examine the last 100 records of the table. Here, you can observe the detailed count of bikes rented on each street, minute-by-minute.


Congratulations!
You successfully completed the tutorial on exploring and transforming bike-sharing data using Eventstream. Keep exploring Eventstream's capabilities and continue your journey with real-time data processing.
Related content
If you want to learn more about ingesting and processing data streams using Eventstream, check out the following resources: