Events
Take the Microsoft Learn AI Skills Challenge
Sep 24, 11 PM - Nov 1, 11 PM
Elevate your skills in Microsoft Fabric and earn a digital badge by November 1.
Register nowThis browser is no longer supported.
Upgrade to Microsoft Edge to take advantage of the latest features, security updates, and technical support.
The Eventhouse page serves as the central hub for all your interactions within the Eventhouse environment. It's your gateway to seamlessly manage and monitor an eventhouse, navigate through databases, and perform various Eventhouse-related actions.
In this article, you learn about how to manage and gain insights about an eventhouse in Real-Time Intelligence.
Browse to your workspace homepage in Real-Time Intelligence.
Select an eventhouse from your list of items in the workspace.

This page is divided into the following sections:
A. Eventhouse ribbon: The ribbon provides quick access to essential actions within the Eventhouse.
B. Explorer pane: The explorer pane provides an intuitive interface for navigating between Eventhouse views and working with databases.
C. Main view area: The main view area displays the system overview details for the eventhouse.
The Eventhouse ribbon is your quick-access action bar, offering a convenient way to perform essential tasks within an Eventhouse. From here, you can refresh your main view and enable minimum consumption.
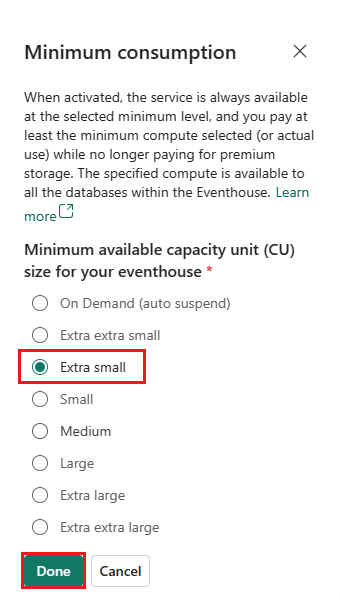
Minimum consumption sets a minimum available capacity unit (CU) size for an eventhouse.
From the ribbon, select Minimum consumption
In the Minimum consumption pane, select the size corresponding to the minimum available CU size you want to apply to this eventhouse, and then select Done.
The following table maps the size to the minimum capacity units allotted to the eventhouse:
| Name | Minimum CUs | SSD capacity (GB) of free storage |
|---|---|---|
| Extra extra small | 4.25 | 20 |
| Extra small | 8.5 | 200 |
| Small | 13 | 800 |
| Medium | 18 | 3500-4000 |
| Large | 26 | 5250-6000 |
| Extra large | 34 | 7000-8000 |
| Extra extra large | 50 | 10500-12000 |
The Eventhouse explorer provides an intuitive interface for navigating between Eventhouse views and for working with databases.
The system overview page provides a snapshot of the current state of the eventhouse.
From the Eventhouse explorer, select System overview.

The system overview page displays the following information:
Running state of the eventhouse: Shows the operational status of the eventhouse. Possible states are:
Storage: OneLake Cache storage shows the amount of retained data and OneLake Standard storage shows any more data that's not in the cache.
Storage usage by database: Shows the storage breakdown by database. You can adjust a databases storage usage by configuring its caching policy.
Activity in minutes: Shows the duration, in minutes, to run compute operations such as queries and commands. It's important to note that compute minutes don't directly correspond to compute units, which represent the actual processing time consumed by these operations.
For example, if two users execute queries at the same time, one taking 3 minutes and the other 5 minutes, the total compute minutes would be 8. But since these queries ran together, the actual compute units used are just 5 minutes.
Likewise, even if 78 queries and 173 ingest operations run at the same time and total 183 compute minutes, if they all finish within a 5-minute period, the actual compute units used is still only 5 minutes.
Most queried databases: Highlights the most active databases in the eventhouse. The information can assist you in obtaining a comprehensive overview of the efficiency with which databases are utilizing compute units.
Eventhouse details: Displays the eventhouse name, creation date, and last updated date. You can copy the following eventhouse URI values:
| URI type | Usage |
|---|---|
| Query URI | URI that can be used to add database shortcuts or by connectors and APIs to run queries or management commands. |
| Ingestion URI | URI that can be used by connectors and APIs to ingest data. |
Activity in minutes - Top 5 users: Shows the total compute minutes used users. The information can help you understand the efficiency with which users are utilizing compute units.
What's new: Highlights recent eventhouse events, such as the following operations:
Optionally, select one of the tabs at the top of a card to filter its date by time range. These tabs allow you to filter by one hour (1 h), one day (1 d), one week (7 d), one month (30 d).
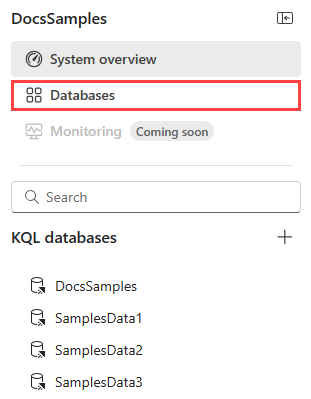
The databases page provides a summary of all the databases in the eventhouse.
From the Eventhouse explorer, select Databases.
 '
'
A window opens with details about all the databases in this eventhouse.
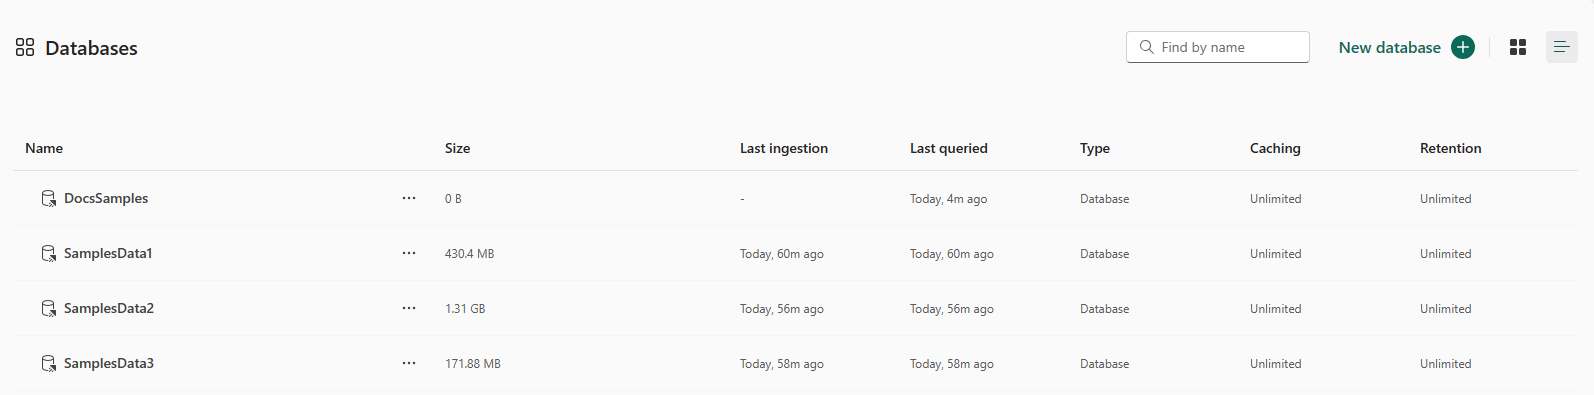
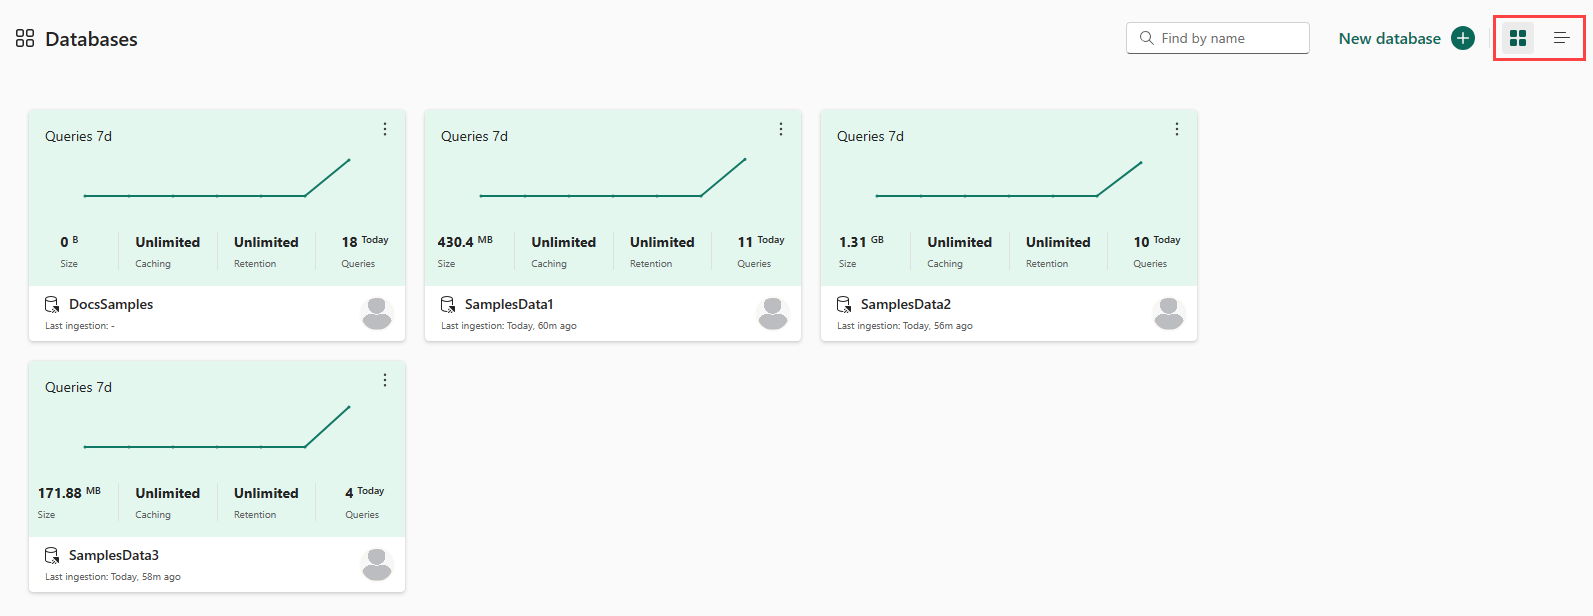
Toggle between list and tile view using the buttons on the top right of the page.
To explore a specific database, select the name of this database from the list.
In the Eventhouse explorer, under KQL Databases, you can manage all the databases in the eventhouse.
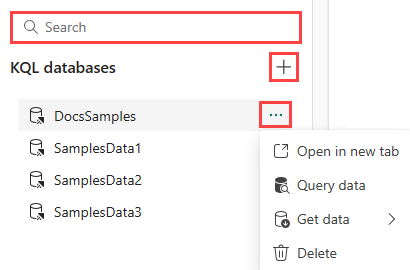
You can perform the following actions:
To create either a KQL database or a database shortcut:
Select New database +.
Enter a database name, and select Create.
To filter the list of databases, use the search box.
To open an existing database, select the database from the list.
To query tables in a database, hover over the desired database > select More menu [...] > Query data. The Explore your data pane opens where you can write and run queries on the selected database. To learn more about KQL, see Kusto Query Language overview.
To ingest data into a database, hover over the desired database > select More menu [...] > Get data > select the desired ingest method. To learn more, see data formats and the corresponding ingestion methods.
To delete a database, hover over the desired database > select More menu [...] > Delete > Delete database.
Events
Take the Microsoft Learn AI Skills Challenge
Sep 24, 11 PM - Nov 1, 11 PM
Elevate your skills in Microsoft Fabric and earn a digital badge by November 1.
Register nowTraining
Module
Get started with Real-Time Intelligence in Microsoft Fabric - Training
Analysis of real-time data streams is a critical capability for any modern data analytics solution. You can use the Real-Time Intelligence capabilities of Microsoft Fabric to ingest, query, and process streams of data.
Certification
Microsoft Certified: Azure Database Administrator Associate - Certifications
Administer an SQL Server database infrastructure for cloud, on-premises and hybrid relational databases using the Microsoft PaaS relational database offerings.