Note
Access to this page requires authorization. You can try signing in or changing directories.
Access to this page requires authorization. You can try changing directories.
Pin an existing Fabric map to a new or existing real-time dashboard to display spatial context alongside real-time metrics. The dashboard adds a Fabric Maps visual that references the source map item and renders its saved data sources, queries, layers, and styling.
Important
This feature is in preview.
The dashboard doesn't copy the map configuration. Continue to manage the data sources, queries, layers, filters, and styling in the source map item. To display saved map configuration changes in an open dashboard, reload the dashboard page.
Note
Real-time dashboard parameters don't filter or otherwise modify a Fabric map.
For information about other ways to share and reuse a map, see Sharing Microsoft Fabric Maps.
Prerequisites
Before you begin, ensure you have:
- An existing Fabric map.
- Permission to edit the source map item.
- Edit permission for the target workspace and dashboard when pinning to an existing dashboard.
- Permission to create items in the target workspace when creating a dashboard.
The destination dashboard can be in a different workspace from the source map.
Pin to a new Real-Time Dashboard
- Open the Fabric map and select the layer you want.
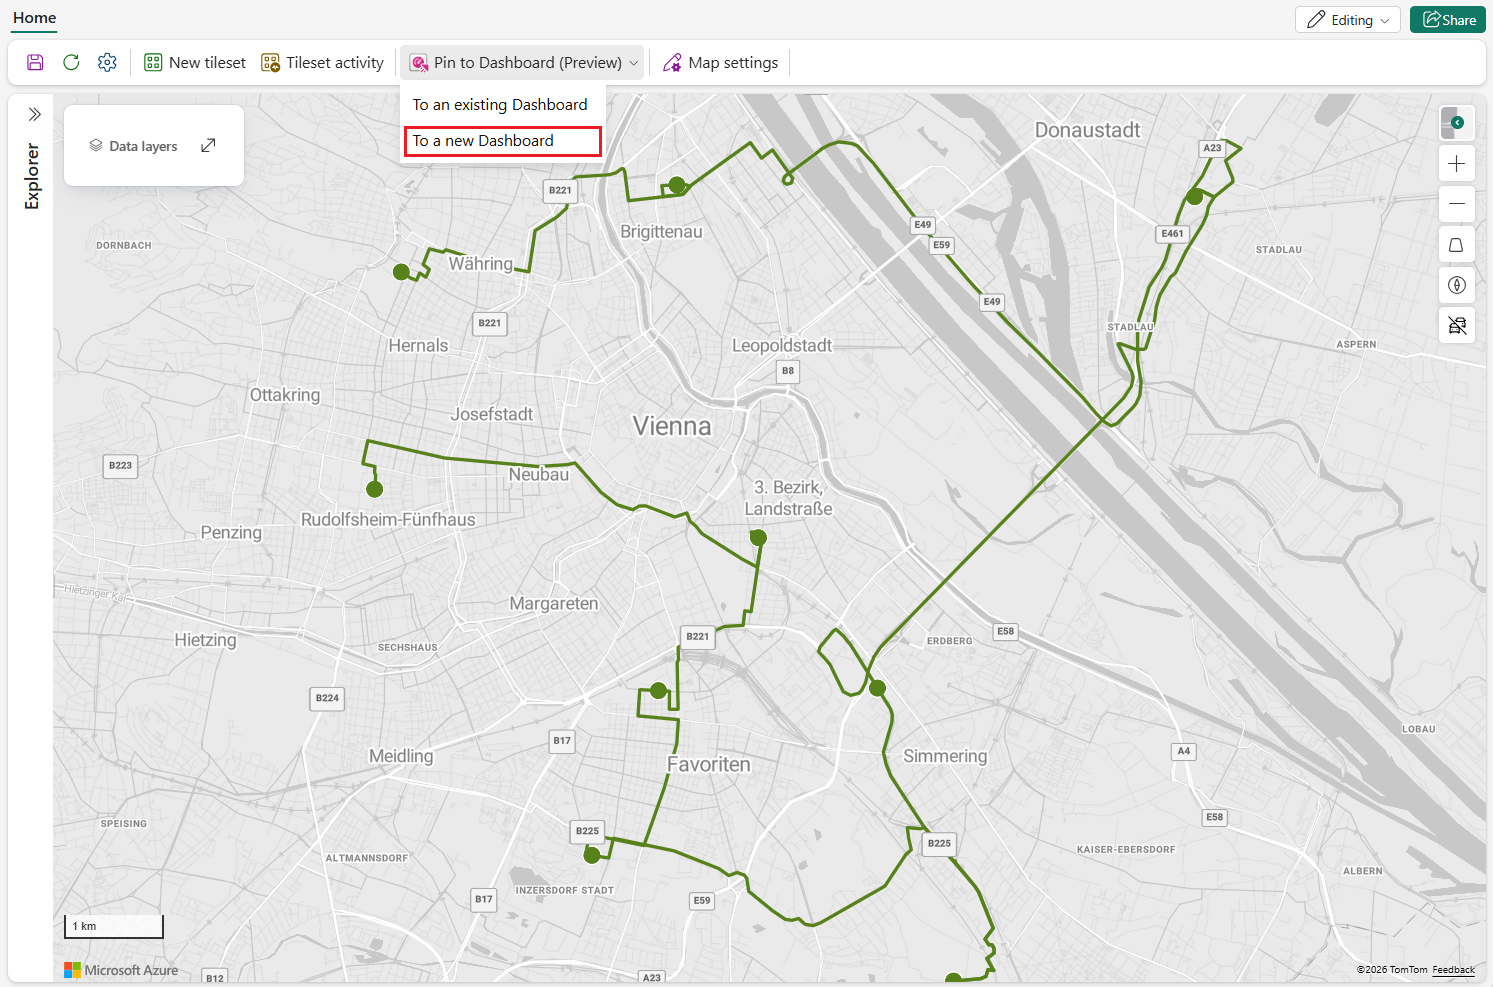
- Select Pin to dashboard (preview).
- Select To a new Dashboard.
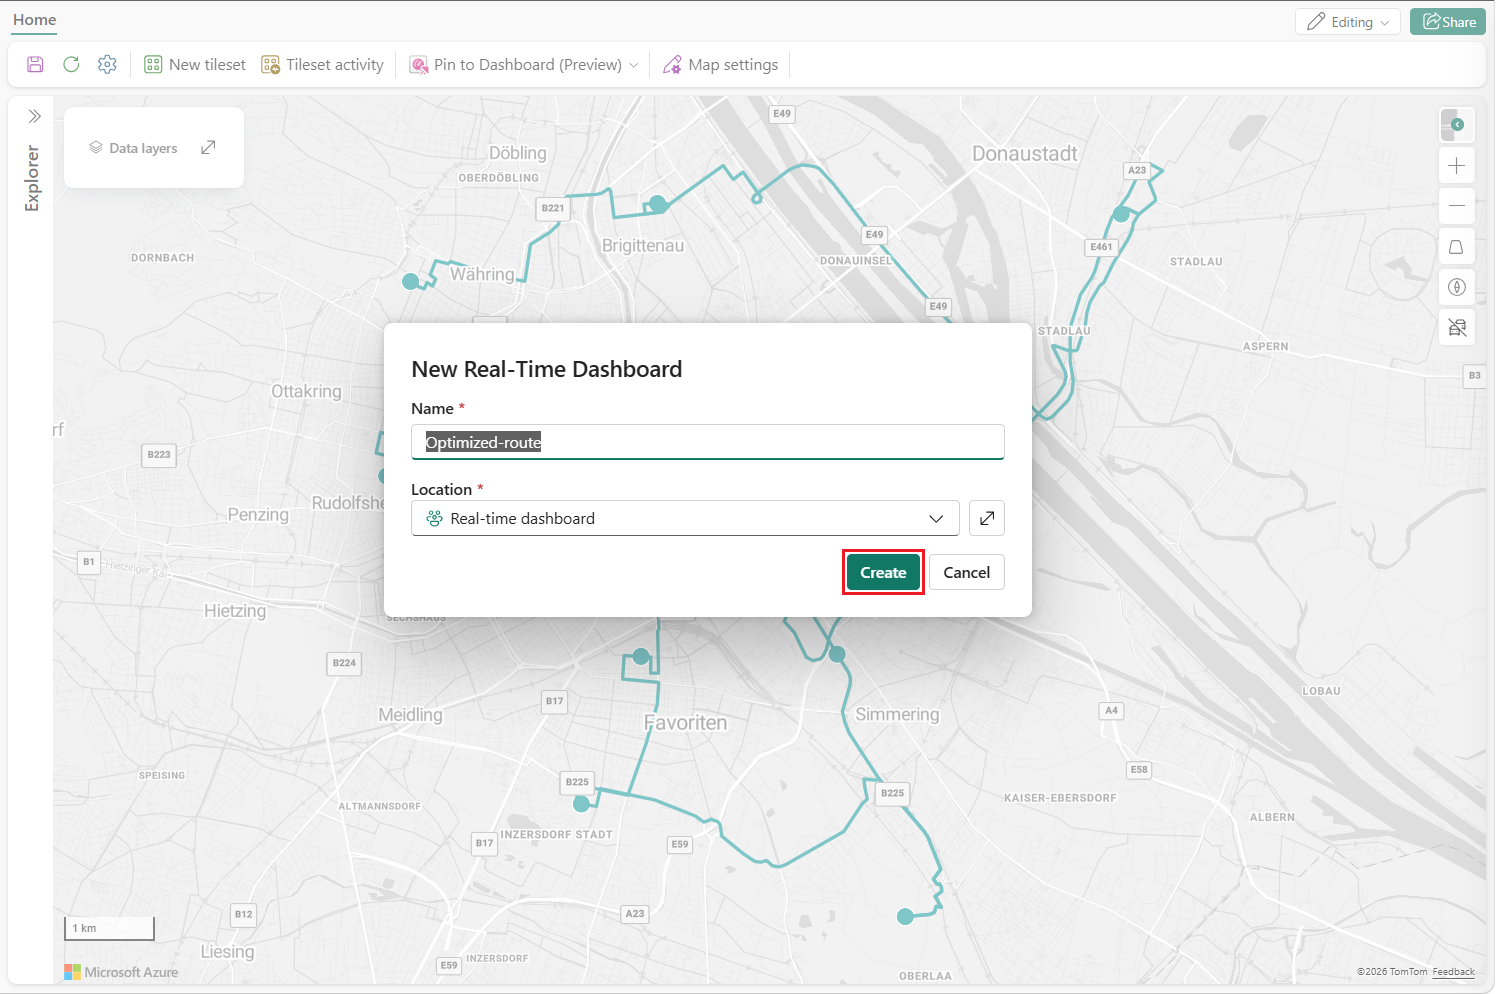
- In the New Real-Time Dashboard dialog, enter a Name for the new dashboard and select the workspace in the Location field. The default Location is the current workspace.
- Select Create.
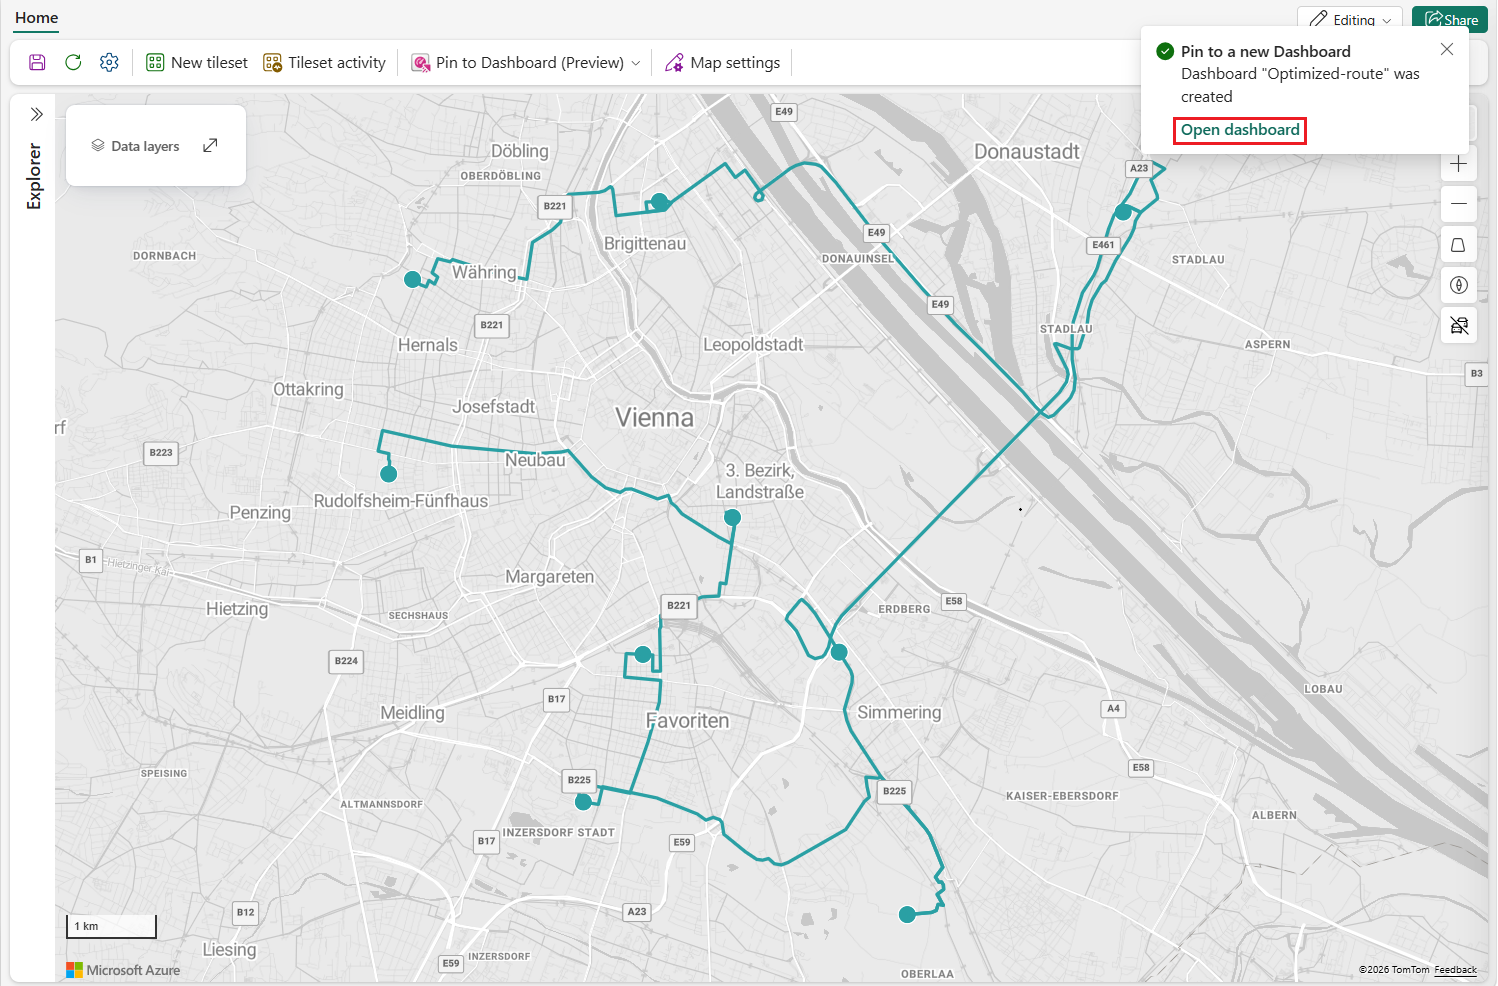
- Select Open dashboard from the notification alerting you that the dashboard was created.
For more information on using Real-Time Dashboard, see What is Real-Time Dashboard?
Pin to an existing Real-Time Dashboard
- Open the Fabric map and select the layer you want.
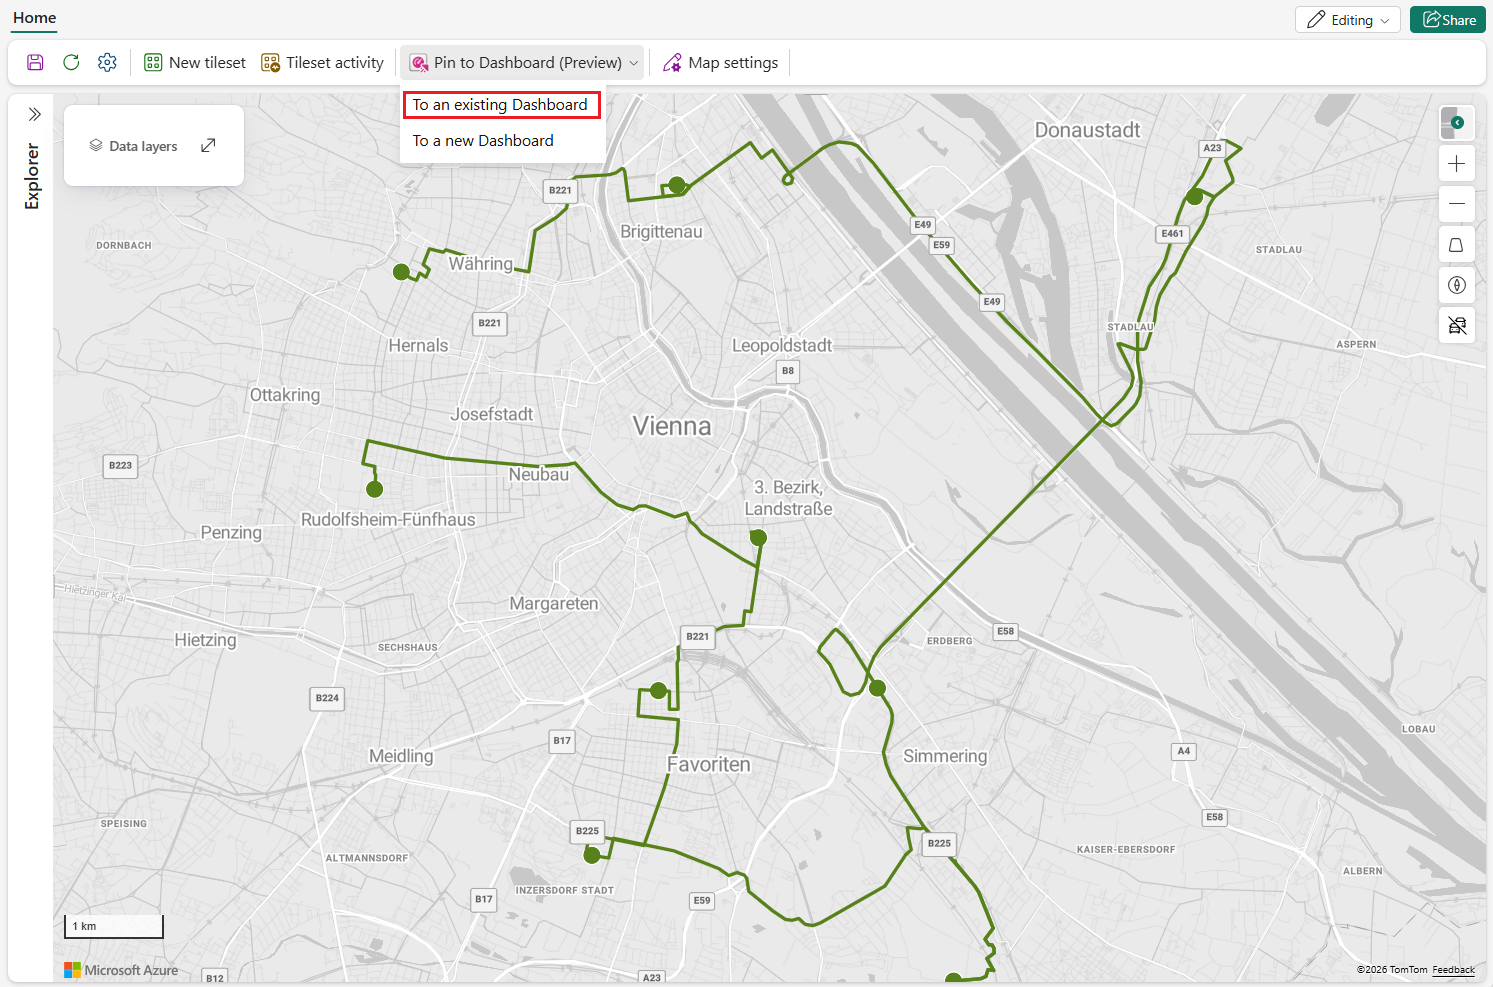
- Select Pin to dashboard (preview).
- Select To an existing Dashboard.
- In the Select a dashboard to pin to screen, select the existing dashboard to pin to.
- Select Pin.
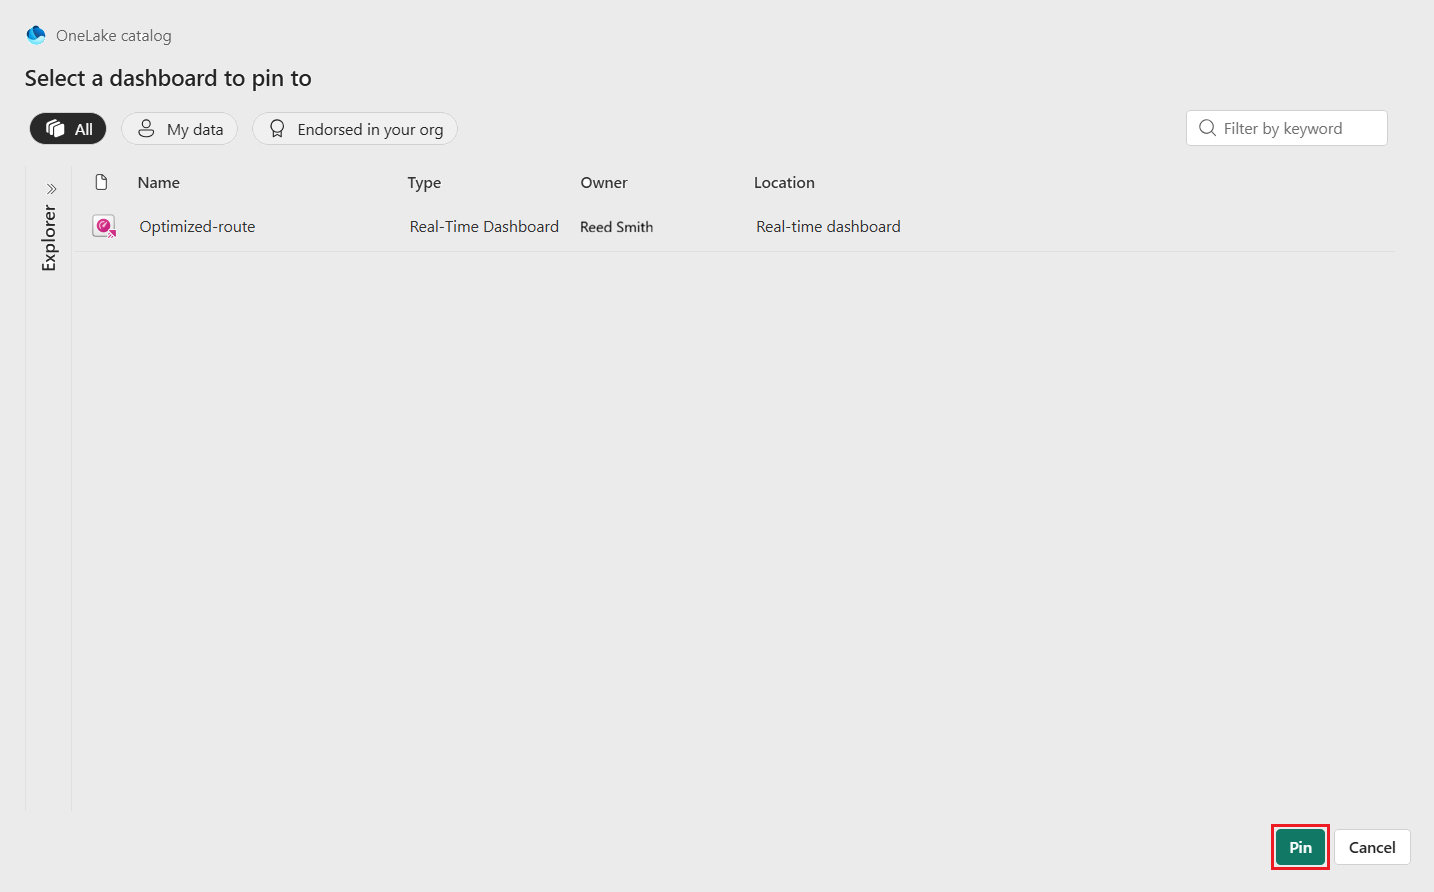
You can pin the same map to multiple dashboards. If the destination dashboard already contains the map, pinning it again creates another Fabric Maps visual. For more information on using Real-Time Dashboard, see What is Real-Time Dashboard?
Work with the Fabric Maps visual
The Fabric Maps visual renders the source map in view-only mode. Dashboard viewers can:
- Zoom the map.
- Pan the map.
- Hover over supported features.
- View basic tooltips.
- Temporarily add, modify, or remove unlocked map-layer filters.
The tile also supports the standard Real-Time Dashboard resize and maximize capabilities.
Dashboard authors and viewers can interact with map-layer filters as they can in Fabric Maps view mode. They can add, modify, or remove unlocked filters, but they can't remove locked filters. Filter changes made in the dashboard are temporary and aren't saved to the source map item. Open the source map item to permanently change its queries, data sources, layers, filters, or styling.
Refresh and source map updates
The tile uses the source map's layer refresh behavior and participates in Real-Time Dashboard refresh cycles. However, an open dashboard doesn't automatically detect saved map configuration changes. Reload the dashboard page to display changes to the source map's queries, layers, filters, or styling.
Permissions
Pinning a map to a dashboard doesn't grant access to either item or to the map's underlying data. A dashboard viewer needs:
- Access to the Real-Time Dashboard.
- Access to the source map item.
- Access to every underlying data source required by the map.
The dashboard viewer's identity and permissions authorize access to the map and its underlying data sources. The dashboard editor's identity doesn't provide access to the referenced map data.
If a viewer can open the dashboard but can't access the map or one of its data sources, the Fabric Maps visual displays an error state.
Lifecycle behavior
The dashboard references the source map by item ID:
- If you rename or move the map, the tile continues to reference it.
- If you delete the map or the viewer loses access, the tile displays an error state.
- Multiple dashboard tiles and multiple dashboards can reference the same map.
Supported map content
The Fabric Maps visual supports the same data sources and layer types as the source map unless a limitation is explicitly documented.
Limitations and considerations
- The Fabric Maps visual is view-only.
- Filter changes you make in the dashboard are temporary and don't save to the source map item.
- You can't edit the map's queries, data sources, layers, or styling from the dashboard.
- The Fabric Maps visual doesn't use Real-Time Dashboard parameters. As a result, cross-filters and drillthroughs, which pass values through dashboard parameters, don't filter or modify the map.
- Tile interactions in this release are limited to zoom, pan, hover, basic tooltips, and temporary map-layer filtering.
- You must have access to the dashboard, map item, and all required map data sources.
- A deleted or inaccessible source map causes the tile to display an error state.
Next steps
For access requirements, see Permissions in Fabric Maps.