Note
Access to this page requires authorization. You can try signing in or changing directories.
Access to this page requires authorization. You can try changing directories.
Note
This tutorial is part of a series. For the previous section, see: Tutorial part 7: Detect anomalies on an Eventhouse table.
In this part of the tutorial, you learn how to create a map using geospatial data.
Create a function in KQL database
In this step, you create a function in the KQL database that points to the geospatial data in the Eventhouse table. This function allows you to easily query the geospatial data and use it in the map.
Open the Tutorial eventhouse that you created in the previous part of the tutorial.
Select the Tutorial_queryset.
Select the + button on the ribbon to create a new tab.
Select the pencil icon on the tab and rename the query tab Show on map.
Copy/paste and run the following query.
.create-or-alter function funcForMap() {
    TransformedData
    | where ingestion_time() > ago(30d)
    | project Street, Neighbourhood, toreal(Latitude), toreal(Longitude), No_Bikes, No_Empty_Docks
    | summarize sum(No_Bikes), sum(No_Empty_Docks) by Street, Neighbourhood, Latitude, Longitude
}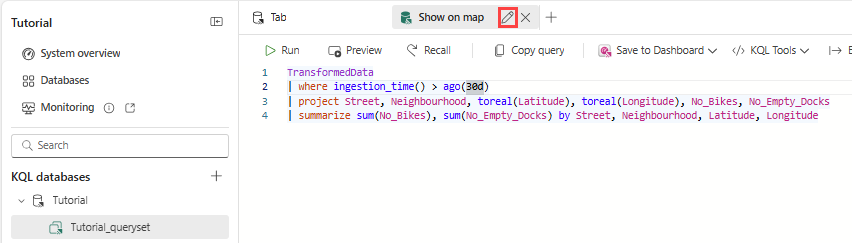

Create a Lakehouse and upload GeoJson files
Browse to your workspace and in upper left corner select the + New item button. Then search for and select Lakehouse.
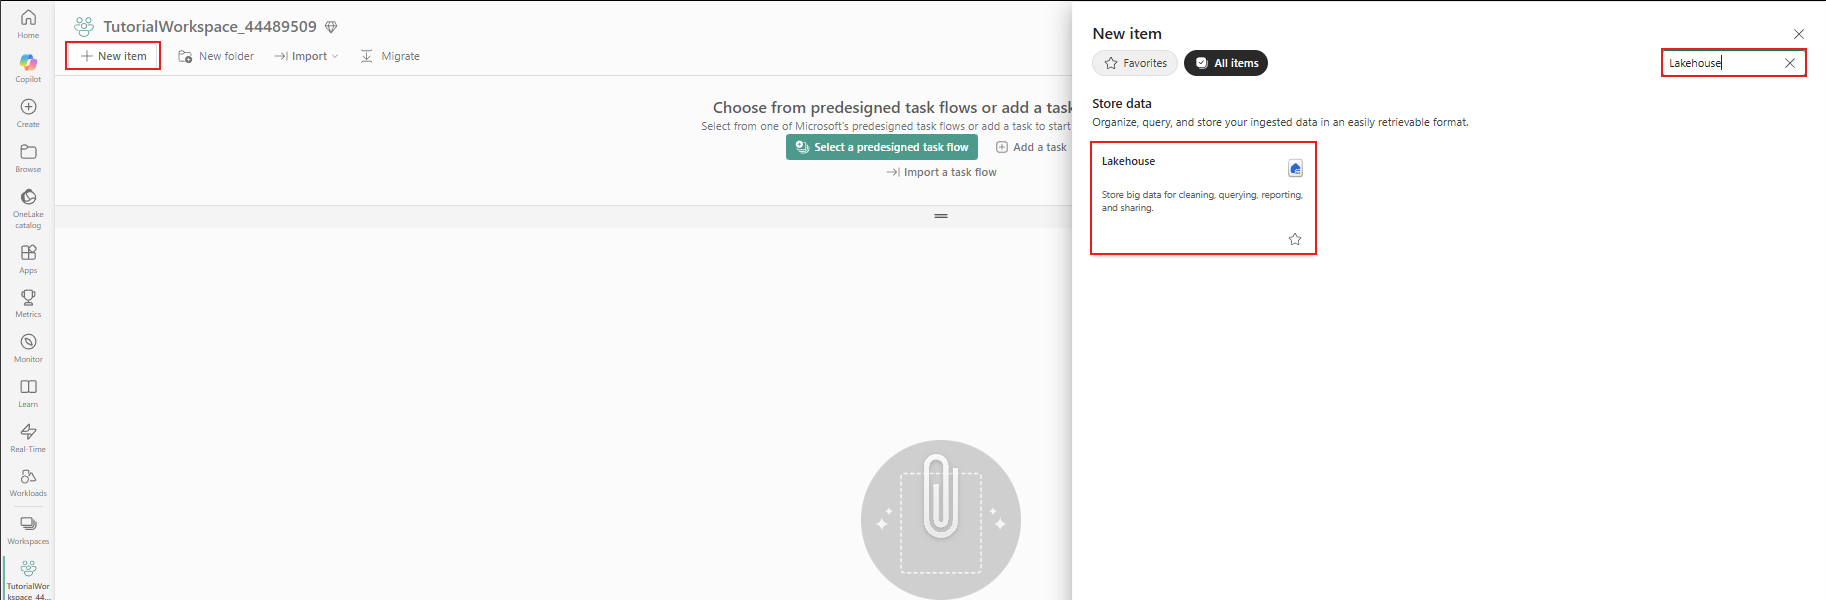
Enter TutorialLakehouse as name.
Select the workspace in which you created your resources.
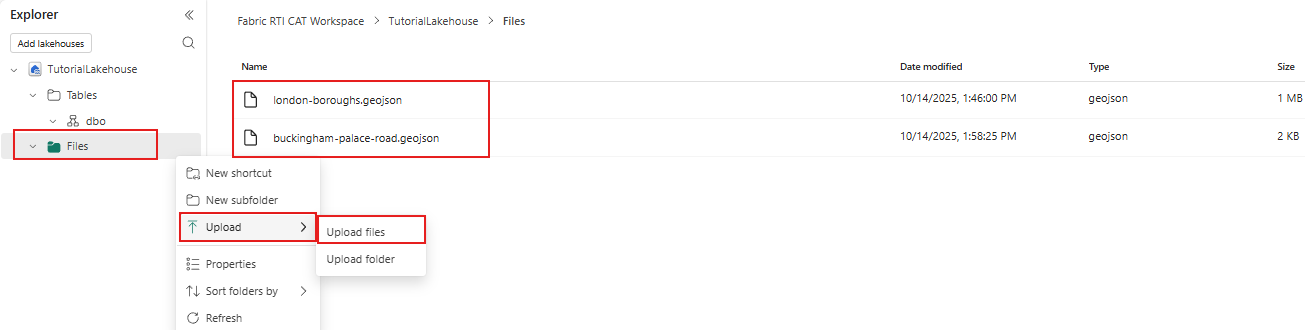
Right-click the File node and under Upload, and select Upload files.
Download the following two GeoJSON files from the following links and upload them to the Lakehouse.


Create a map
Browse to your workspace and in upper left corner select the + New item button. Then search for and select Map.
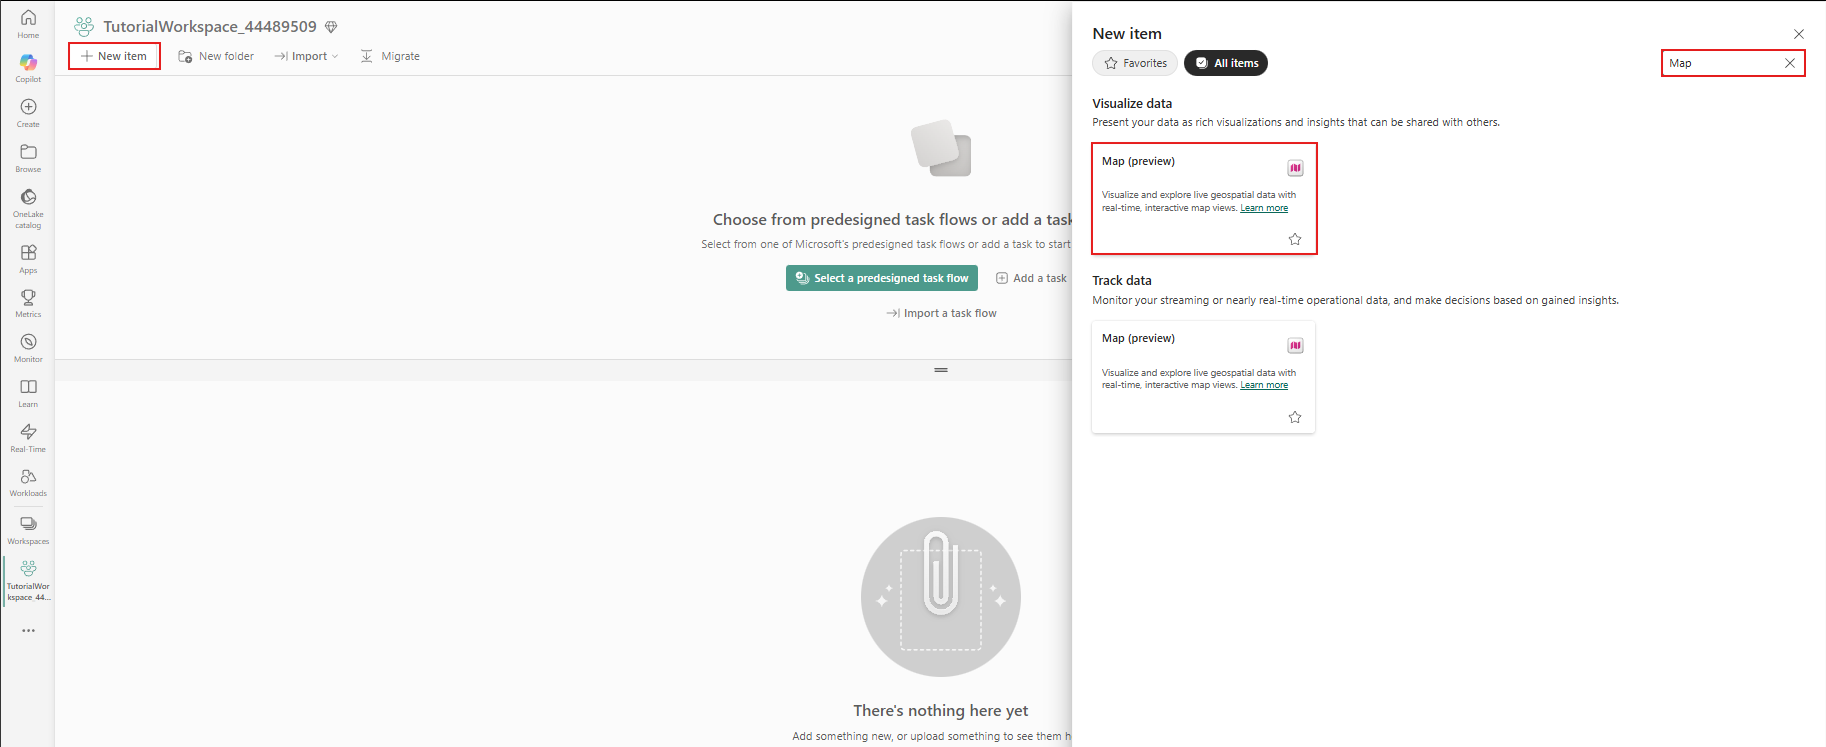
Enter TutorialMap in Name, and select Create

Add Eventhouse data to the map
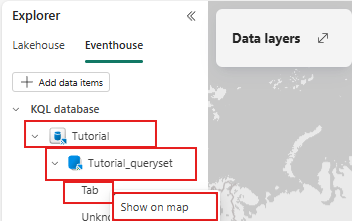
In the Explorer pane, select + Add, and select KQL Database.
Choose the Tutorial eventhouse.
Select Connect.
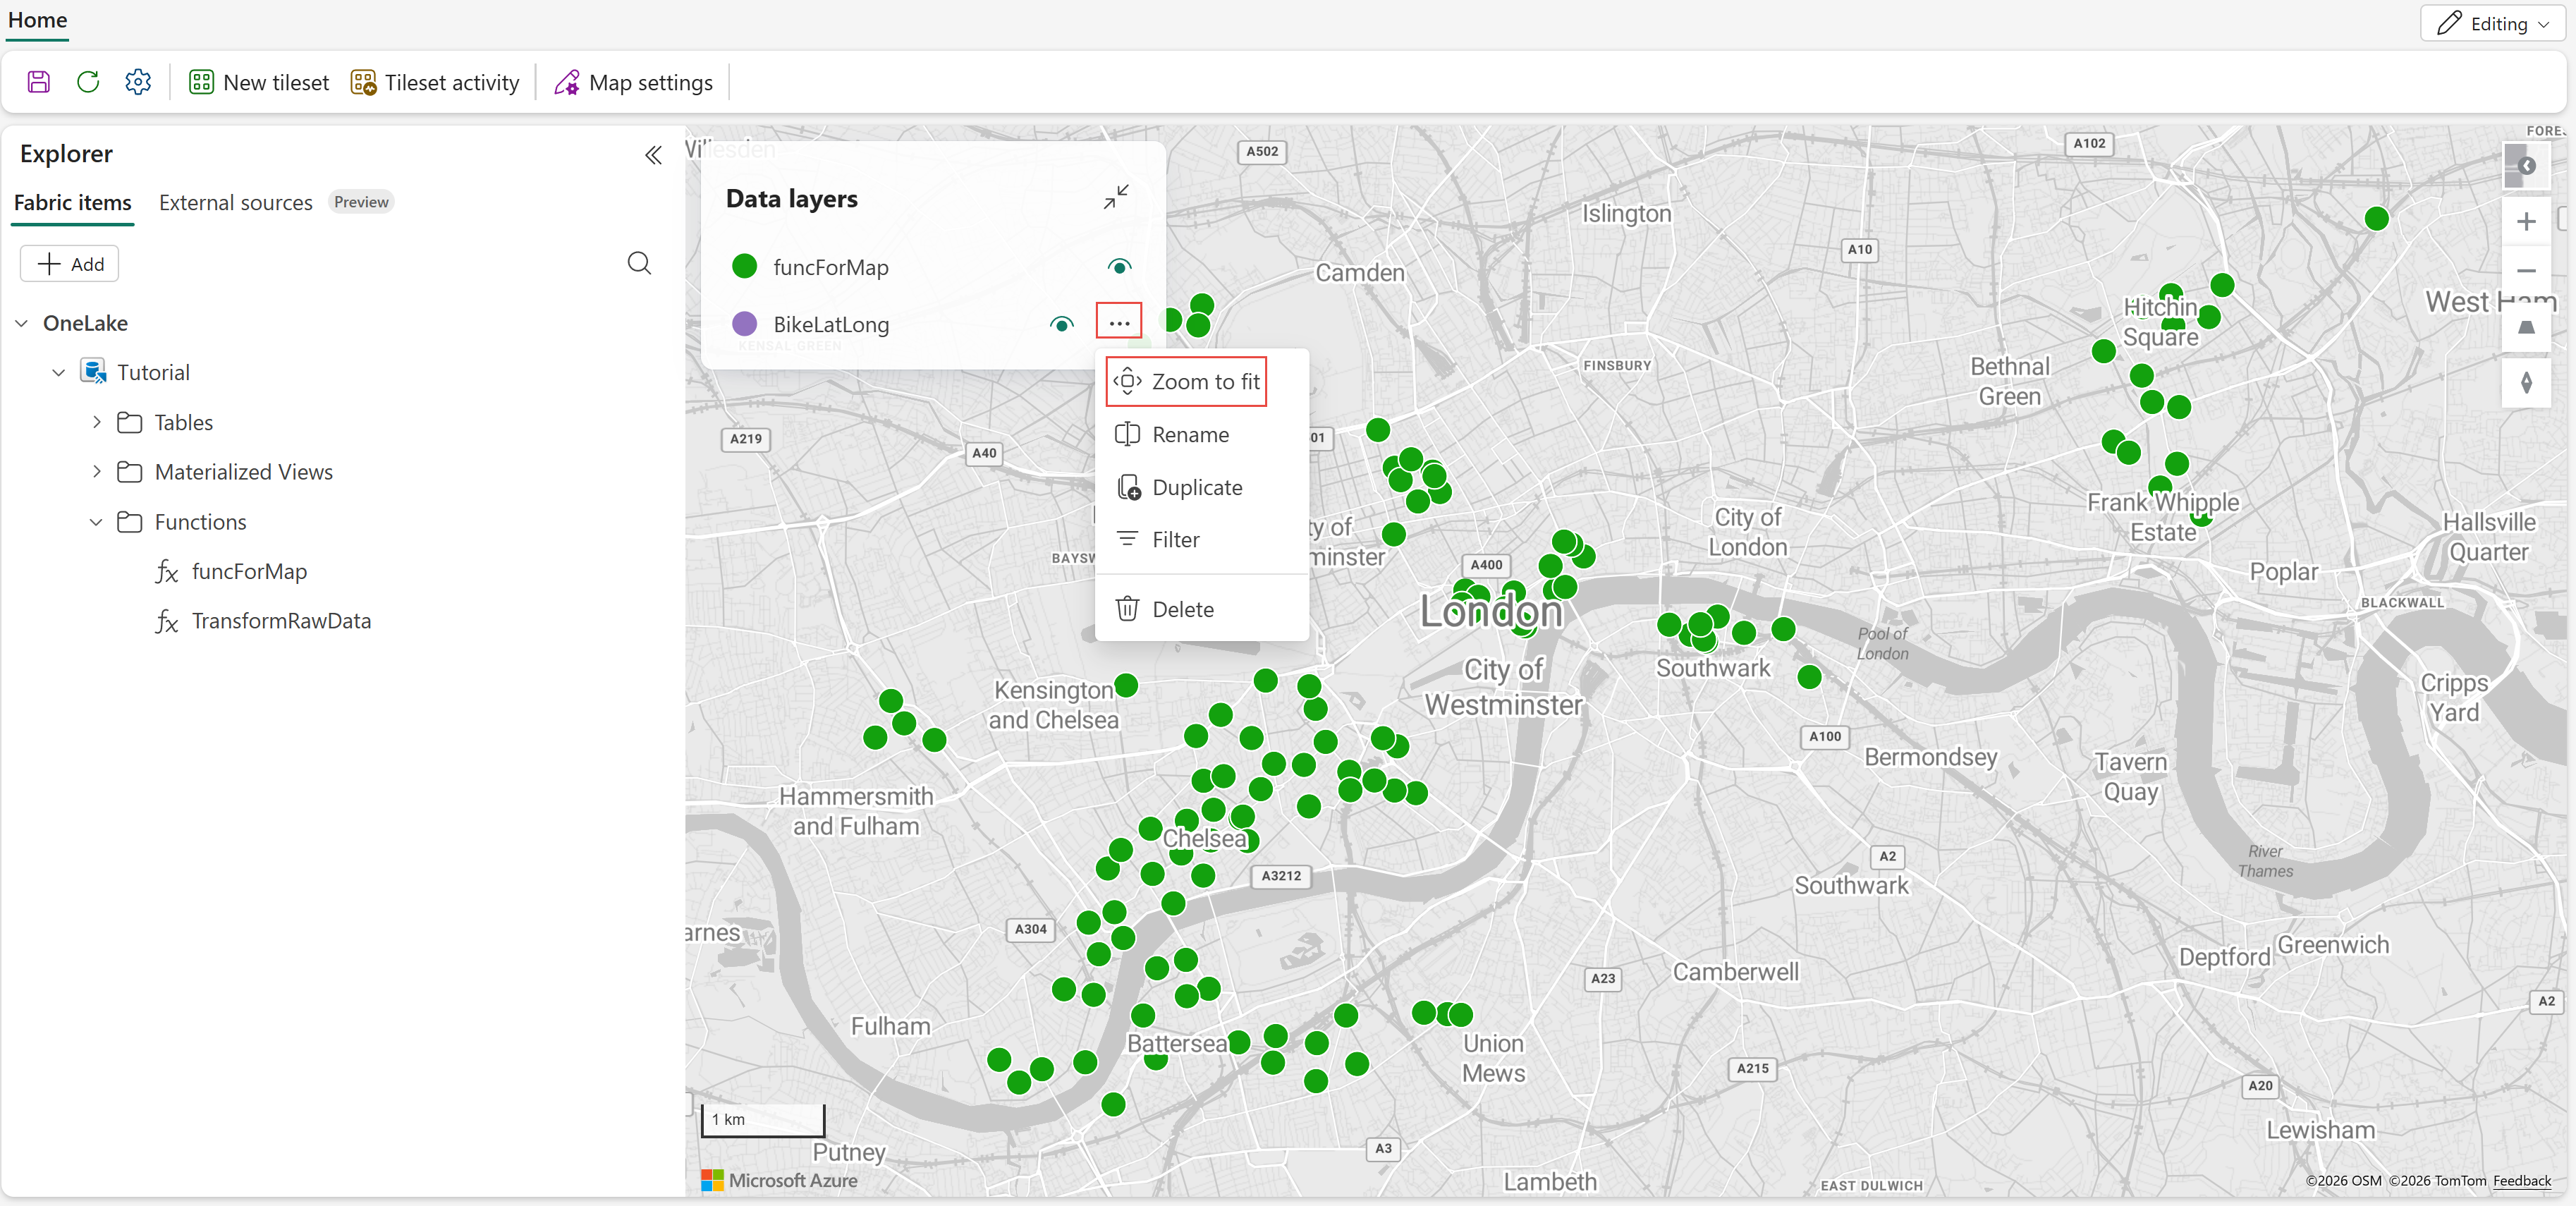
Under Tutorial, expand Functions and select the funcForMap function.
Select the more menu (...) next to funcForMap and select Show on map.
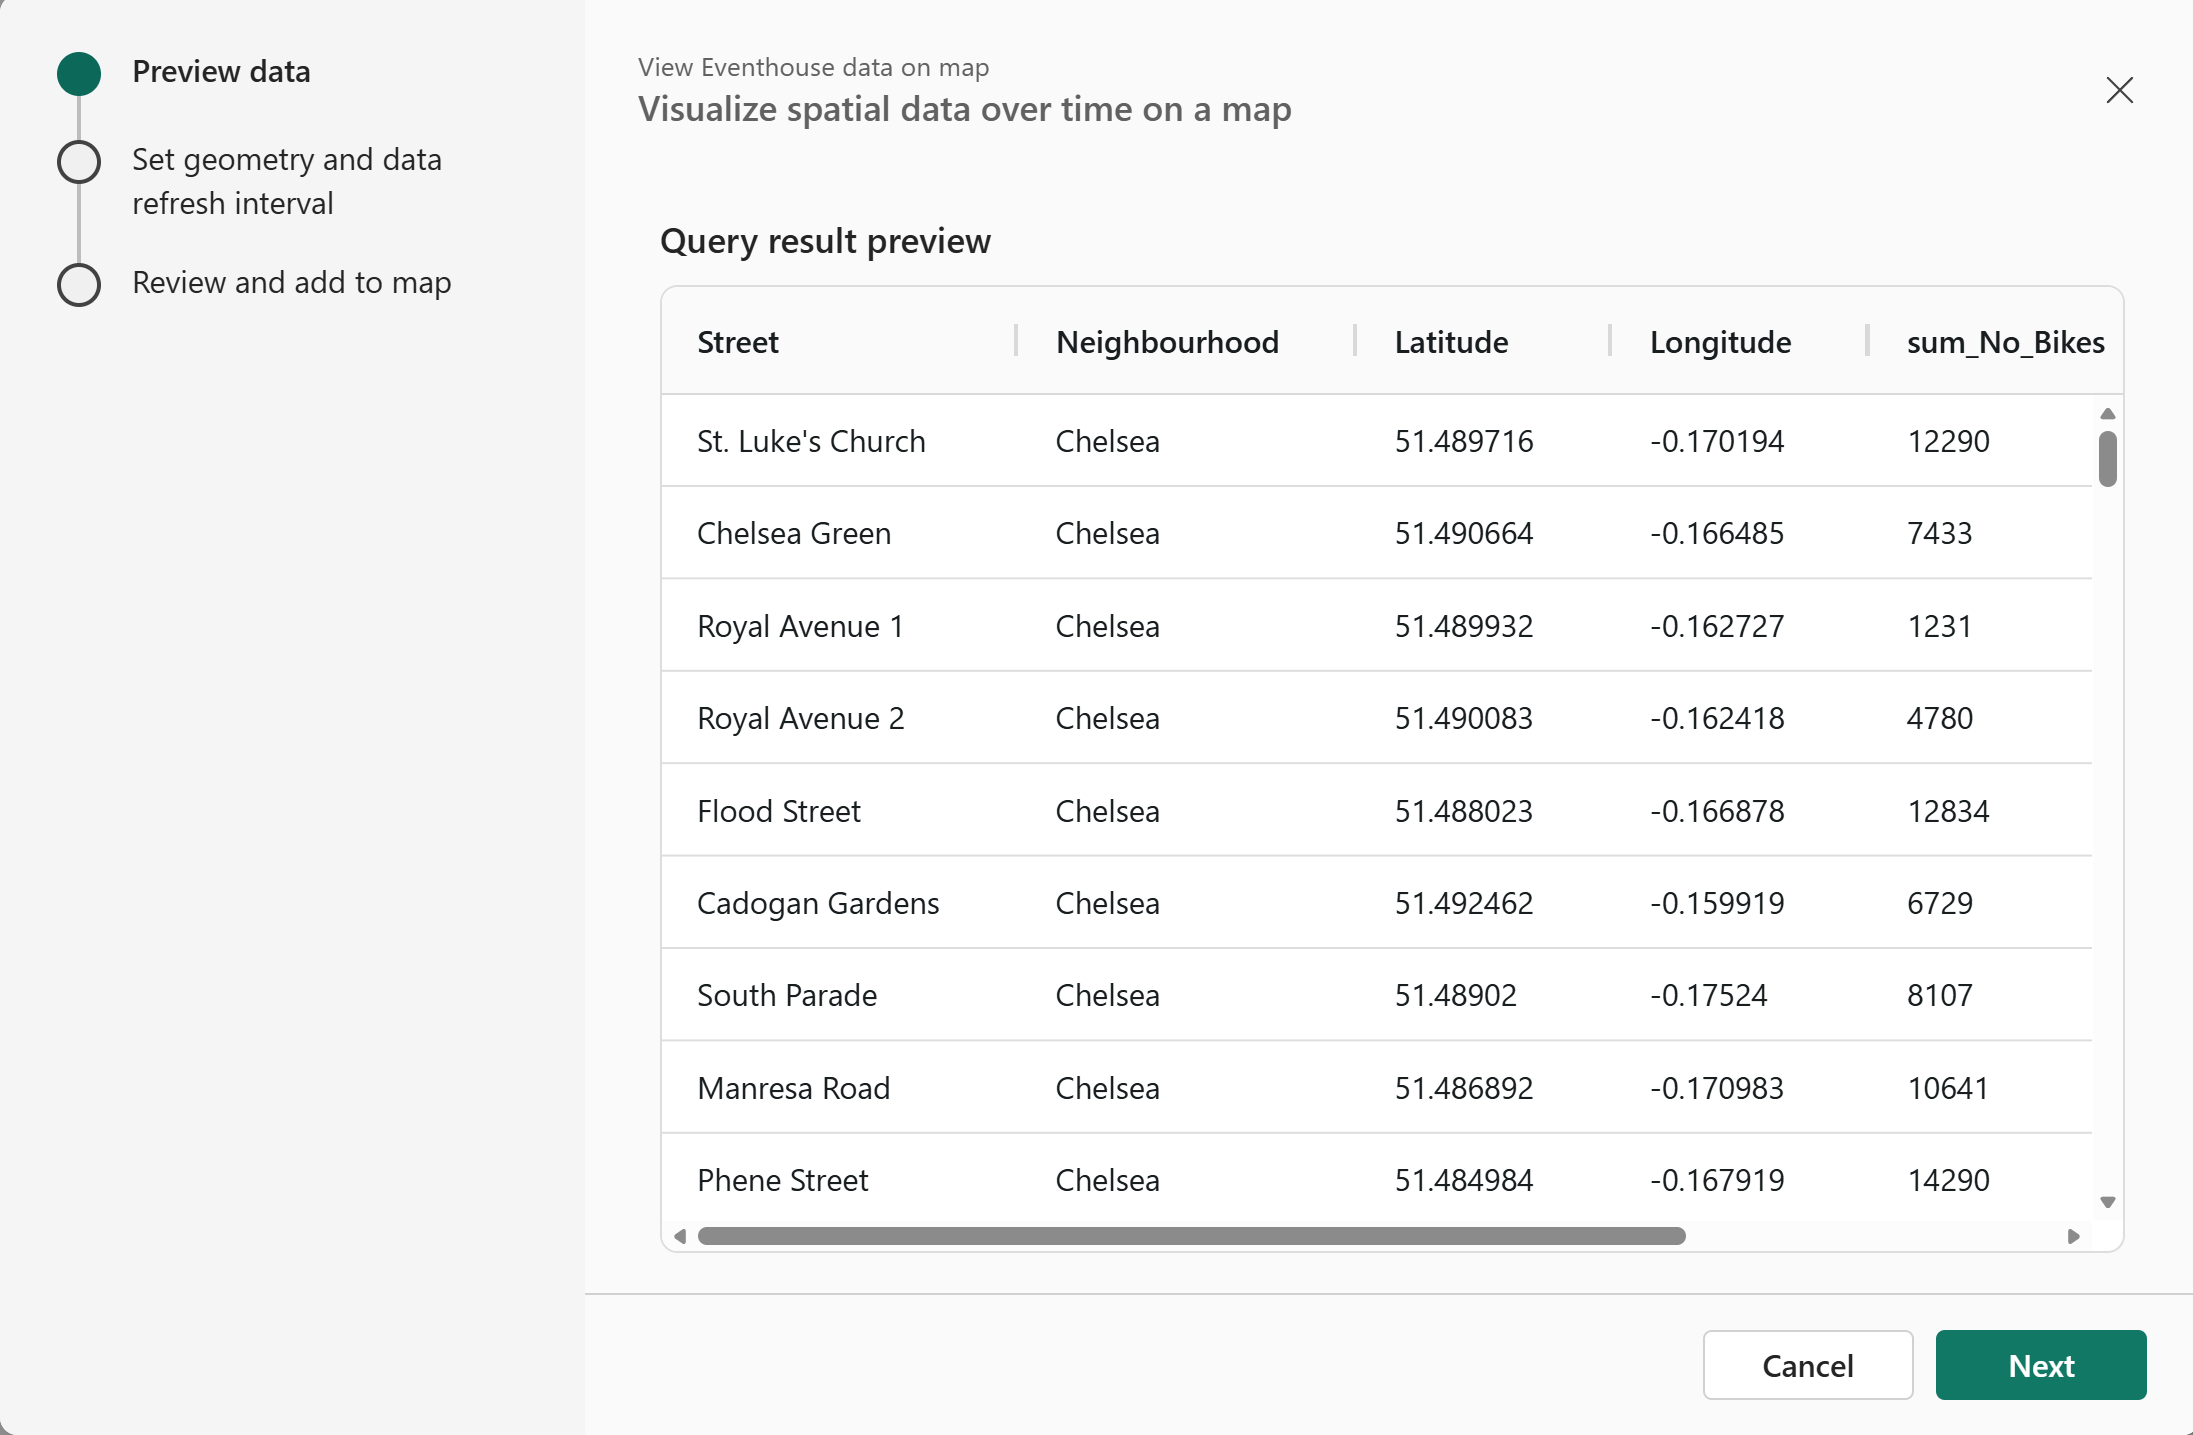
A new window showing data preview of the query opens. Select Next .
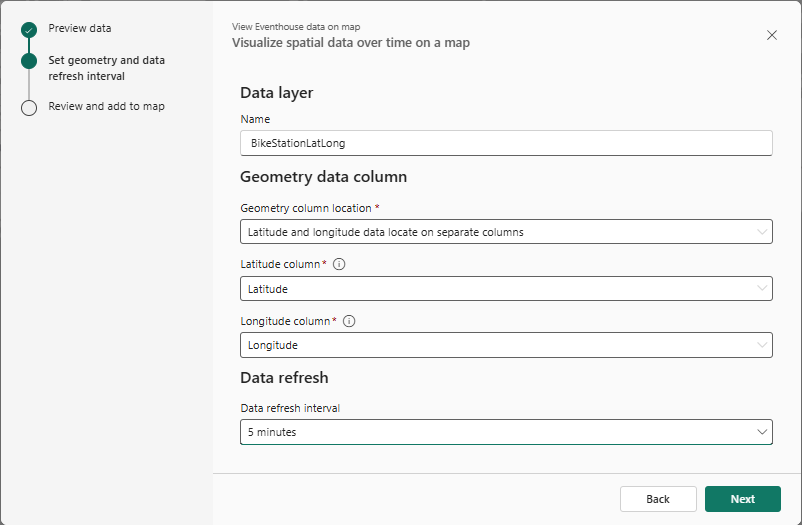
On the Set geometry and data refresh interval page of the wizard, follow these steps:
- Enter BikeLatLong as Name.
- For Geometry column location, select Latitude and longitude in separate columns.
- For Latitude column, select Latitude.
- For Longitude column, select Longitude.
- Under Data refresh interval select 5 minutes. Select Next.
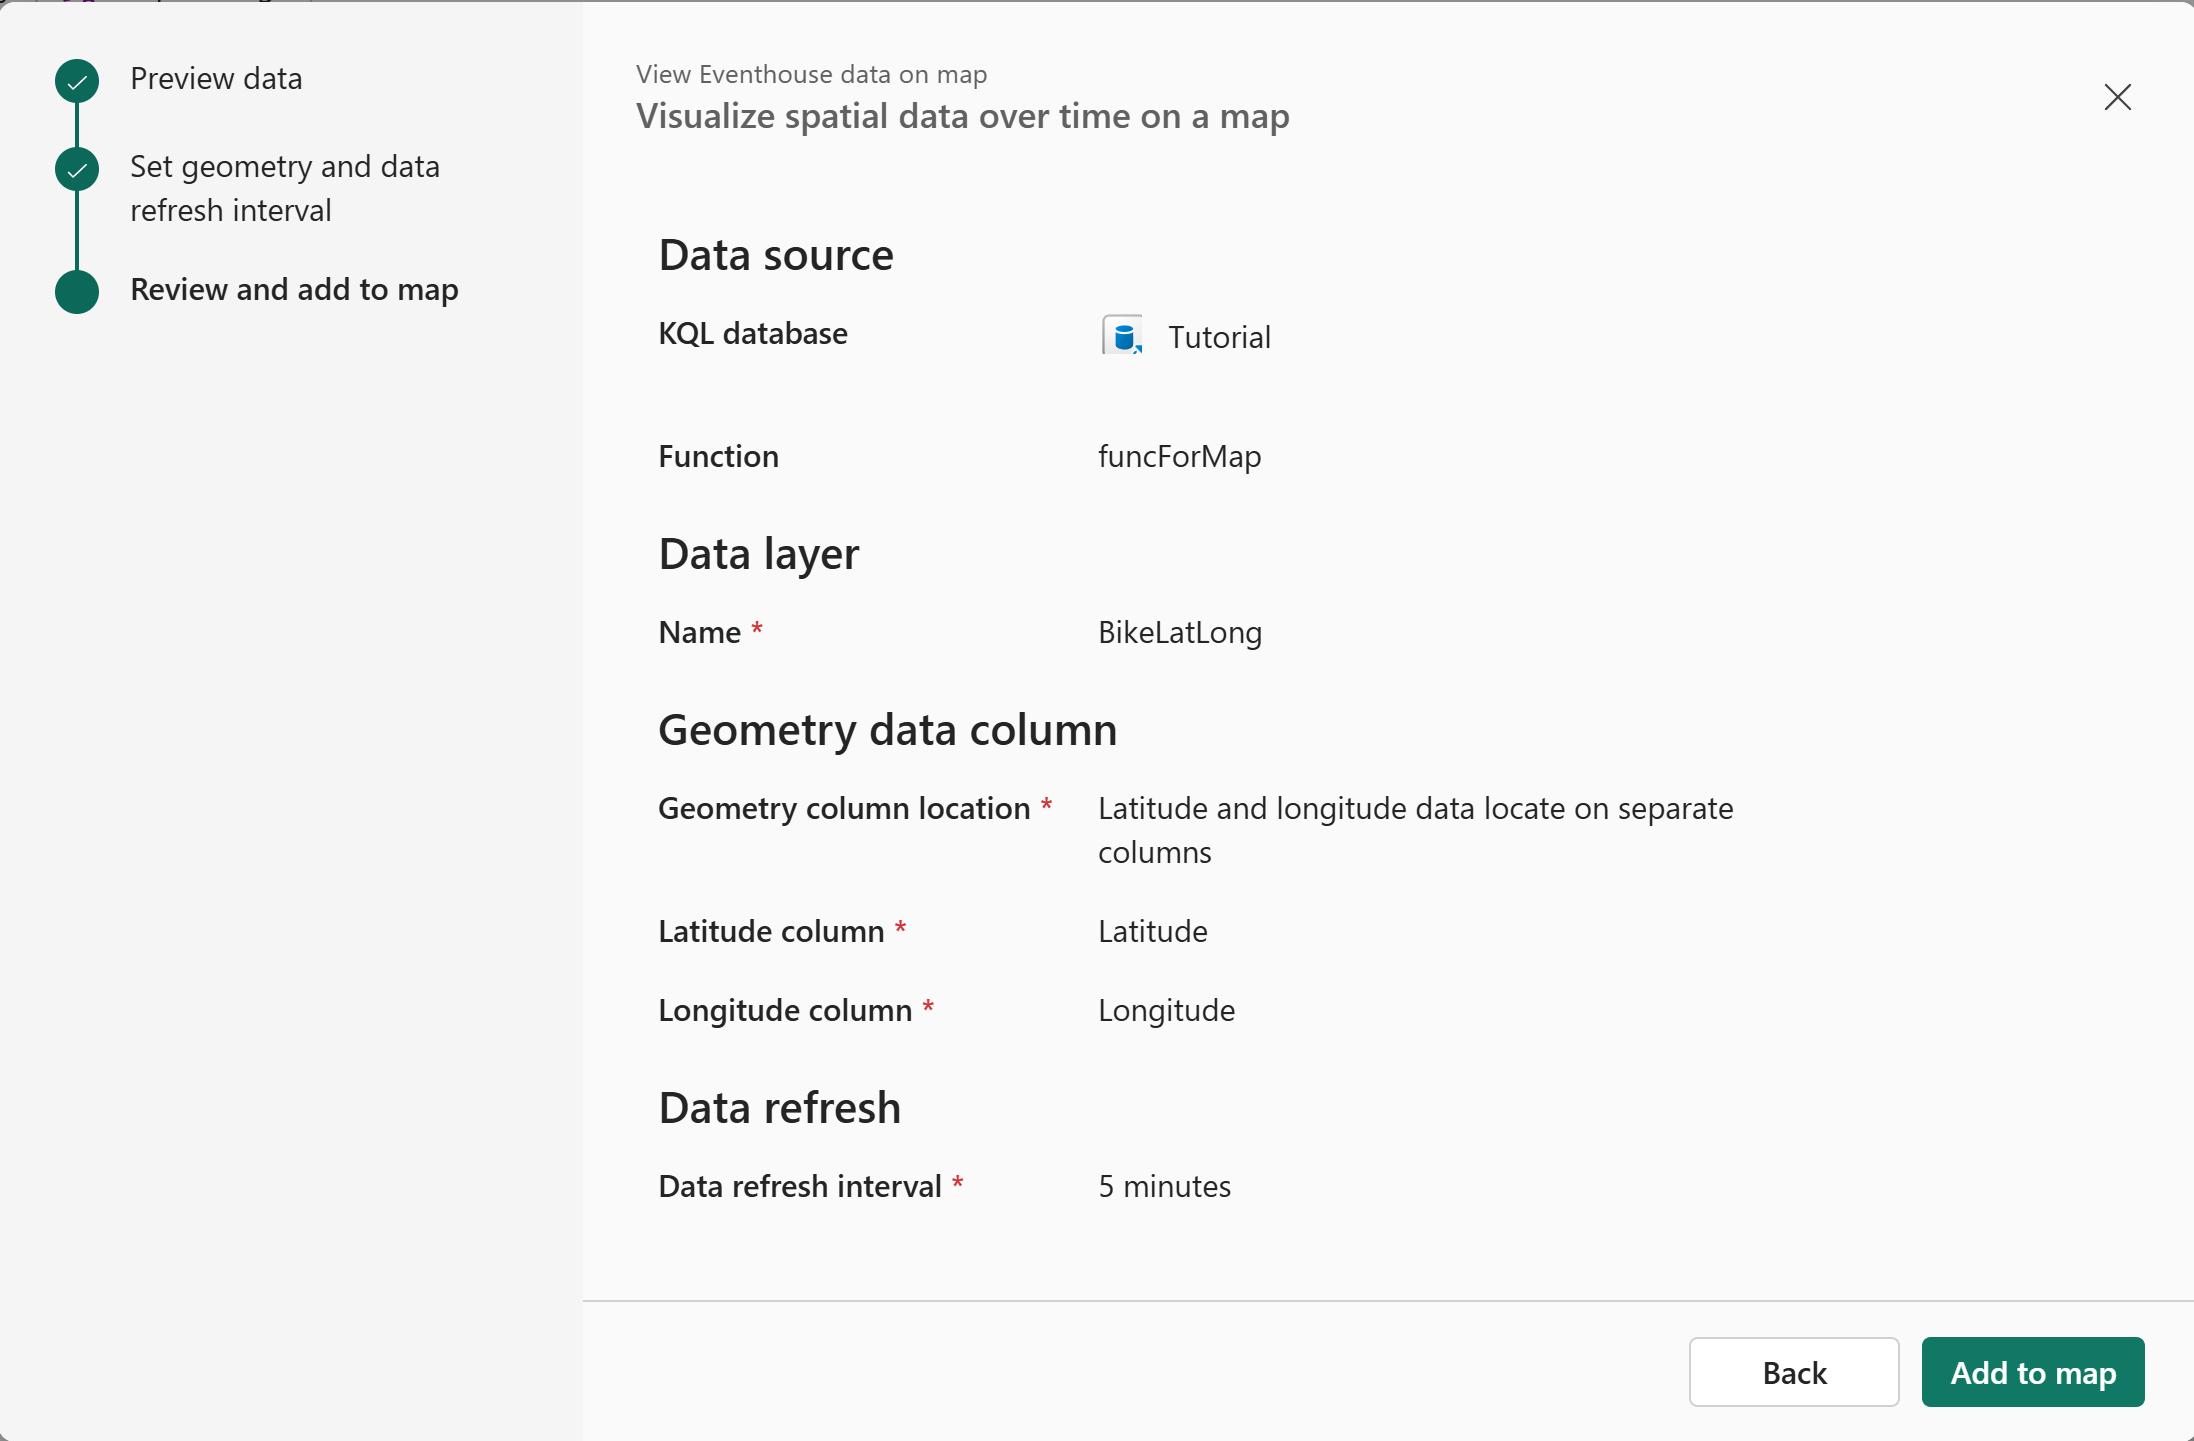
On the Review and add page of the wizard, select Add to map.
Hover the mouse over BikeLatLong in the Data layers section, select ..., and then select Zoom to fit to zoom into a London area showing bike stations on the map.
Select BikeLatLong under Data layers, and follow these steps:
Expand General settings, and add Street and Neighborhood under for Tooltips.
Select Enable data-driven styling.
Change Size to By data and select sum_No_Empty_Docks.
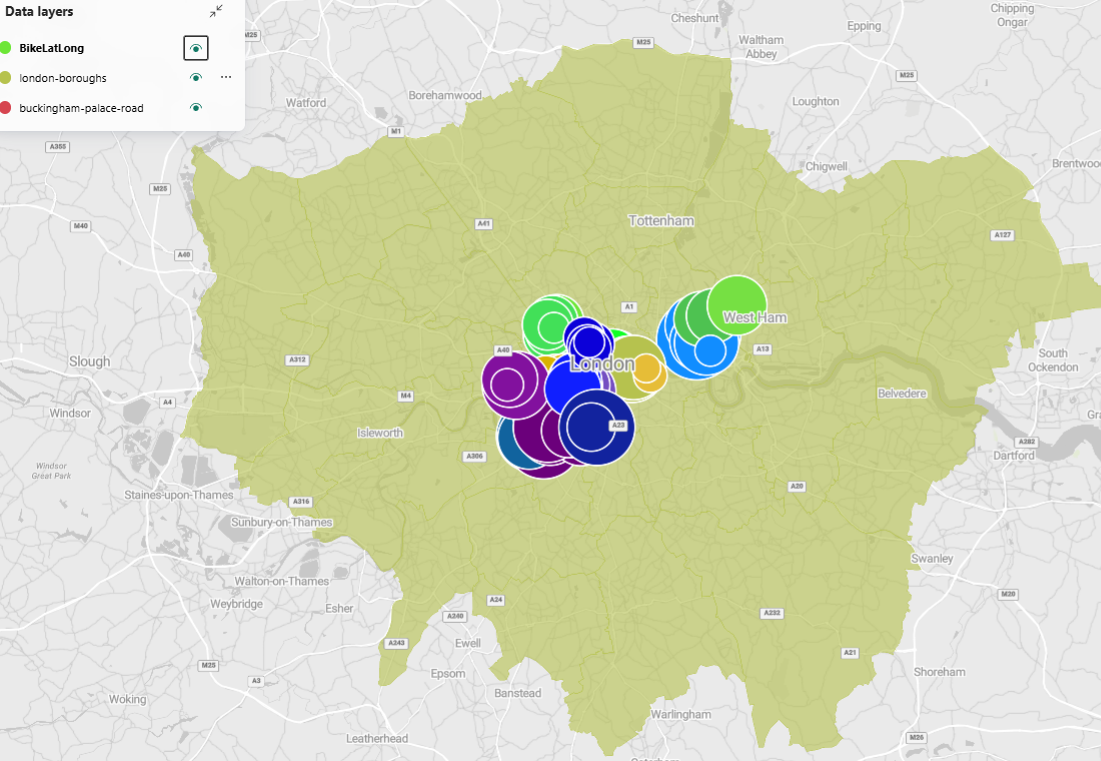
This setting should immediately take effect on the map with bubble sizes representing the number of empty docks and colors representing different neighborhoods.


Add GeoJSON files from Lakehouse to the map
In the Explorer pane, select + Add, and select Lakehouse.
Choose the TutorialLakehouse lakehouse and select Connect.
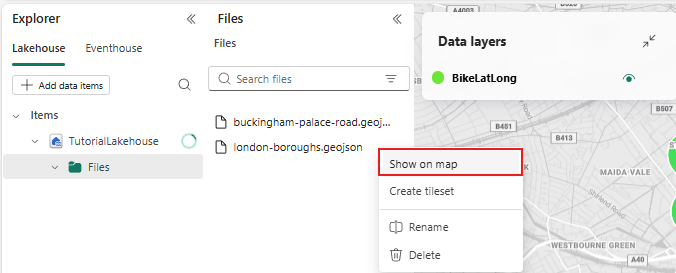
Expand TutorialLakehouse, expand Files, and then select the london-boroughs.geojson file and right-click on the file and select Show on map. Repeat the step for buckingham-palace-road.json file.
The borough boundaries and Buckingham Palace road appear on the map. You can toggle visibility of each layer by selecting the eye icon next to each layer under Data layers.
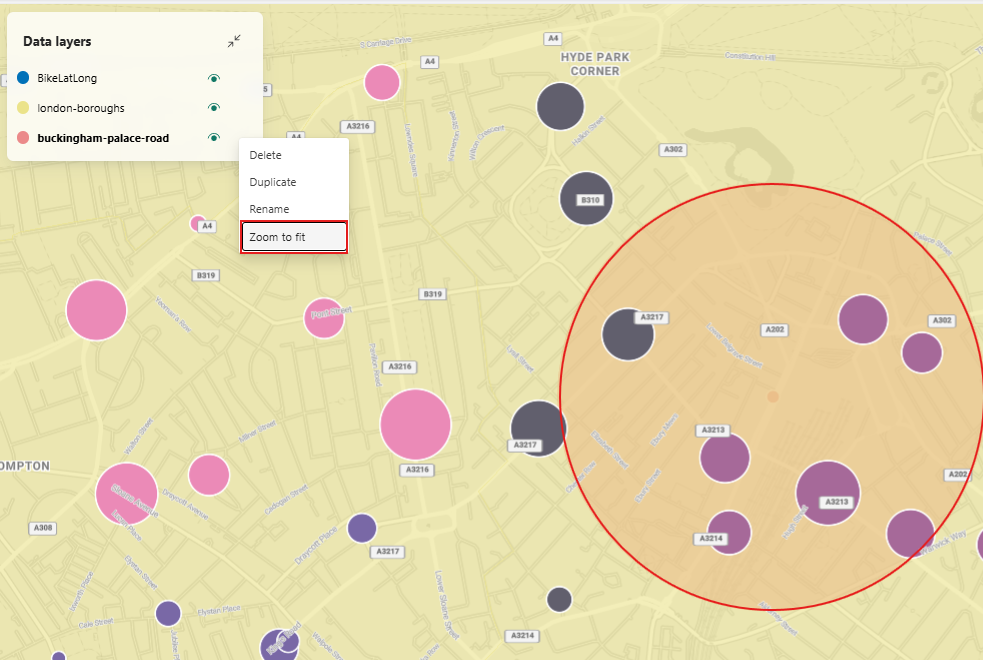
In the Data layers section, hover the mouse over buckingham-palace-road, select ..., and select Zoom to fit to zoom into Buckingham Palace road area on the map.
From the menu bar, select the Save icon.


Related content
For more information about tasks performed in this tutorial, see: