Note
Access to this page requires authorization. You can try signing in or changing directories.
Access to this page requires authorization. You can try changing directories.
Important
Some or all of this functionality is available as part of a preview release. The content and the functionality are subject to change.
After you prepare your disclosure metrics data, you can visualize this data against CSRD disclosures in Purview Compliance Manager.
To visualize the disclosure metrics data in the CSRD assessment in Compliance Manager, first configure a connector to import the metrics data from the lakehouse in Sustainability Data Solutions in Microsoft Fabric. Then link the connector instance to a CSRD assessment in Compliance Manager.
First, you need to connect your data from Sustainability data solutions in Microsoft Fabric to the CSRD template in Compliance Manager. Then, in Compliance Manager, you can create an assessment and compare your disclosure metrics data against CSRD requirements.
Configure a Purview connector
In this step, you configure a Purview connector to import the data from Sustainability data solutions in Fabric. The connector instance reads the metric extract files from the specified OneLake folder path, and then it transforms and updates the metrics data to Compliance Manager. For more information about creating a Purview connector, go to Import Sustainability data.
This step has these prerequisites:
Ensure that metric extracts, including the metadata, are published in JSON format in the ComputedESGMetrics lakehouse files section. For more information about generating metric extracts and metadata files, go to Overview of ESG data estate.
Ensure that you create an app identity in your Microsoft Entra ID tenant and assign that identity Read all Apache Spark permission at the ComputedESGMetrics lakehouse so the connector can use this identity to read the metrics extract data via OneLake APIs.
Create an assessment
In this step, you create a CSRD assessment in Compliance Manager and link the connector instance to the assessment.
In Compliance Manager, select the Assessments tab. Select Add Assessment, select Corporate Sustainability Reporting Directive, and then select Next. Alternatively, you can open the Regulations tab, search for and select Corporate Sustainability Reporting Directive, and then from the regulation page, select Add assessment from the ellipses (...).
Enter the name for the assessment, select the group in which you want to create the assessment, and then select Next.
Note
A group can have only one CSRD assessment.
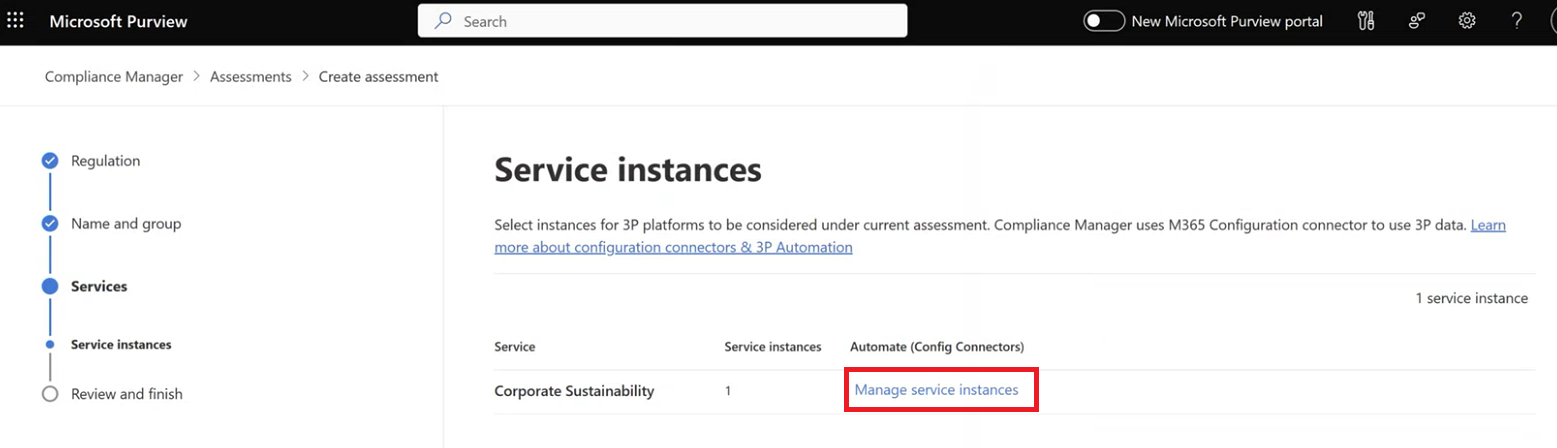
On the Service instances page, select Corporate Sustainability. Select Manage services instances, and then select the Sustainability data solutions connector instance that you want to link to this assessment for updating the metrics data from Sustainability data solutions in Fabric Lakehouse to the improvement actions in the assessment. Select Update, and then select Next.
Note
If you haven't created the connector instance, you can create the assessment without linking the connector instance. After you create the connector instance, you can link it to the assessment by selecting Edit assessment in the ellipses (...) menu on the assessment detail page.
On the Review and finish page, review the details, and then select Create assessment. When the process finishes, select Done. After you create the assessment, it displays on the Assessments tab in Compliance Manager.

View metrics data against CSRD disclosure requirements in the Compliance Manager assessment
After you link your assessment to the Sustainability data solutions in Fabric connector instance, within 24-48 hrs the disclosure metrics data should appear on the corresponding improvement action detail page of the assessment. You can then view the disclosure metrics in Compliance Manager and compare them against disclosure details (improvement actions) in the assessment.
Note
It can take 24-48 hours before disclosure metrics data from Sustainability data solutions in Microsoft Fabric appears appears on the corresponding improvement action detail page of the assessment.
Disclosure metrics data only appears for the metrics that were published successfully. If the data doesn't appear, retry the steps in Prepare data for CSRD disclosures.

In Compliance Manager, select the Assessments tab.
Select the assessment that is linked to the connector instance.
Select the Controls tab to view the control families or the disclosure categories. Expand the accordion to view the controls or disclosure requirements of a specific control family. Select the control to view the list of improvement actions or disclosure details. Select a specific improvement action to view the updated disclosure data.
Note
Disclosure metrics data is only updated for improvement actions where the metrics data that is computed and published by Sustainability data solutions in Fabric. Prebuilt computation logic is available for these improvement actions in the ESG data estate capability of Sustainability data solutions in Fabric.
| Control family | Control | Improvement action |
|---|---|---|
| ESRS E1 Climate change | Gross Scopes 1, 2, 3 and Total greenhouse gas (GHG) emissions | E1-6-41-a: Gross scope 1 GHG emissions E1-6-41-b: Gross scope 2 GHG emissions E1-6-41-c: Gross scope 3 GHG emissions E1-6-41-d: Total GHG emissions E1-6-50: Total GHG emissions per net revenue E1-6-52: Net revenue |
| ESRS E3 Water and Marine resources | Water consumption | E3-4-1-a: Total water consumption E3-4-1-b: Total water consumption in areas of material water risk E3-4-2-a: Total water recycled E3-4-3: Water consumption revenue intensity |
| ESRS E5 Resource use and circular economy | Resource outflows | |
| E5-5-3-a: Total waste generated E5-5-4-a: Waste by stream E5-5-5: Total hazardous and radioactive waste |
||
| ESRS S1 Own Workforce | Health and Safety indicators | S1-14-84-b: Number of fatalities S1-14-84-c: Rate of work-related accidents S1-14-84-e: Number of days lost to injuries, accidents, fatalities, or illness |
| Compensation indicators | S1-16-92-a: Gender pay gap S1-16-92-b: Excessive CEO pay ratio |
|
| Incidents, complaints, and severe human rights impacts and incidents | S1-17-98-a: Incidents of discrimination S1-17-99-a: Violations of United Nations Global Compact (UNGC) principles and OECD |
|
| Training and skill development indicators | S1-13-80-a: Percentage of employees participated in regular performance and career development reviews S1-13-80-b: Average number of training hours per person for employees |
|
| Characteristics of the undertaking’s employees | S1-6-51-a: Total number of employees | |
| ESRS 2 General Disclosures | Organizational roles and responsibilities | ESRS2-GOV-1-1-d: Board's gender diversity ESRS2-GOV-1-1-e: Percentage of independent board members |
For any other CSRD improvement action, you can compute and publish corresponding metrics by extending the notebooks in the ESG data estate capability of Sustainability data solutions in Fabric.
You might want to add more information as evidence to substantiate the disclosure data. On the Improvement action detail page, select the Evidence tab, and then select Add evidence. On the side panel, select the evidence type, browse to select the file, and then select Add. For more information about adding evidence, go to Storing evidence.
Related information
- Overview of CSRD reporting regulations
- Explore CSRD disclosures
- Prepare data for CSRD disclosures
- Audit CSRD disclosure metrics data
