Create an analysis view
The analysis view is a way to view financial data for particular output needs based on criteria that are specified in a business. For an analysis view, G/L entries, G/L budget entries, and cash flow forecast entries are grouped by criteria such as the following:
G/L accounts
Period
Business units
Up to four dimensions
In other words, if an entry is posted to an account with one of the four dimensions selected for an analysis view, this entry information will be included in the analysis view as an analysis view entry.
The Analysis View Card page contains the criteria for creating the analysis view entries for the Analysis by Dimensions page. These criteria are based on your reporting requirements.
For example, if you want to report on sales by region and customer group, you must create an analysis view card with at least the following criteria:
G/L accounts
Region dimension
Customer group dimension

Watch this demonstration on how to create an analysis view.
Run an analysis by dimensions
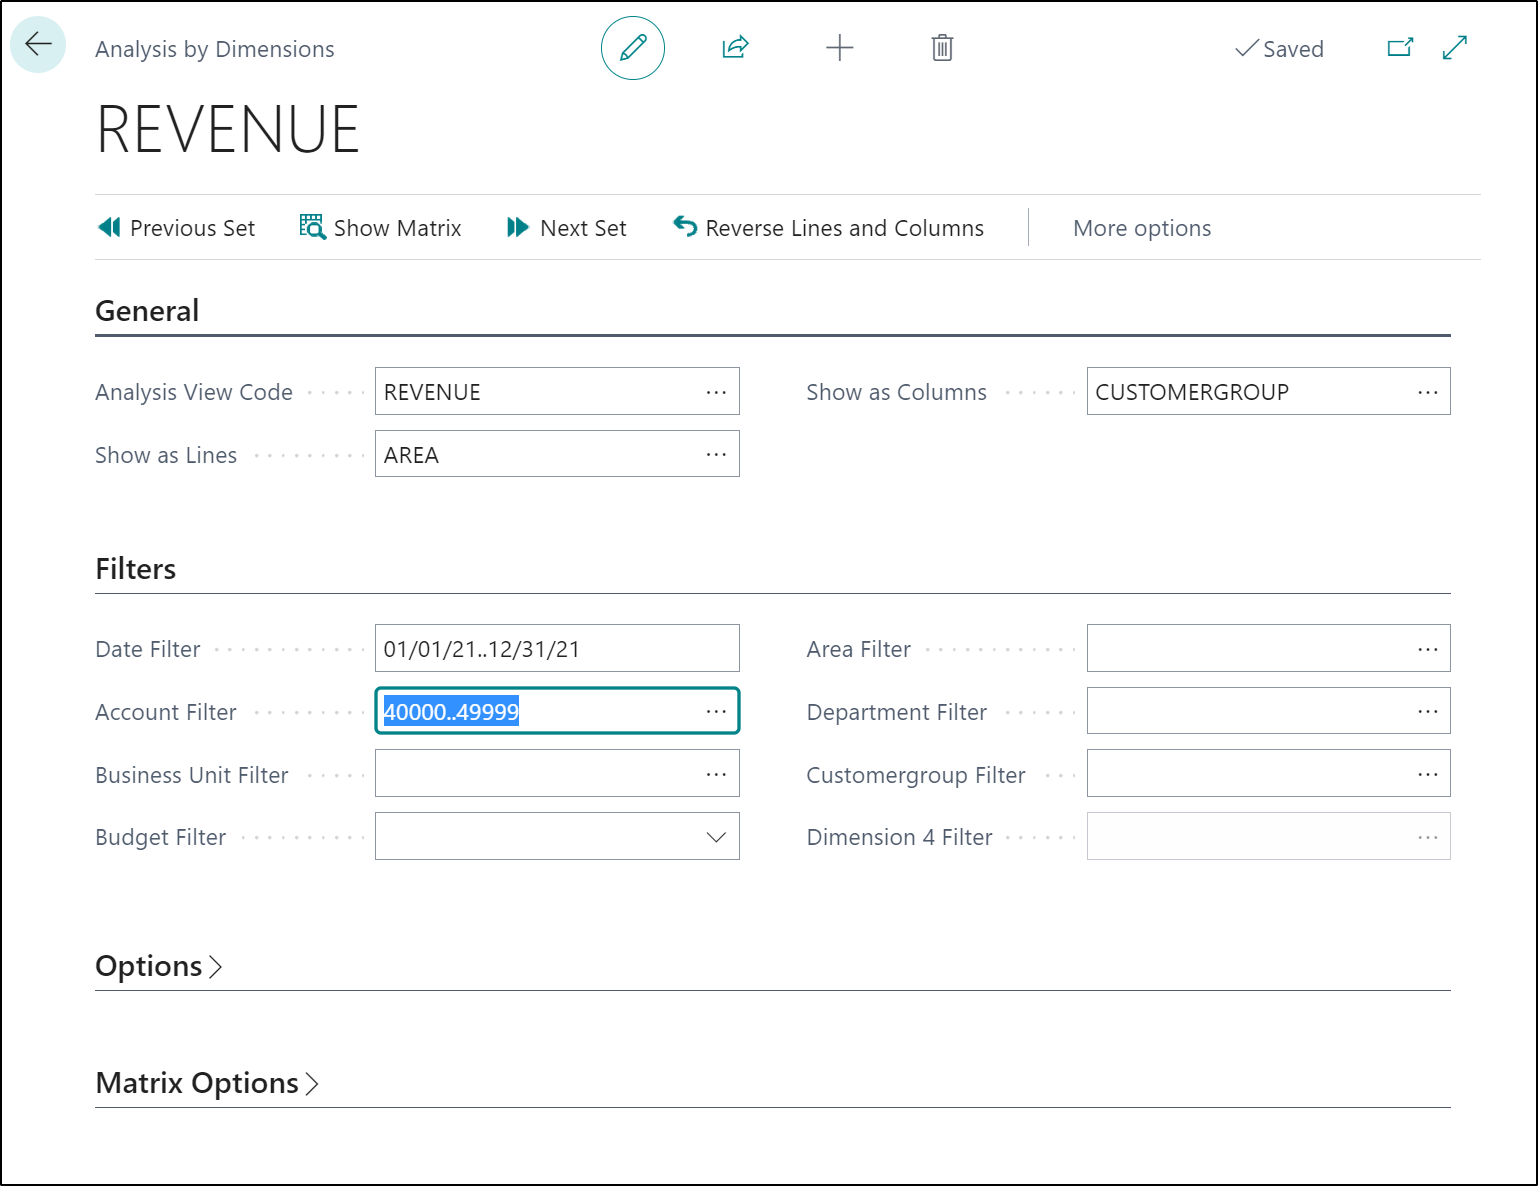
You can use the Analysis by Dimensions matrix to view the amounts in your general ledger by using the analysis views that you have already set up. To do so, fill in the Analysis by Dimensions page to define what will be shown in the matrix, and then select the Show Matrix action to view the matrix.
To run an analysis by dimension, follow these steps:
Select the Search for Page icon in the top-right corner of the page, enter analysis views, and then select the related link.
Select the relevant analysis view and then select the Analysis by Dimensions action.
On the Analysis by Dimensions page, fill in the fields to define which data is shown and how.
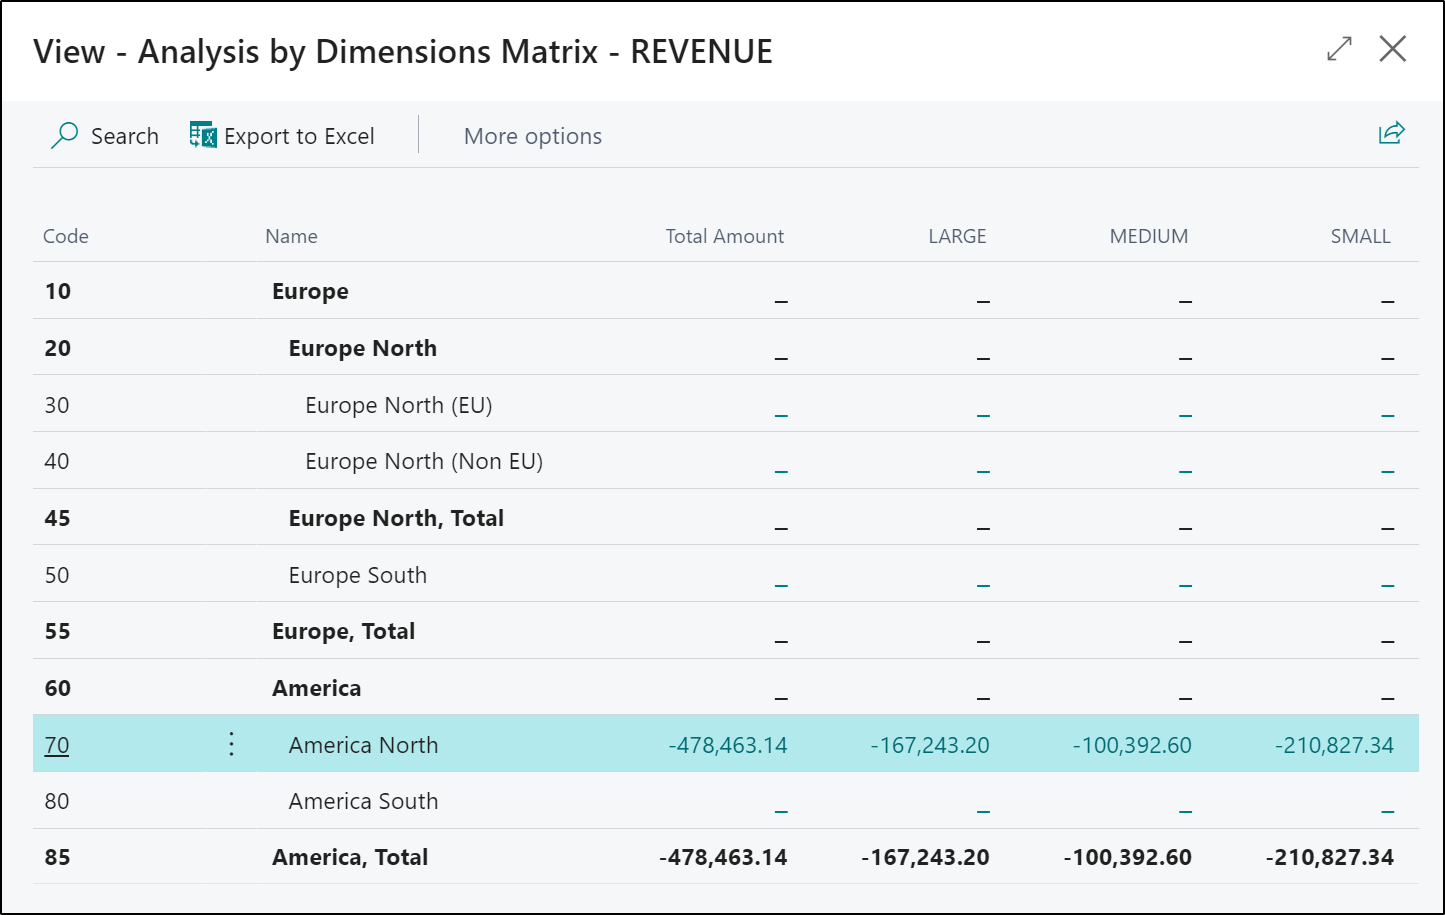
Select the Show Matrix action to open the respective matrix page for the defined analysis view.
To see a specification of an amount shown in the matrix page, select the amount to drill down.
The leftmost columns contain information based on what you have selected in the Show as Lines field in the header.
The rightmost columns contain information based on what you have selected in the Show as Columns field in the header.