Monitor Microsoft Tunnel
After installation of Microsoft Tunnel, you can view the server configuration and server health in the Microsoft Intune admin center.
Use the admin center UI
Sign in to Microsoft Intune admin center, and go to Tenant administration > Microsoft Tunnel Gateway > Health status.
Next, select a server and then open the Health check tab to view that servers health status metrics. By default, each metric uses predefined threshold values that determine the status. The following metrics support customization of these thresholds:
- CPU usage
- Memory usage
- Disk space usage
- Latency
Default values for server health metrics:
Last check-in – When the Tunnel Gateway server last checked in with Intune.
- Healthy – The last check-in was within the last five minutes.
- Unhealthy – The last check-in was over five minutes ago.
Current connections – The number of unique connections that were active at the last server check-in.
- Healthy – There were 4,990 or fewer connections
- Unhealthy – There were more than 4,990 active connections
Throughput – The megabits bits per second of traffic passing through the Tunnel Gateway NIC at the last server check-in.
CPU usage – The average CPU use by the Tunnel Gateway server every five minutes.
- Healthy - 95% or less
- Warning - 96% to 99%
- Unhealthy - 100% use
CPU cores – The number of CPU cores available on this server.
- Healthy - 4 or more cores
- Warning - 1, 2, or 3 cores
- Unhealthy -0 cores
Memory usage – The average memory use by the Tunnel Gateway server every 5 minutes.
- Healthy - 95% or less
- Warning - 96% to 99%
- Unhealthy - 100% use
Disk space usage – The amount of disk space that the Tunnel Gateway server uses.
- Healthy - Above 5 GB
- Warning - 3-5 GB
- Unhealthy - Below 3 GB
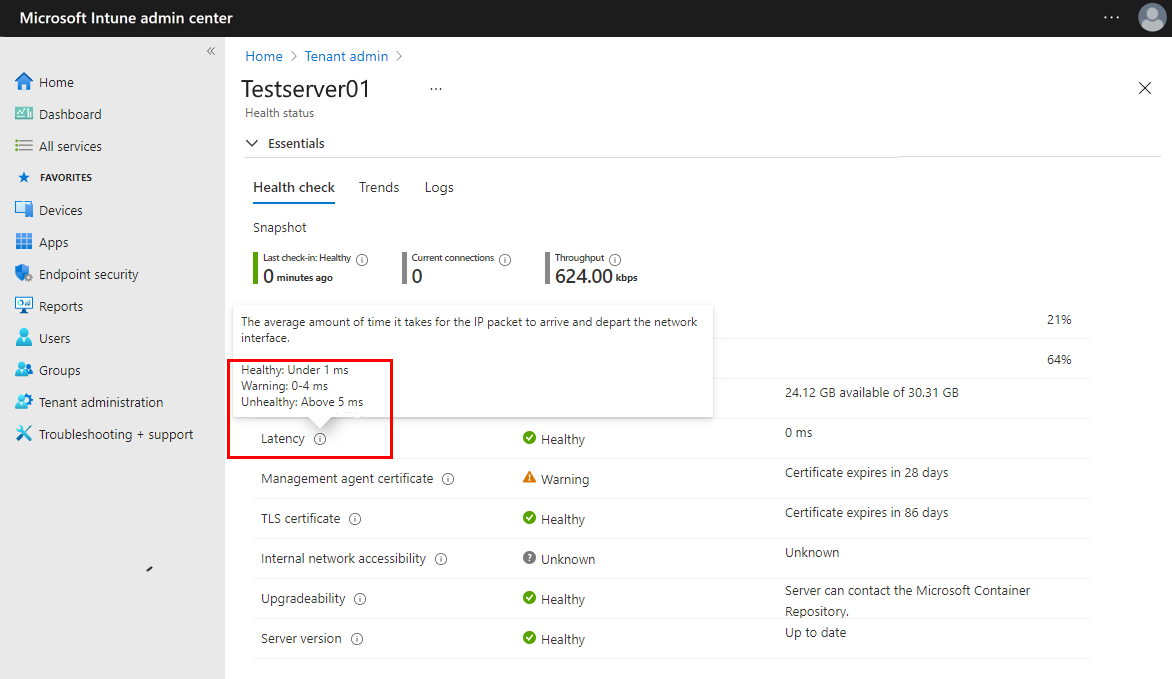
Latency – The average amount of time it takes for IP packets to arrive and then exit the network interface.
- Healthy - Less than 10 milliseconds
- Warning - 10 milliseconds to 20 milliseconds
- Unhealthy - More than 20 milliseconds
Management agent certificate – The management agent certificate is used by Tunnel Gateway to authenticate with Intune so it's important to renew it before it expires. However, it should automatically renew itself.
- Healthy - Certificate expiration is more than 30 days away.
- Warning - Certificate expiration is less than 30 days away.
- Unhealthy - Certificate is expired.
TLS certificate - The number of days until the Transport Layer Security (TLS) certificate that secures traffic between clients and the Tunnel Gateway server expires.
- Healthy - More than 30 days
- Warning - 30 days or less
- Unhealthy - The certificate is expired
TLS certificate revocation – The Tunnel Gateway attempts to check the revocation status of the Transport Layer Security (TLS) certificate using an Online Certificate Status Protocol (OCSP) or certificate revocation list (CRL) address as defined by the TLS certificate. This check requires the server to have access to the OCSP endpoint or CRL address as defined in the certificate.
- Healthy - The TLS certificate isn't revoked.
- Warning - Unable to check if the TLS certificate is revoked. Ensure the endpoints defined in the certificate can be accessed from the Tunnel server.
- Unhealthy - The TLS certificate is revoked.
Plan to replace a revoked TLS certificate.
To learn more about Online Certificate Status Protocol (OCSP), see Online Certificate Status Protocol at wikipedia.org.
Internal network accessibility – Status from the most recent check of the internal URL. You configure the URL as part of a Tunnel Site configuration.
- Healthy - The server can access the URL specified in the site properties.
- Unhealthy - The server can't access the URL specified in the site properties.
- Unknown - This status appears when you haven't set a URL in the site properties. This status doesn’t affect the overall status of the site.
Upgradeability – The ability of the server to contact the Microsoft Container Repository, which permits Tunnel Gateway to upgrade when versions become available.
- Healthy - Server hasn't contacted the Microsoft Container Repository within the last 5 minutes.
- Unhealthy - Server hasn't contacted the Microsoft Container Repository for more than 5 minutes.
Server version - The status of the Tunnel Gateway Server software, in relation to the most recent version.
- Healthy - Up to date with the most recent software version
- Warning - One version behind
- Unhealthy - Two or more versions behind, and out of support
When Server version isn’t Healthy, plan to install upgrades for Microsoft Tunnel.
Server container – Determines if the container hosting the Microsoft Tunnel server is running.
- Healthy - Server container status is healthy.
- Unhealthy - Server container status isn't healthy.
Server configuration – Determines if the server configuration is applied successfully to the Tunnel server from Microsoft Intune site settings.
- Healthy - Server configuration was successfully applied.
- Unhealthy - Server configuration couldn't be applied.
Server logs – Determines if logs have been uploaded to the server within the last 60 minutes.
- Healthy - Server logs were uploaded within the last 60 minutes.
- Unhealthy - Server logs were uploaded within the last 60 minutes.
Manage health status thresholds
You can customize the following Microsoft Tunnel health status metrics to change the thresholds each uses to report their status. Customizations are tenant-wide and apply to all Tunnel severs. The health check metrics you can customize include:
- CPU usage
- Memory usage
- Disk space usage
- Latency
To modify a metrics threshold value:
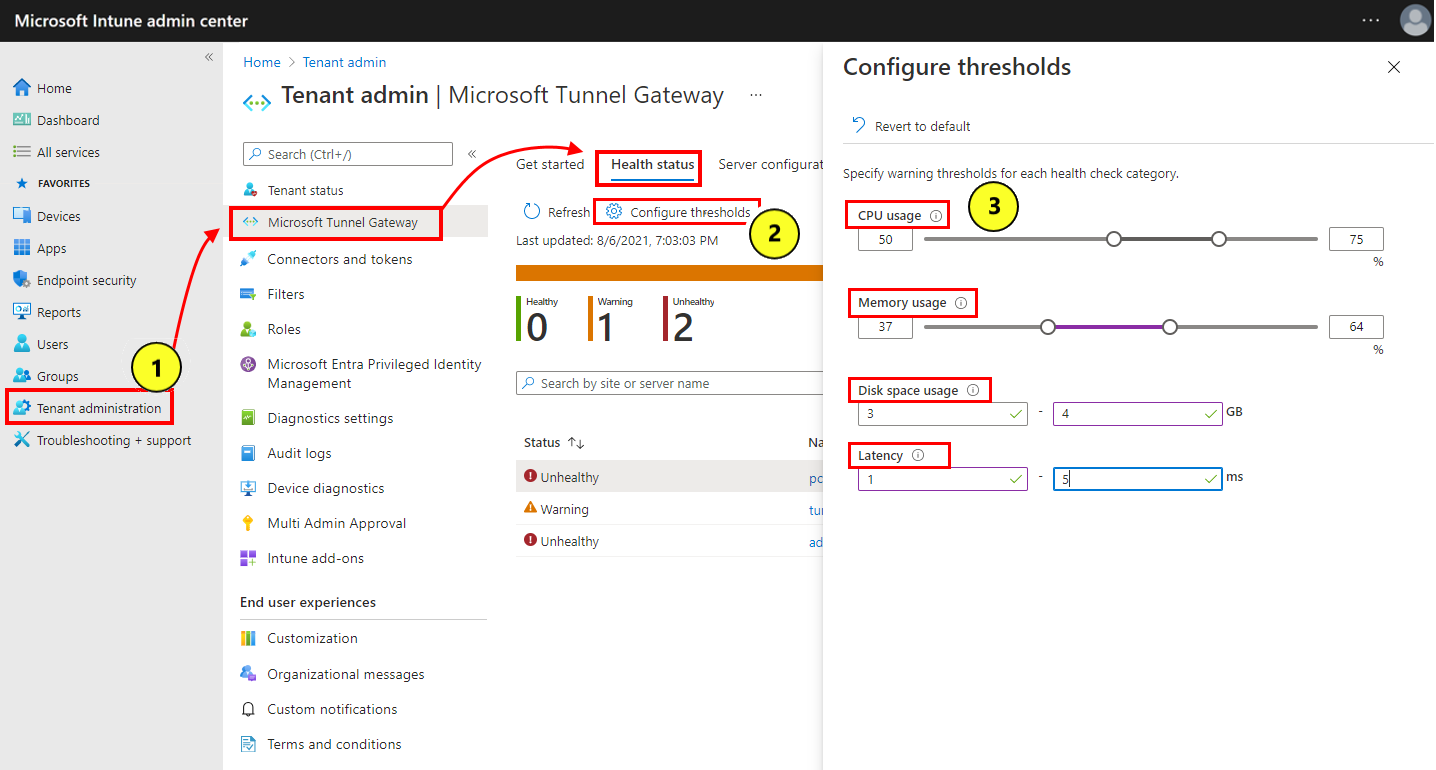
Sign in to Microsoft Intune admin center and go to Tenant administration > Microsoft Tunnel Gateway > Health status.
Select Configure thresholds.
On the Configured thresholds page, set new thresholds for each health check category that you want to customize.
- Threshold values apply to all servers at all sites.
- Select Revert to default to restore all thresholds back to their default values.
Select Save.
On the Health status pane, select Refresh to update the status of all servers based on the customized threshold values.
After you modify thresholds, the values on a servers Health check tab automatically update to reflect its status, based on the current thresholds.
Health status trends for Tunnel servers
View health status trends Microsoft Tunnel Gateway health metrics in the form of a chart. Data for the charts is averaged over a three-hour block and as such can be delayed up to three hours.
The health status trend charts are available for the following metrics:
- Connections
- CPU usage
- Disk space usage
- Memory usage
- Average latency
- Throughput
To view trend charts:
Sign in to the Microsoft Intune admin center.
Go to Tenant administration > Microsoft Tunnel Gateway > Health status > Select a server, and then select Trends
Use the Metric drop-down to select the metric chart you want to view.
Use mst-cli command-line tool
Use the mst-cli command-line tool to get information about the Microsoft Tunnel server. This file is added to the Linux server when the Microsoft Tunnel installs. The tool is located at: /usr/sbin/mst-cli.
For more information and command-line examples, see mst-cli command-line tool for Microsoft Tunnel.
View Microsoft Tunnel logs
Microsoft Tunnel logs information to the Linux server logs in the syslog format. To view log entries, use the journalctl -t command followed by one or more tags that are specific to Microsoft Tunnel entries:
mstunnel-agent: Display agent logs.
mstunnel_monitor: Display monitoring task logs.
ocserv - Display server logs.
ocserv-access - Display access logs.
By default, access logging is disabled. Enabling access logs can reduce performance, depending on the number of active connections and usage patterns on the server. Logging for DNS connections increases the verbosity of the logs, which can become noisy.
Access logs have the following format:
<Server timestamp><Server Name><ProcessID on Server><userId><deviceId><protocol><src IP and port><dst IP and port><bytes sent><bytes received><connection time in seconds>For example:- Feb 25 16:37:56 MSTunnelTest-VM ocserv-access[9528]: ACCESS_LOG,41150dc4-238x-4dwv-9q89-55e987f30c32,f5132455-ef2dd-225a-a693-afbbqed482dce,tcp,169.254.54.149:49462,10.88.0.5:80,112,60,10
Important
In ocserv-access, the deviceId value identifies the unique installation instance of Microsoft Defender that runs on a device, and does not identify either the Intune device ID or Microsoft Entra device ID. If Defender is uninstalled and then reinstalled on a device, a new instance for the DeviceId* is generated.
To enable access logging:
- set TRACE_SESSIONS=1 in /etc/mstunnel/env.sh
- set TRACE_SESSIONS=2 to include logging for DNS connections
- Run
mst-cli server restartto restart the server.
If access logs are too noisy, you can turn off DNS connection logging by setting TRACE_SESSIONS=1 and restarting the server.
OCSERV_TELEMETRY - Display telemetry details for connections to Tunnel.
Telemetry logs have the following format, with the values for bytes_in, bytes_out, and duration being used only for disconnect operations:
<operation><client_ip><server_ip><gateway_ip><assigned_ip><user_id><device_id><user_agent><bytes_in><bytes_out><duration>For example:- Oct 20 19:32:15 mstunnel ocserv[4806]: OCSERV_TELEMETRY,connect,31258,73.20.85.75,172.17.0.3,169.254.0.1,169.254.107.209,3780e1fc-3ac2-4268-a1fd-dd910ca8c13c, 5A683ECC-D909-4E5F-9C67-C0F595A4A70E,MobileAccess iOS 1.1.34040102
Important
In OCSERV_TELEMETRY, the deviceId value identifies the unique installation instance of Microsoft Defender that runs on a device, and does not identify either the Intune device ID or Microsoft Entra device ID. If Defender is uninstalled and then reinstalled on a device, a new instance for the DeviceId* is generated.
Command line examples for journalctl:
- To view information for only the tunnel server, run
journalctl -t ocserv. - To view the telemetry log, run
journalctl -t ocserv | grep TELEMETRY - To view information for all log options, you can run
journalctl -t ocserv -t ocserv-access -t mstunnel-agent -t mstunnel_monitor. - Add
-fto the command to display an active and continuing view of the log file. For example, to actively monitor ongoing processes for Microsoft Tunnel, runjournalctl -t mstunnel_monitor -f.
More options for journalctl:
journalctl -h– Display command help for journalctl.man journalctl– Display additional information.man journalctl.confDisplay information on configuration For more information about journalctl, see the documentation for the version of Linux that you use.
Easy upload of diagnostic logs for Tunnel servers
As a diagnostic aid, you can use a single click within the Intune admin center to have Intune enable, collect, and submit verbose logs from a Tunnel Gateway Server directly to Microsoft. These verbose logs are then available directly to Microsoft when you’re working with Microsoft to identify or resolve issues with a Tunnel server.
You can collect and upload verbose logs from an event before opening a support incident, or upon request should you already be working with Microsoft to examine a Tunnel servers operation.
To use this capability:
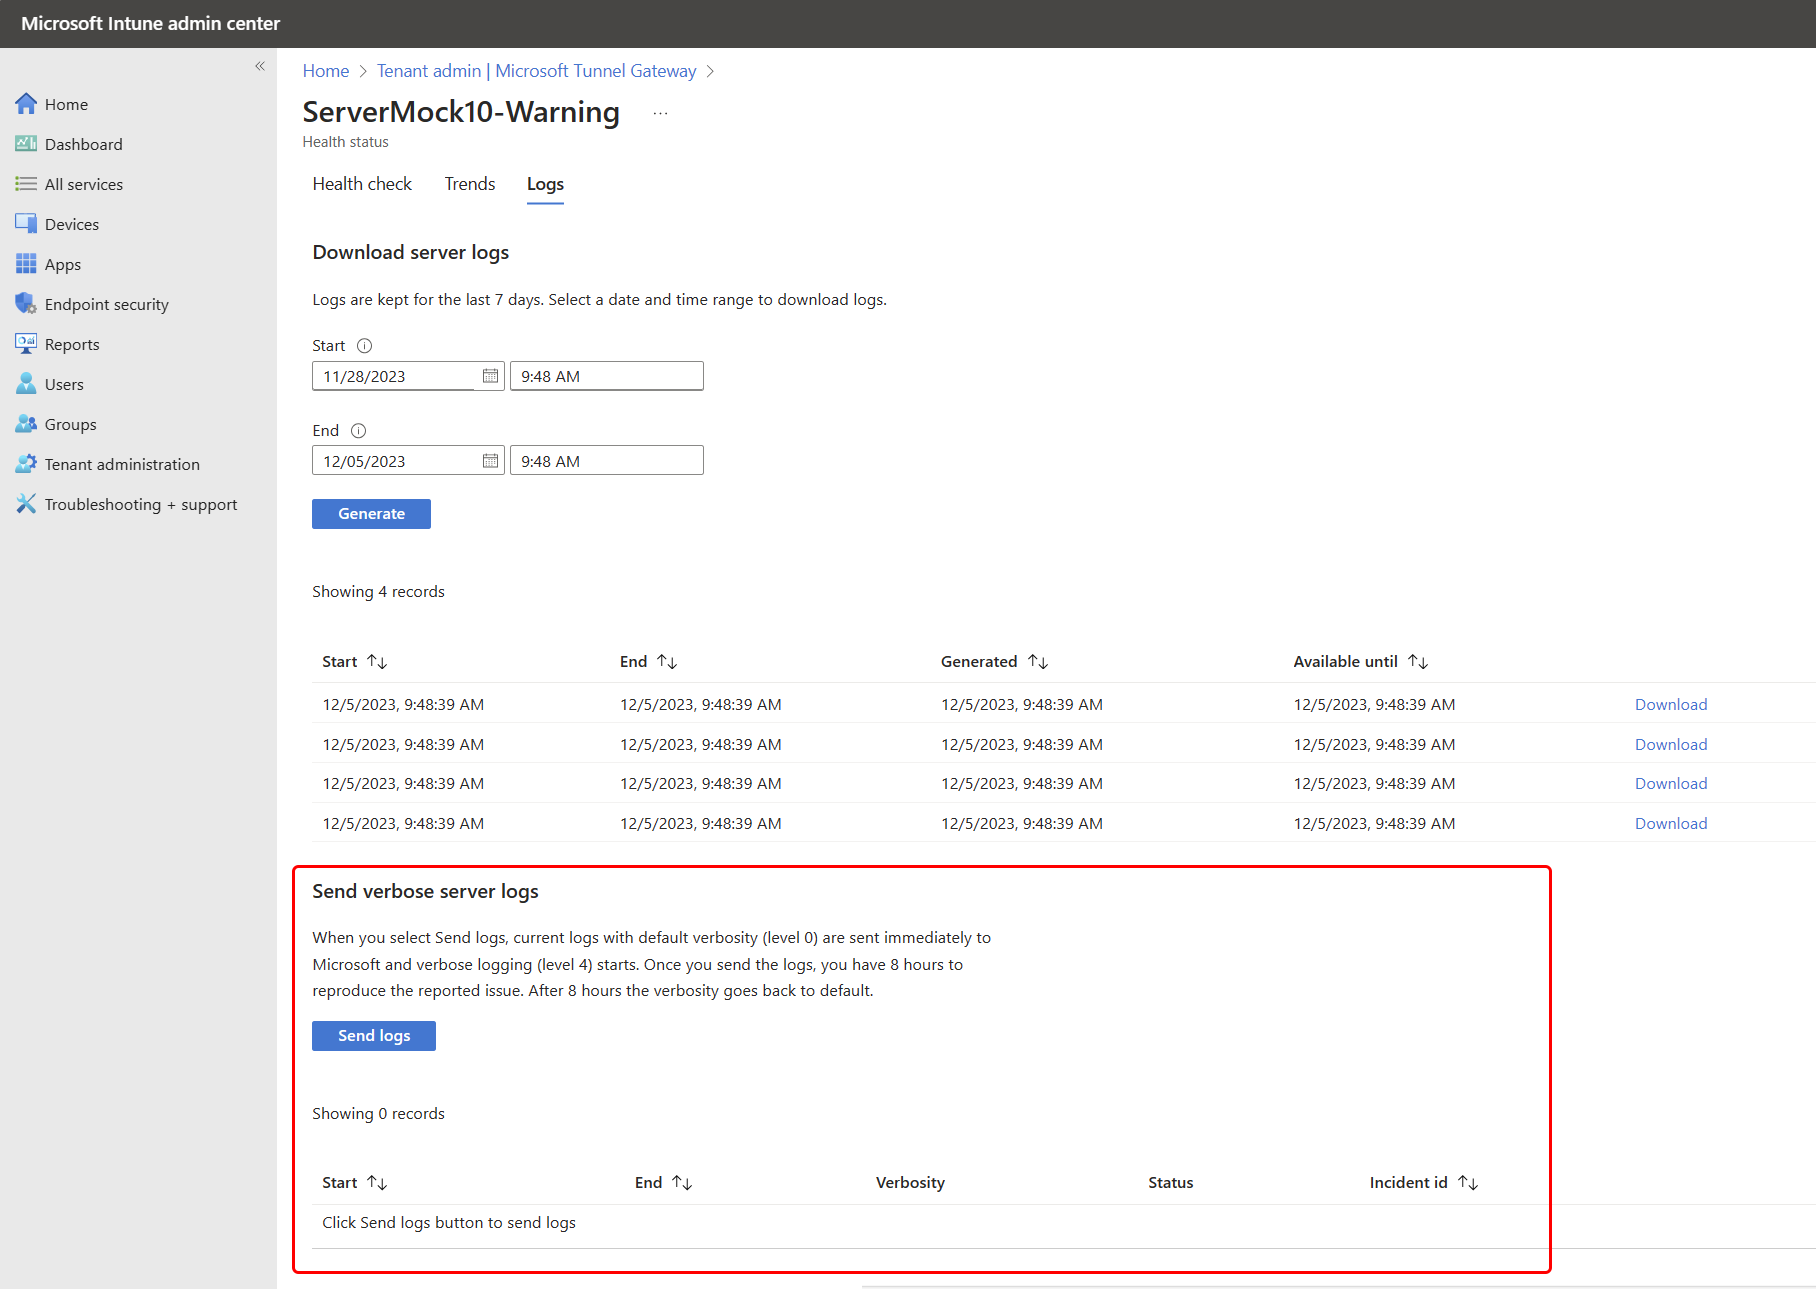
Open the Microsoft Intune admin center go to Tenant administration > Microsoft Tunnel Gateway > select a server > and then select the Logs tab.
On the Logs tab, locate the Send verbose server logs section and select Send logs.
When you select Send logs for a Tunnel server, the following process begins:
- First, Intune captures the current set of Tunnel server logs, and uploads them directly to Microsoft. These logs are collected using the servers current log verbosity level. By default, the server verbosity level is zero (0).
- Next, Intune enables a verbosity level of four (4) for the Tunnel server logs. This verbosity level of detail is collected for eight hours.
- During the eight hours of verbose log collection, the issue or operation being investigated should be reproduced to capture the verbose details in the logs.
- After eight hours, Intune collects a second set of the server logs that include the verbose details, and uploads them to Microsoft. At the time of upload, Intune also resets the Tunnel server logs to use the default verbosity level of zero (0). If you previously raised the verbosity level of the Server, after Intune resets the verbosity to zero you can then restore your custom verbosity level.
Each set of logs that Intune collects and uploads is identified as a separate set with the following details appearing in the admin center below the Send logs button:
- A start and end time of the log collection
- When the upload was generated
- The log sets verbosity level
- An Incident ID that can be used to identify that specific log set
After capturing an issue while running verbose log collection, you can provide the Incident id of that log set to Microsoft to help with investigation.
About log collection
- Intune doesn't stop or restart the Tunnel server to enable or disable verbose logging.
- The eight-hour verbose logging period can’t be extended or stopped early.
- You can use the Send logs process as often as needed to capture an issue with verbose logging. However, increased log verbosity adds strain to the Tunnel Server and isn’t recommended as a regular configuration.
- After verbose logging ends, the default verbosity level of zero is set for Tunnel server logs, regardless of previously set verbosity levels.
- The following logs are collected through this process:
- mstunnel-agent (Agent logs)
- mstunnel_monitor (Monitoring task logs)
- ocserv (Server logs)
The ocserv-access logs aren't collected or uploaded.
Known issues
The following are known issues for Microsoft Tunnel.
Server health
Clients can successfully use the Tunnel when Server health status shows as offline
Issue: On the Tunnel Health status tab, a server’s health status reports as offline indicating that it's disconnected, even though users can reach the tunnel server and connect to the organization’s resources.
Solution: To resolve this issue, you must reinstall Microsoft Tunnel, which re-enrolls the Tunnel server agent with Intune. To prevent this issue, install updates for the Tunnel agent and server soon after they're released. Use the Tunnel server health metrics in the Microsoft Intune admin center to monitor server health.
With Podman, you see “Error executing checkup” in the mstunnel_monitor log
Issue: Podman fails to identify or see the active containers are running, and reports “Error executing checkup” in the mstunnel_monitor log of the Tunnel server. The following are examples of the errors:
Agent:
Error executing Checkup
Error details
\tscript: 561 /usr/sbin/mst-cli
\t\tcommand: $ctr_cli exec $agent_name mstunnel checkup 2> >(FailLogger)
\tstack:
\t\t<> Checkup /usr/sbin/mst-cli Message: NA
\t\t<> MonitorServices /usr/sbin/mst-cli Message: Failure starting service mstunnel-agent
\t\t<> main /usr/sbin/mstunnel_monitor Message: NA
Server:
Error executing Checkup
Error details
\tscript: 649 /usr/sbin/mst-cli
\t\tcommand: $ctr_cli exec $agent_name mstunnel checkup 2> >(FailLogger)
\tstack:
\t\t<> Checkup /usr/sbin/mst-cli Message: NA
\t\t<> MonitorServices /usr/sbin/mst-cli Message: Failure starting service mstunnel-server
\t\t<> main /usr/sbin/mstunnel_monitor Message: NA
Solution: To resolve this issue, manually restart the Podman containers. Podman should then be able to identify the containers. If the problem persists, or returns, consider using cron to create a job that automatically restarts the containers when this issue is seen.
With Podman, you see System.DateTime errors in the mstunnel-agent log
Issue: When you use Podman, the mstunnel-agent log might contain errors similar to the following entries:
Failed to parse version-info.json for version information.System.Text.Json.JsonException: The JSON value could not be converted to System.DateTime
This issue occurs due to differences in formatting dates between Podman and Tunnel Agent. These errors don't indicate a fatal issue or prevent connectivity. Beginning with containers released after October 2022, the formatting issues should be resolved.
Solution: To resolve these issues, update the agent container (Podman or Docker) to the latest version. As new sources of these errors are discovered, we'll continue to fix them in subsequent version updates.
Connectivity to Tunnel
Devices fail to connect to the Tunnel server
Issue: Devices fail to connect to the server, and the Tunnel server ocserv log file contains an entry similar to the following entry: main: tun.c:655: Can't open /dev/net/tun: Operation not permitted
For guidance on viewing Tunnel logs, see View Microsoft Tunnel logs in this article.
Solution: Restart the server using mst-cli server restart after the Linux server reboots.
If this issue persists, consider automating the restart command by using the cron scheduling utility. See How to use cron on Linux at opensource.com.
Next steps
Feedback
Coming soon: Throughout 2024 we will be phasing out GitHub Issues as the feedback mechanism for content and replacing it with a new feedback system. For more information see: https://aka.ms/ContentUserFeedback.
Submit and view feedback for