Note
Access to this page requires authorization. You can try signing in or changing directories.
Access to this page requires authorization. You can try changing directories.
The Microsoft 365 apps Active users provides details about how many product licenses people in your organization use. You can drill into the report for information about which users are using what products. This report helps administrators identify underutilized products or users who might need extra training or information.
For general information about usage reports in the Microsoft 365 admin center, and to see a list of all available reports, see Microsoft 365 admin center usage reports overview.
View the Microsoft 365 apps Active users report in the Microsoft 365 admin center
For information about the roles needed to view usage reports, see "Before you begin" in Microsoft 365 admin center usage reports overview
- Go to the Microsoft 365 admin center.
- In the navigation menu, select Reports. If you don't see Reports, select Show all, and then select Reports.
- Select Usage.
- On the Usage page, under Reports, select Microsoft 365 apps, and then select the Active users tab.
Interpret the Microsoft 365 apps Active users report
The report displays trends over the last 7, 30, 90, or 180 days. However, if you select a particular day in the report, the table shows data for up to 28 days from the current date, not the date the report generated. The data in each report usually covers up to the last 24 to 48 hours.
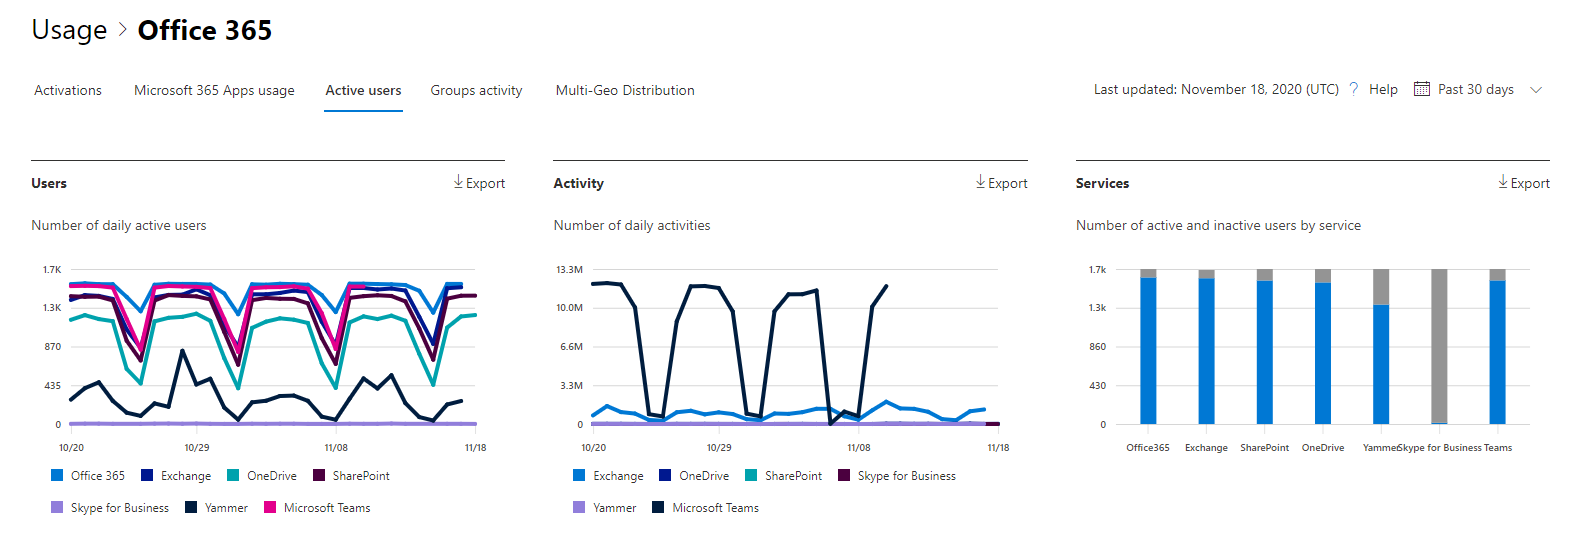
The Users chart shows daily active users in the reporting period separated by product. On the Users chart, the X axis shows the selected reporting time period and the Y axis displays the daily active users separated and color coded by license type.
The Activity chart shows you daily activity count in the reporting period separated by product. On the Activity chart, the X axis shows the selected reporting time period and the Y axis displays the daily activity count separated and color coded by license type.
The Services chart shows the count of users by activity type and service. On the Services activity chart, the X axis displays the individual services your users are enabled for in the given time period, and the Y axis is the count of users by activity status, color coded by activity status.
You can filter the series you see on each chart by selecting an item in the legend. Changing this selection doesn't change the info in the grid table.
To add or remove columns from the report, select Choose columns.
Note
If your subscription is operated by 21Vianet in China, you don't see data for Viva Engage.
To export the report data into an Excel .csv file, select Export. This action exports the usage data of all users and enables you to do simple sorting, filtering, and searching for further analysis.
The table displays a breakdown of the user activities at the per-user level.
| Metric | Definition |
|---|---|
| Username | The identifier of the user. |
| Last active date for Exchange | The date the user last used Exchange. |
| Last active date for OneDrive | The date the user last used OneDrive. |
| Last active date for SharePoint | The date the user last used SharePoint. |
| Last active date for Viva Engage | The date the user last used Viva Engage. |
| Last active date for Microsoft Teams | The date the user last used Microsoft Teams. |
| Exchange licenses | Whether an Exchange license is assigned to the user. |
| OneDrive licenses | Whether a OneDrive license is assigned to the user. |
| SharePoint licenses | Whether a Viva Engage license is assigned to the user. |
| Viva Engage licenses | Whether a OneDrive license is assigned to the user. |
| Microsoft Teams licenses | Whether a Microsoft Teams license is assigned to the user. |
| Deleted date | The date the user was deleted. |
| License assign date for Exchange | The date an Exchange license was assigned to the user. |
| License assign date for OneDrive | The date a OneDrive license was assigned to the user. |
| License assign date for SharePoint | The date a SharePoint license was assigned to the user. |
| License assign date for Viva Engage | The date a Viva Engage Exchange license was assigned to the user. |
| License assign date for Microsoft Teams | The date a Microsoft Teams license was assigned to the user. |
Note
By default, user-specific information like usernames, display names, groups, and sites is hidden in usage reports. To learn how to display this information in usage reports, see Show user, group, or site details in usage reports.