Note
Access to this page requires authorization. You can try signing in or changing directories.
Access to this page requires authorization. You can try changing directories.
 This feature requires your organization to have one Teams Premium license assigned. Learn more about Teams Premium.
The Advanced Virtual Appointments activity report in the Microsoft Teams admin center provides user activity information for advanced Virtual Appointments capabilities that are available with Teams Premium.
To view the report, you must be a Teams admin, Global reader, or Report reader, and your organization must be using advanced Virtual Appointments capabilities.
The report shows usage information for the following features.
| Feature | Description |
|---|---|
| SMS text notifications | Send appointment reminders and confirmations to external attendees on their mobile devices. |
| On-demand appointments | Service and manage on-demand virtual appointments. |
| Queue | Monitor scheduled and on-demand appointments, with status updates in real time. |
Use this report to gain insight into overall user activity and usage per feature in your organization. This information can help you analyze trends, identify which users are using these advanced features the most, and measure business value.
View the report
There are two ways to access and view the report in the Teams admin center.
- Through the Advanced Virtual Appointments usage card in the dashboard
- Directly by choosing the Advanced Virtual Appointments activity report in Analytics & reports > Usage reports.
The Advanced Virtual Appointments usage card
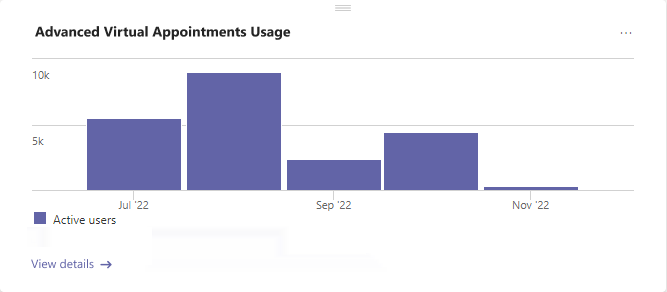
In the dashboard of the Teams admin center, go to the Advanced Virtual Appointments usage card. Here, you get an at-a-glance view of the aggregate number of active users across all features, by month.
Select View details to view the report.
The Advanced Virtual Appointments activity report
- In the left navigation of the Teams admin center, choose Analytics & reports > Usage reports. On the View reports tab, under Report, select Advanced Virtual Appointments activity.
- Under Date range, select a date range of 7 days, 30 days, or 90 days. Then, choose Run report.
Interpret the report
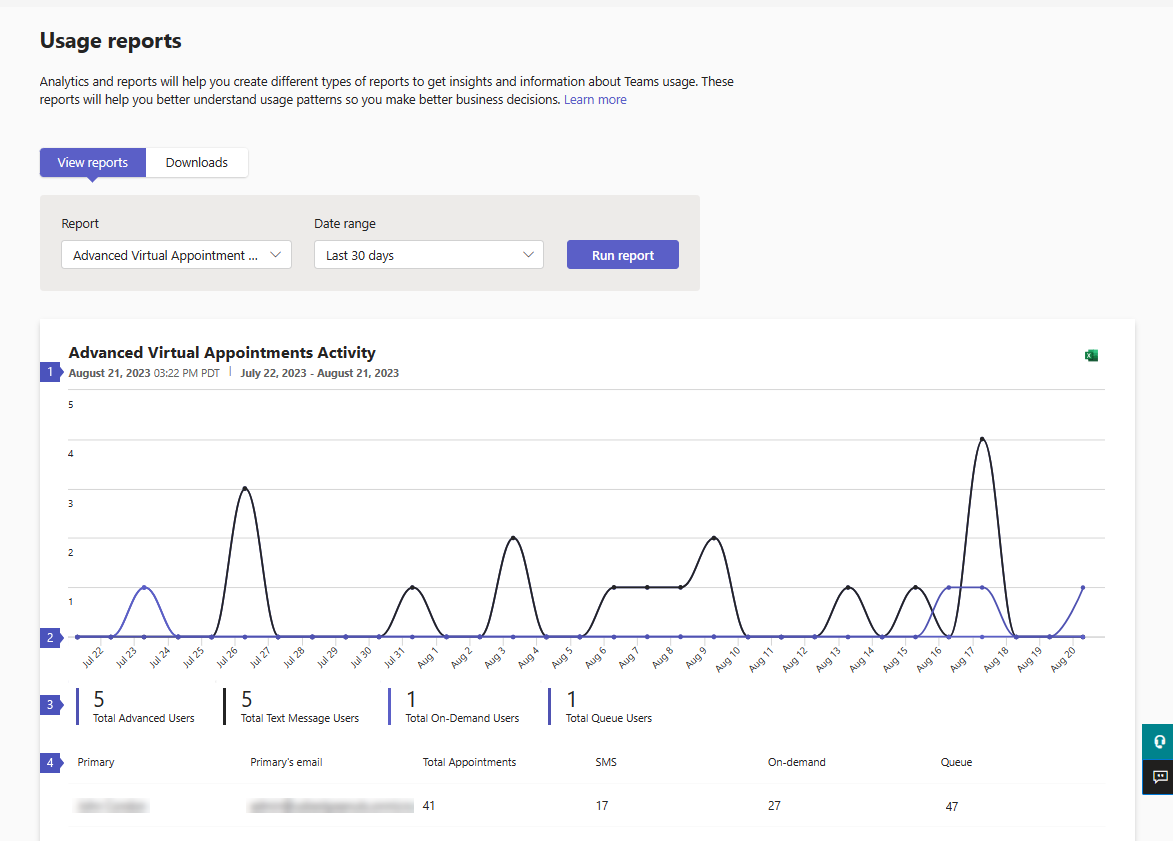
The graph provides an overview of feature usage. It changes depending on the date range you select. The table shows feature usage by individual users.
| Callout | Description |
|---|---|
| 1 | Each report has a date for when the report was generated. The reports usually reflect a 24 to 48-hour latency from time of activity. |
| 2 | The X axis is the selected date range for the report. The Y axis is the number of active users per feature. Hover over a dot on a given date to see the number of users using that feature on that date. |
| 3 | You can filter what you see on the chart by selecting an item. For example, select Total Text Message Users, Total On-Demand Users, or Total Queue Users, to see only the info related to each one. Changing this selection doesn’t change the information in the table. |
| 4 | This table shows detailed usage information for each user in your organization during the selected date range.
|

