Microsoft Teams Virtual Appointments usage report
 This feature requires a Teams Premium or a Teams EHR connector license.
The Virtual Appointments usage report in the Microsoft Teams admin center gives you an overview of Teams Virtual Appointments activity in your organization. You can view detailed activity for virtual appointments scheduled through the Bookings app and the Microsoft Teams Electronic Health Record (EHR) connector.
To view the report, you must be Teams admin, Global reader, or Report reader.
The report contains the following tabs. The information you see in the report depends on the license you have.
| Tab | Description |
|---|---|
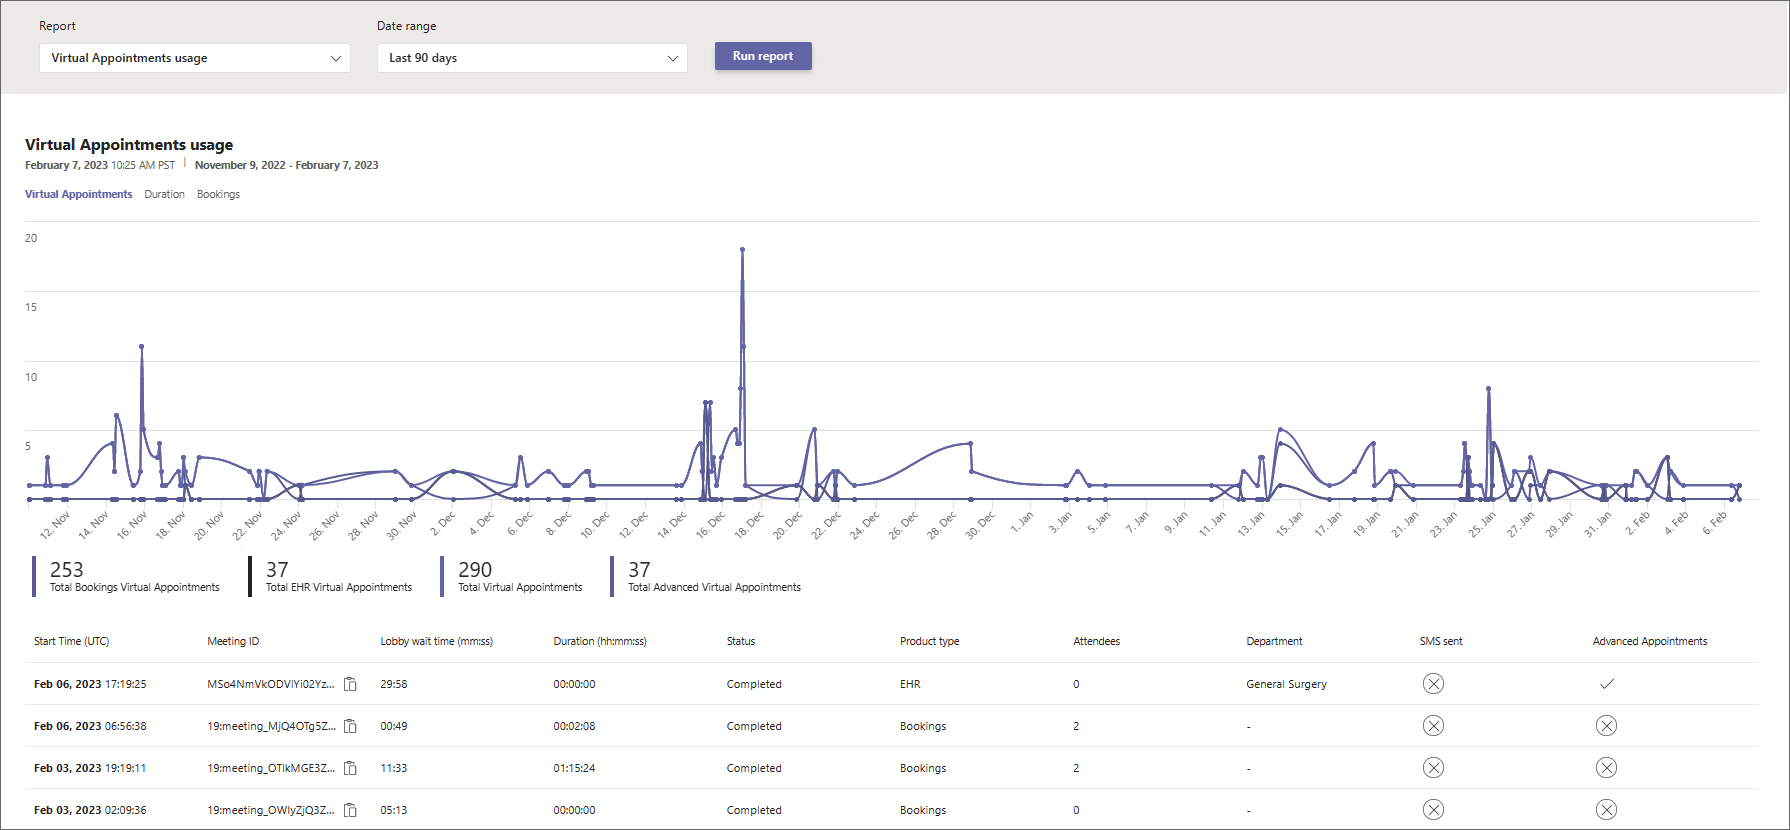
| Virtual Appointments | Shows the total number of virtual appointments, with a breakdown of the number of Bookings appointments, Teams EHR-integrated meetings conducted from your EHR system, and premium appointments. |
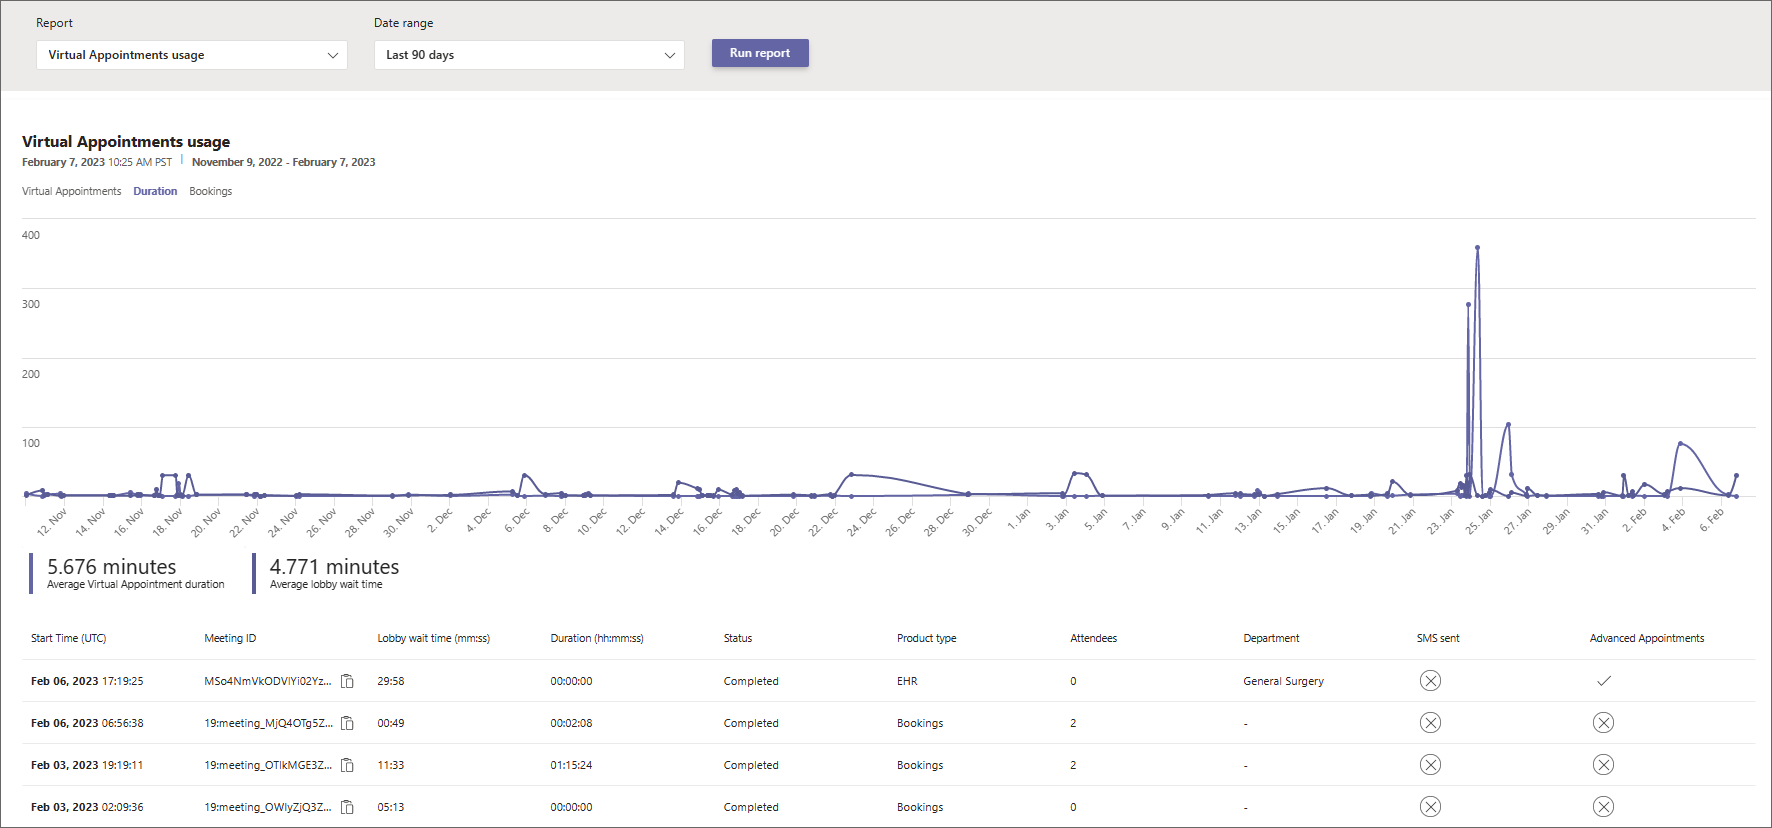
| Duration | Shows the average duration of appointments and average lobby wait time of participants. |
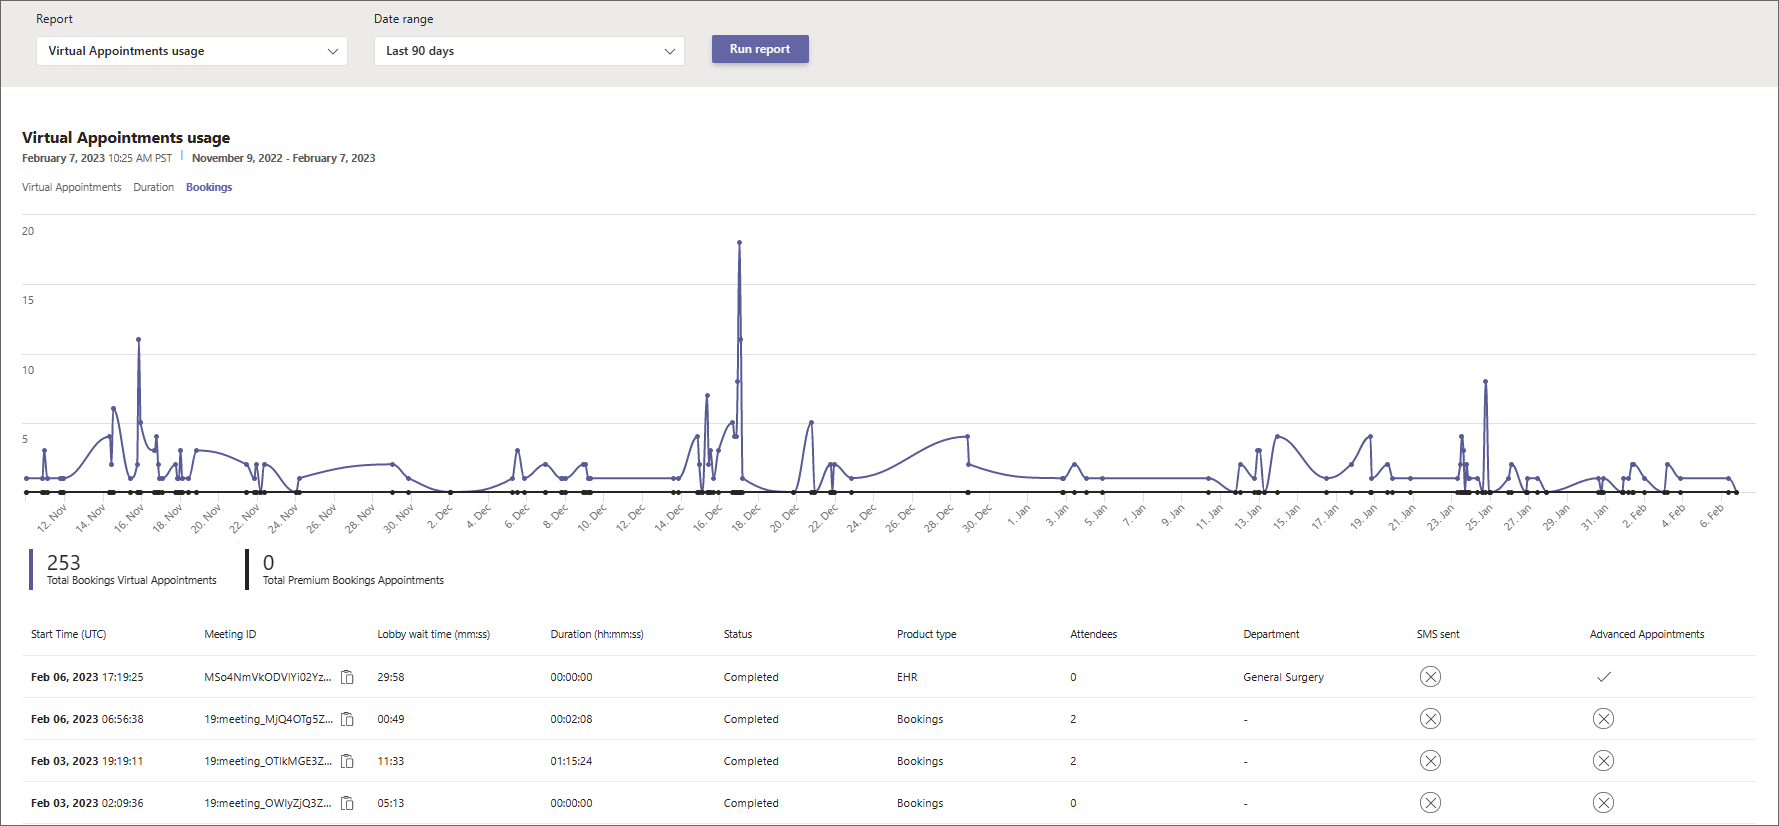
| Bookings | Shows the number of Bookings appointments, with a breakdown of the number of premium appointments. |
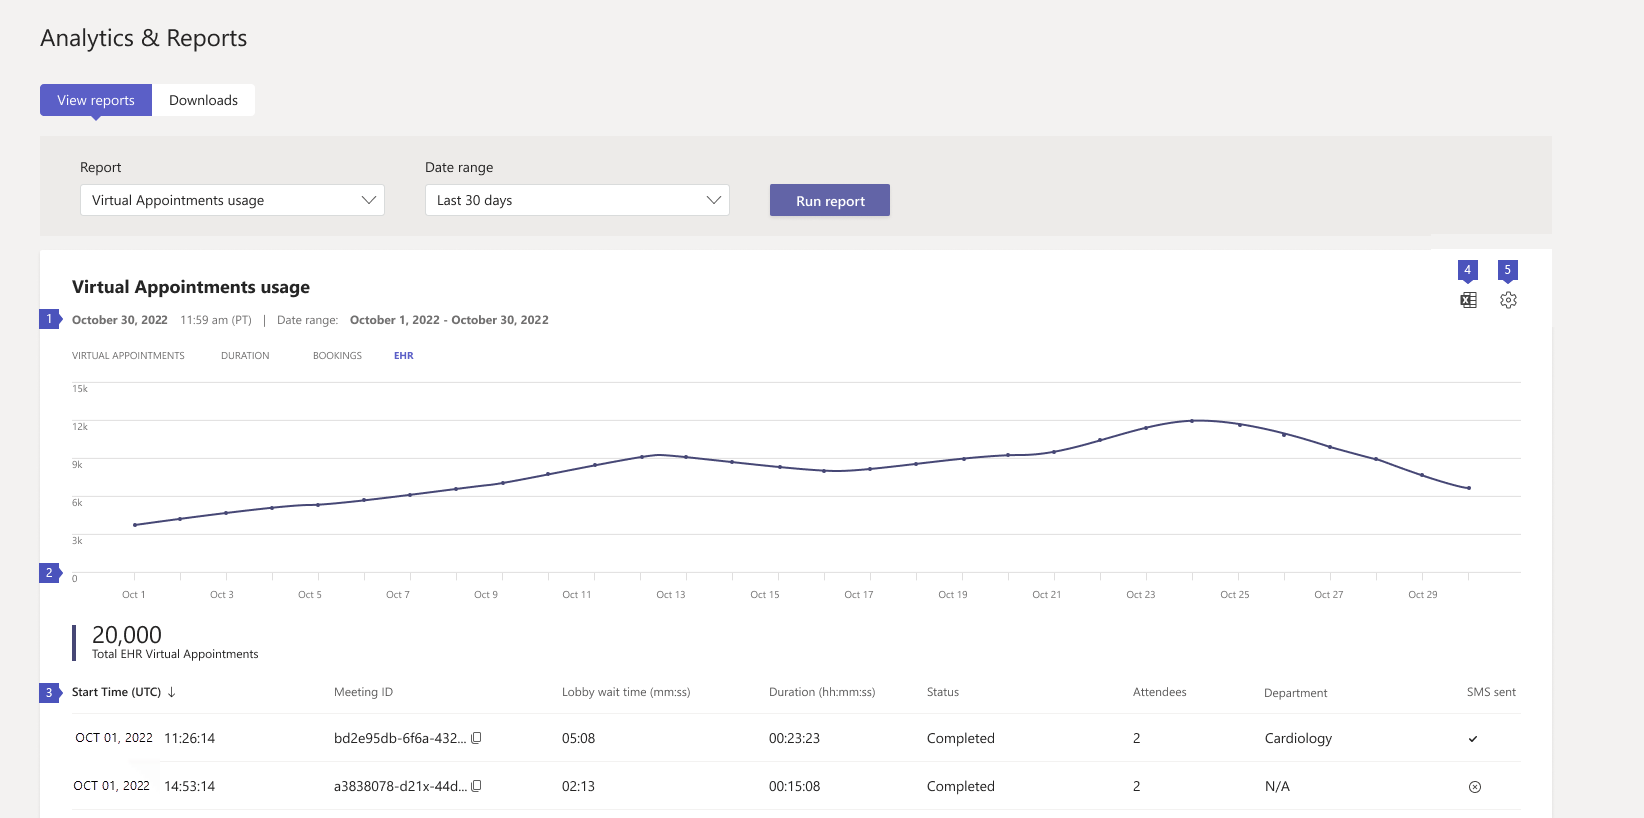
| EHR | Shows the number of Teams EHR-integrated appointments conducted from your EHR system. |
Note
Advanced appointments are appointments that use at least one premium Virtual Appointments capability available in Teams Premium. For more analytics on advanced Virtual Appointments usage, see the Advanced Virtual Appointments activity report.
Use this report to gain insight into virtual appointment activity and trends in your organization. The information can help you optimize Virtual Appointments to deliver better business outcomes.
View the report
There are two ways to access and view the report in the Teams admin center.
- Through the Virtual Appointments usage card in the dashboard
- Directly by choosing Virtual Appointments usage in Analytics & reports > Usage reports.
The Virtual Appointments usage card
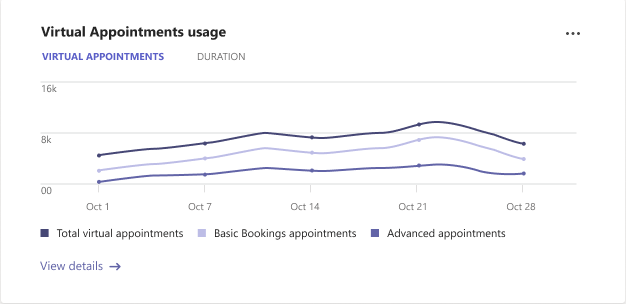
In the dashboard of the Teams admin center, go to the Virtual Appointments usage card. Here, you get an at-a-glance view of Virtual Appointments usage across your organization, including Bookings and Teams EHR-integrated appointments.
Select View details to view the report.
The Virtual Appointments usage report
- In the left navigation of the Teams admin center, choose Analytics & reports > Usage reports. On the View reports tab, under Report, select Virtual Appointments usage.
- Under Date range, select a date range of 7 days, 30 days, or 90 days. Then, choose Run report.
Note
By default, Virtual Appointments analytics is on and the report is available. By using this report, you give Microsoft permission to collect data about virtual appointments in your organization. For information about our data retention policies, see Data retention, deletion, and destruction in Microsoft 365.
If you want to turn off the report for your organization, you can do so in Settings in the upper-right corner of the page. This setting may take between 0 (zero) to 2 hours to take effect after you change it.
Interpret the report
Here's what you'll see on each tab of the report.
Virtual Appointments
The graphs you see here depend on the license you have.
| Callout | Description |
|---|---|
| 1 | Each report has a date for when the report was generated. The reports usually reflect a 24 to 48-hour latency from time of activity. |
| 2 | The X axis is the selected date range for the report. The Y axis is the number of appointments. Hover over the dot on a given date to see the number of appointments on that date. |
| 3 | These numbers represent the total number of appointments per product for the date range. You can filter what you see on the chart by selecting an item. For example, select Basic Bookings appointments or Advanced appointments to see only the info related to each one. Changing this selection doesn’t change the information in the table. |
| 4 | The table gives you detailed information about each appointment that took place during the selected date range.
|
| 5 | You can export the report to a CSV file for offline analysis. Select Export to Excel, and then on the Downloads tab, choose Download to download the report when it's ready. |
| 6 | Select Settings to open the Virtual Appointments analytics pane. From here, you can turn off or turn on Virtual Appointments analytics for your organization. |
Duration
| Callout | Description |
|---|---|
| 1 | Each report has a date for when the report was generated. The reports usually reflect a 24 to 48-hour latency from time of activity. |
| 2 | The X axis is the selected date range for the report. The Y axis is the number of minutes. Hover over the dot on a given date to see the average appointment duration or average lobby wait time for a given date. |
| 3 | You can filter what you see on the chart by selecting an item in the legend. For example, select Average Virtual Appointment duration or Average lobby wait time to see only the info related to each one. Changing this selection doesn’t change the information in the table. |
| 4 | The table gives you detailed information about each appointment that took place during the selected date range.
|
| 5 | You can export the report to a CSV file for offline analysis. Select Export to Excel, and then on the Downloads tab, choose Download to download the report when it's ready. |
| 6 | Select Settings to open the Virtual Appointments analytics pane. From here, you can turn off or turn on Virtual Appointments analytics for your organization. |
Bookings
This tab shows appointments scheduled through Bookings.
| Callout | Description |
|---|---|
| 1 | Each report has a date for when the report was generated. The reports usually reflect a 24 to 48-hour latency from time of activity. |
| 2 | The X axis is the selected date range for the report. The Y axis is the number of Bookings appointments. Hover over the dot on a given date to see the number of Bookings appointments that occurred on that date. |
| 3 | You can filter what you see on the chart by selecting an item in the legend. For example, select Total Bookings appointments or Advanced Bookings appointments to see only the info related to each one. Changing this selection doesn’t change the information in the table. |
| 4 | The table gives you detailed information about each appointment that took place during the selected date range.
|
| 5 | You can export the report to a CSV file for offline analysis. Select Export to Excel, and then on the Downloads tab, choose Download to download the report when it's ready. |
| 6 | Select Settings to open the Virtual Appointments analytics pane. From here, you can turn off or turn on Virtual Appointments analytics for your organization. |
EHR
You'll see this tab if you have a license that includes the Teams EHR connector. To learn more, see Integration into Oracle Health EHR or Integration into Epic EHR.
| Callout | Description |
|---|---|
| 1 | Each report has a date for when the report was generated. The reports usually reflect a 24 to 48-hour latency from time of activity. |
| 2 | The X axis is the selected date range for the report. The Y axis is the number of EHR appointments. Hover over the dot on a given date to see the number of EHR appointments on that date. |
| 3 | The table gives you detailed information about each appointment that took place during the selected date range.
|
| 4 | You can export the report to a CSV file for offline analysis. Select Export to Excel, and then on the Downloads tab, choose Download to download the report when it's ready. |
| 5 | Select Settings to open the Virtual Appointments analytics pane. From here, you can turn off or turn on Virtual Appointments analytics for your organization. |
