Microsoft Teams frontline usage report
Overview
You can track usage for all your frontline locations deployed through the deploy frontline dynamic teams experience from the usage dashboard on the Manage frontline teams page in the Teams admin center.
From the usage dashboard, you can:
- Run and view the frontline usage report. The report shows usage data for active users on Microsoft Teams for each of your frontline locations. You can filter the table to the date range for which you want to see usage data, and then export this data to a CSV file for analysis.
- See the progress of overall frontline deployment tasks on the Deployment task progress card.
Access the usage dashboard
In the Teams admin center, choose Frontline deployment > Manage frontline teams. From here, there are two ways to get to the usage dashboard.
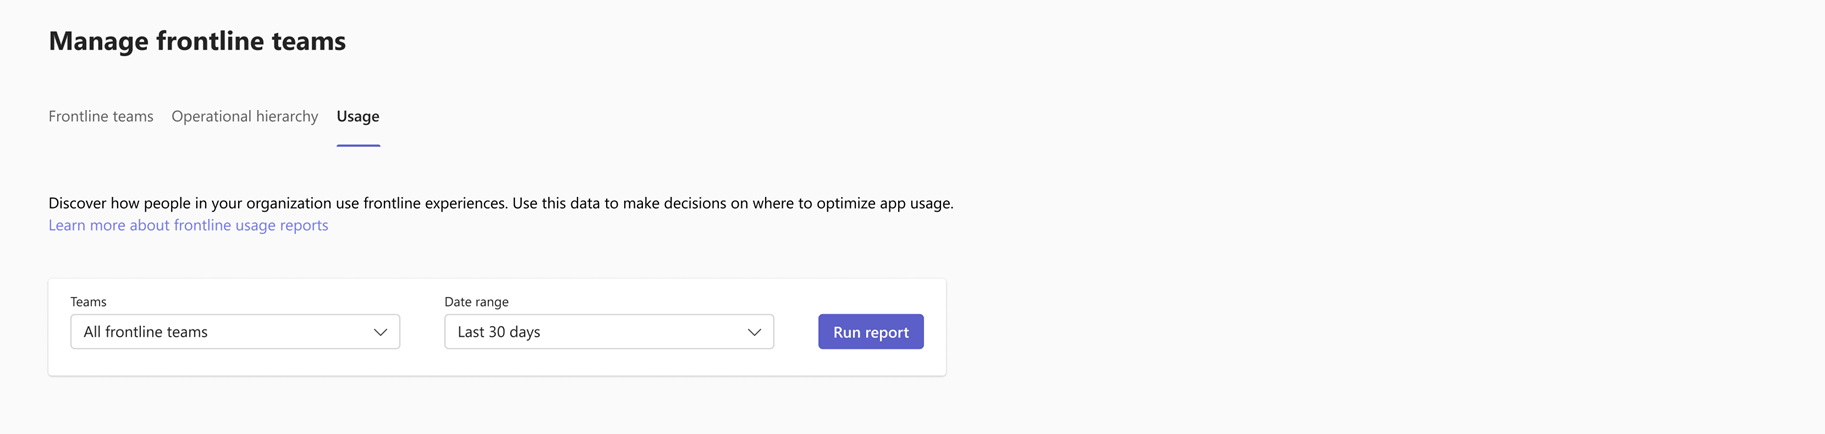
Directly, by going to the Usage tab.
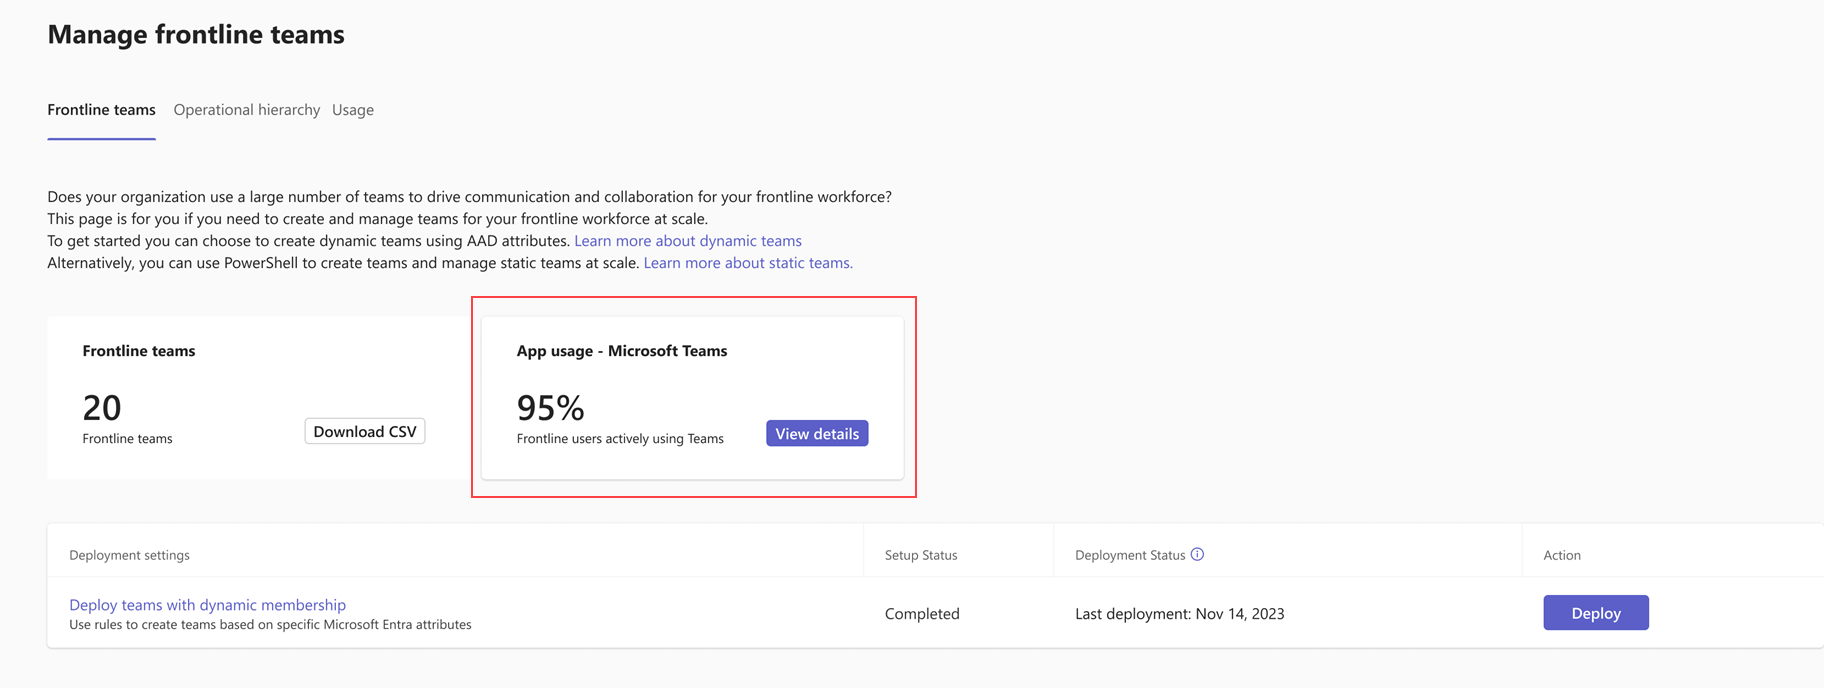
Through the App usage - Microsoft Teams card. If you leave the Usage tab before your report is generated, you can come back to the Manage frontline teams page to view your report later. When your report finishes loading, the card shows the overall percentage of users across all your frontline teams that have been active on Teams in the last 30 days. Choose View details to go to the dashboard and view your report.


To view usage reports in the dashboard, make sure the Display concealed user, group, and site names in all reports setting is turned on in the Microsoft 365 admin center. Otherwise, you'll see a "User details have been hidden by your Microsoft 365 Reports privacy setting" message.
You must be a Global Administrator to turn on this setting.
- In the Microsoft 365 admin center, go to Settings > Org Settings, and then on the Services tab, choose Reports.
- Select the Display concealed user, group, and site names in all reports check box, and then choose Save.
The frontline usage report
Run the report
On the Usage tab, under Teams, select which teams you want in your usage report. Currently, the only option is All frontline teams, which represents all teams deployed through the deploy frontline dynamic teams experience in the Teams admin center. We’ll be adding more options in the future.
Under Date range, select the date range for which you want to see data. You can choose from the last 7 days, 30 days, 90 days, or 180 days. Then, choose Run report.
Important
It might take several minutes to load the first report of the day. After the report is loaded, it’s available to view for the next 24 hours. Usage data may take up to 72 hours to update.
Interpret the report
The table shows usage data for your frontline teams during the date range you selected.

Each row in the table represents a team.
| Item | Description |
|---|---|
| Team name | The name of the team. |
| Team ID | The ID of the team. |
| Total members | The total number of users on each team. |
| Active users | The number of active users on each team. Users are considered active if they signed in to Teams one time during the selected date range. |
| Last activity date | The last date on which the user signed in to Teams. |
You can:
- Select the Team members or Active users column header to sort the rows from highest to lowest or vice versa.
- Select the Last activity date column header to sort the rows from latest to earliest or vice versa.
- Add or remove columns in the table by selecting Edit columns (the gear icon) in the upper-right corner of the table.
- Export the data to a CSV file for further analysis by selecting the Export to Excel icon in the upper-right corner of the table.
Important
If you haven't deployed any frontline locations through the deploy frontline dynamic teams experience in the Teams admin center, you won't see any teams.
Deployment task progress card
The Deployment task progress card on the usage dashboard shows you which of the following tasks for your overall frontline deployment are completed, in progress, and not started.
- Map frontline attributes
- Deploy frontline teams
- Set up operational hierarchy
- Deploy Shifts
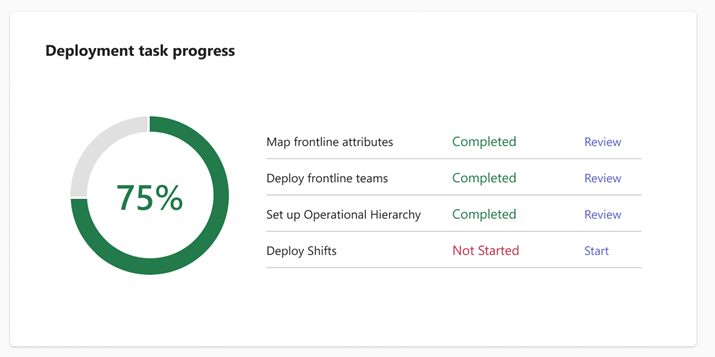
For your completed tasks, you can select Review to manage setup. For tasks that aren't started, you can choose Start to begin the task. The progress indicator shows the percentage of total tasks that are completed.
Troubleshoot errors
If an error occurs when retrieving data, select Try Again on the data table or refresh the page.