Host firewall reporting in Microsoft Defender for Endpoint
Applies to:
- Microsoft Defender for Endpoint Plan 1
- Microsoft Defender for Endpoint Plan 2
- Microsoft Defender XDR
If you're a Global or security administrator, you can now host firewall reporting to the Microsoft Defender portal. This feature enables you to view Windows firewall reporting from a centralized location.
What do you need to know before you begin?
Your devices must be running Windows 10 or later, or Windows Server 2012 R2 or later. For Windows Server 2012 R2 and Windows Server 2016 to appear in firewall reports, these devices must be onboarded using the modern unified solution package. For more information, see New functionality in the modern unified solution for Windows Server 2012 R2 and 2016.
To onboard devices to the Microsoft Defender for Endpoint service, see onboarding guidance.
For the Microsoft Defender portal to start receiving data, you must enable Audit Events for Windows Defender Firewall with Advanced Security. See the following articles:
Enable these events by using Group Policy Object Editor, Local Security Policy, or the auditpol.exe commands. For more information, see documentation about auditing and logging. The two PowerShell commands are as follows:
auditpol /set /subcategory:"Filtering Platform Packet Drop" /failure:enableauditpol /set /subcategory:"Filtering Platform Connection" /failure:enable
Here's an example query:
param (
     [switch]$remediate
)
try {

     $categories = "Filtering Platform Packet Drop,Filtering Platform Connection"
     $current = auditpol /get /subcategory:"$($categories)" /r | ConvertFrom-Csv
     if ($current."Inclusion Setting" -ne "failure") {
         if ($remediate.IsPresent) {
             Write-Host "Remediating. No Auditing Enabled. $($current | ForEach-Object {$_.Subcategory + ":" + $_.'Inclusion Setting' + ";"})"
             $output = auditpol /set /subcategory:"$($categories)" /failure:enable
             if($output -eq "The command was successfully executed.") {
                 Write-Host "$($output)"
                 exit 0
             }
             else {
                 Write-Host "$($output)"
                 exit 1
             }
         }
         else {
             Write-Host "Remediation Needed. $($current | ForEach-Object {$_.Subcategory + ":" + $_.'Inclusion Setting' + ";"})."
             exit 1
         }
     }

}
catch {
     throw $_
}
The process
Note
Make sure to follow the instructions from previous the section and properly configure your devices to participate in the preview program.
After events are enabled, Microsoft Defender for Endpoint begins to monitor data, which includes:
- Remote IP
- Remote Port
- Local Port
- Local IP
- Computer Name
- Process across inbound and outbound connections
Admins can now see Windows host firewall activity here. Additional reporting can be facilitated by downloading the Custom Reporting script to monitor the Windows Defender Firewall activities using Power BI.
- It can take up to 12 hours before the data is reflected.
Supported scenarios
- Firewall reporting
- From "Computers with a blocked connection" to device (requires Defender for Endpoint Plan 2)
- Drill into advanced hunting (preview refresh) (requires Defender for Endpoint Plan 2)
Firewall reporting
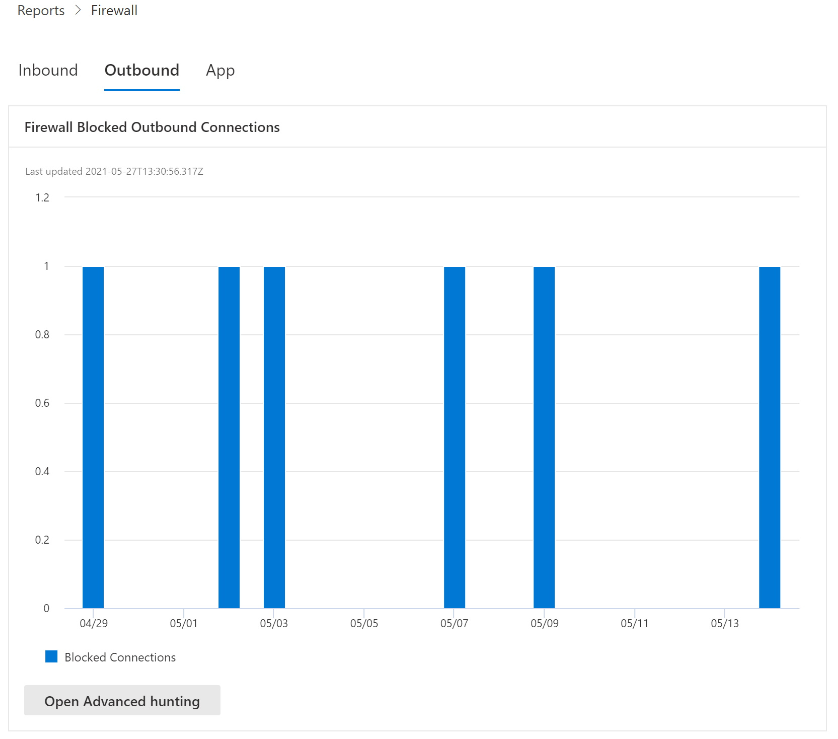
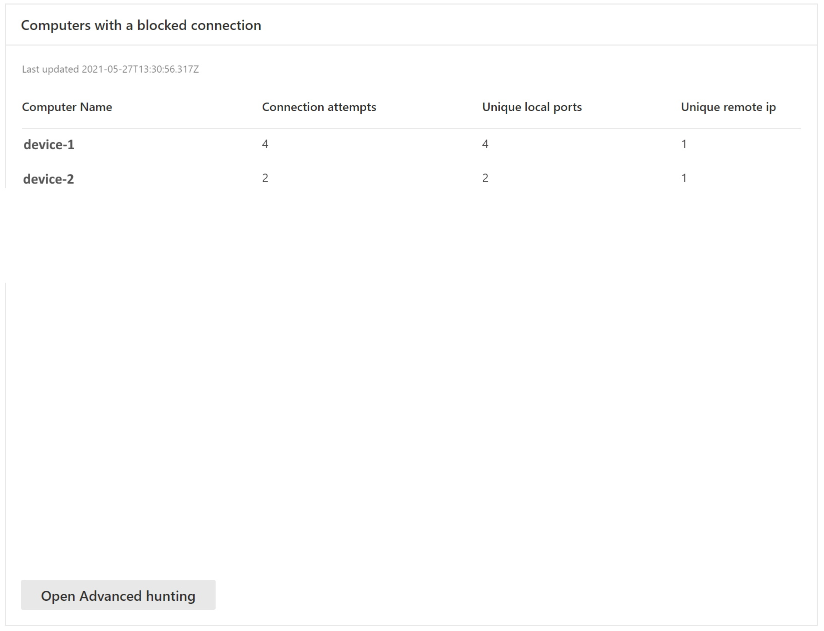
Here are some examples of the firewall report pages. Here you'll find a summary of inbound, outbound, and application activity. You can access this page directly by going to https://security.microsoft.com/firewall.
These reports can also be accessed by going to Reports > Security Report > Devices (section) located at the bottom of the Firewall Blocked Inbound Connections card.
From "Computers with a blocked connection" to device
Note
This feature requires Defender for Endpoint Plan 2.
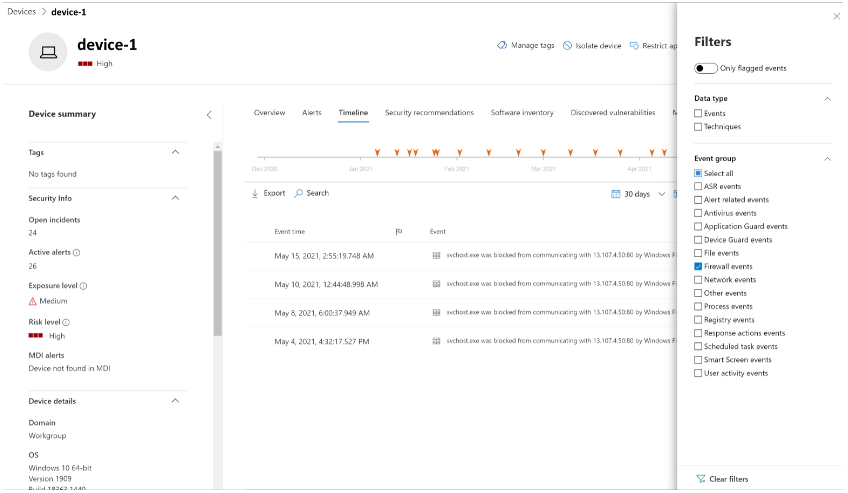
Cards support interactive objects. You can drill into the activity of a device by clicking on the device name, which will launch the Microsoft Defender portal in a new tab, and take you directly to the Device Timeline tab.
You can now select the Timeline tab, which will give you a list of events associated with that device.
After clicking on the Filters button on the upper right-hand corner of the viewing pane, select the type of event you want. In this case, select Firewall events and the pane will be filtered to Firewall events.
Drill into advanced hunting (preview refresh)
Note
This feature requires Defender for Endpoint Plan 2.
Firewall reports support drilling from the card directly into Advanced Hunting by clicking the Open Advanced hunting button. The query is prepopulated.
The query can now be executed, and all related Firewall events from the last 30 days can be explored.
For more reporting, or custom changes, the query can be exported into Power BI for further analysis. Custom reporting can be facilitated by downloading the Custom Reporting script to monitor the Windows Defender Firewall activities using Power BI.
Tip
Do you want to learn more? Engage with the Microsoft Security community in our Tech Community: Microsoft Defender for Endpoint Tech Community.
Feedback
Coming soon: Throughout 2024 we will be phasing out GitHub Issues as the feedback mechanism for content and replacing it with a new feedback system. For more information see: https://aka.ms/ContentUserFeedback.
Submit and view feedback for


