Note
Access to this page requires authorization. You can try signing in or changing directories.
Access to this page requires authorization. You can try changing directories.
The Inspect tool displays information about individual elements as you hover over the rendered webpage, including accessibility information. In contrast, the Issues tool automatically reports issues for the entire webpage.
The Inspect tool button (![]() ) is in the upper-left corner of DevTools. When you click the Inspect tool button, the button turns blue, indicating that the Inspect tool is active.
) is in the upper-left corner of DevTools. When you click the Inspect tool button, the button turns blue, indicating that the Inspect tool is active.
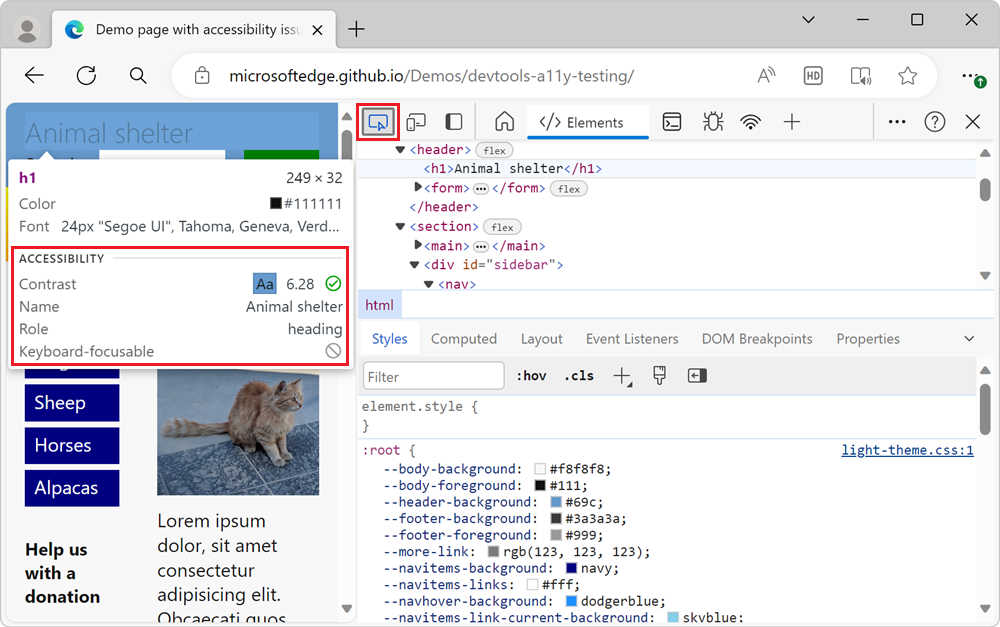
When the Inspect tool is active, hovering over any element on the rendered webpage displays the Inspect overlay. This overlay displays general information and accessibility information about that element. The Accessibility section of the Inspect overlay displays information about text-color contrast, screen reader text, and keyboard support:
The main article about the Inspect tool is Analyze HTML pages using the Inspect tool. The present article focuses on the accessibility features of the Inspect tool.
Check individual elements for text contrast, screen reader text, and keyboard support
Open the accessibility-testing demo webpage in a new window or tab.
Right-click anywhere in the webpage and then select Inspect. Or, press F12. DevTools opens next to the webpage.
Click the Inspect (
 ) button in the top-left corner of DevTools so that the icon is highlighted (blue):
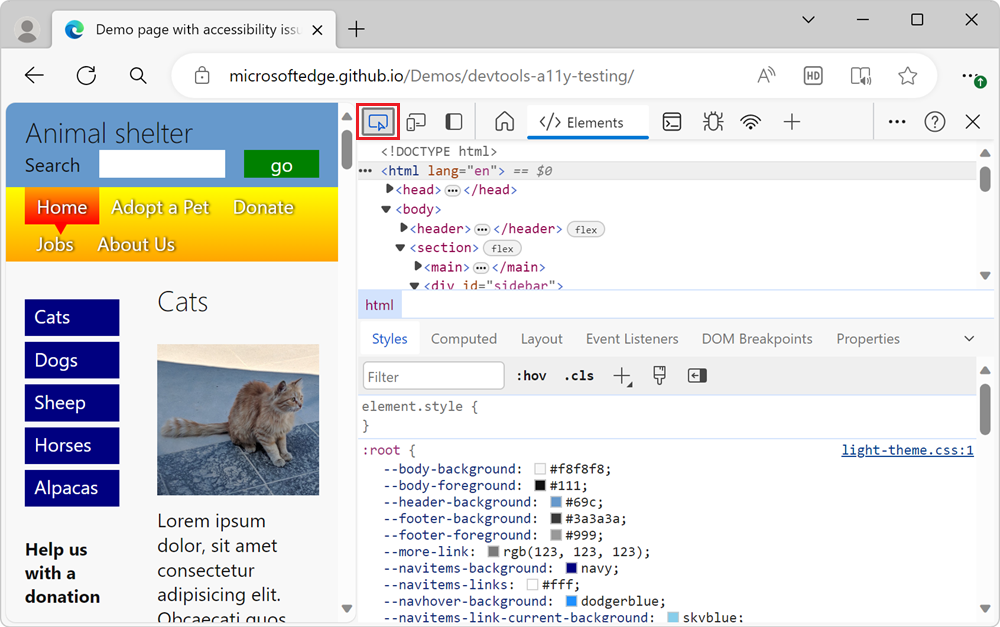
Hover over any element in the rendered demo webpage. The Inspect tool shows an information overlay next to the element within the rendered webpage. The information overlay contains an Accessibility section:
The Accessibility section contains the following information:
Contrast defines whether an element can be understood by people with low vision. The contrast ratio as defined by the WCAG Guidelines indicates whether there is enough contrast or not.
- A green check mark icon indicates enough contrast.
- An orange exclamation-point icon indicates that the contrast is insufficient.
Name and Role are what assistive technology such as screen readers will report about the element.
- The Name is the text content of the hovered element. For the element
<a href="/">About Us</a>, the Name that's shown in the Inspect tool is About Us. - The Role of the element. This is usually the element name, such as
article,img,link, orheading. Thedivandspanelements are referred to asgeneric.
- The Name is the text content of the hovered element. For the element
Keyboard-focusable indicates whether users can reach the element regardless of input device.
- A green check mark icon indicates that the element is keyboard-focusable.
- A gray circle with diagonal line indicates that the element isn't keyboard-focusable.
Additional information in the Inspect overlay
The top part of the Inspect overlay, which is above the Accessibility section, lists the following details of the element.
- Layout type. If the element is positioned using a flexbox or grid, an icon (
 ) is displayed.
 - Name of the element, such as
h1,h2, ordiv. - The dimensions of the element in pixels.
- The color as a color swatch (or a small, colored square) and as a string (such as
#336699). - Font information, such as size and font families.
- Margin and padding in pixels.