Note
Access to this page requires authorization. You can try signing in or changing directories.
Access to this page requires authorization. You can try changing directories.
This page is a comprehensive reference of DevTools features that are related to analyzing performance.
For a step-by-step tutorial on how to analyze the performance of a page using the Performance tool, see Analyze runtime performance (tutorial).
The images in this page show DevTools undocked into its own, dedicated window. To learn more about undocking DevTools, see Undock DevTools into a separate window in Change DevTools placement (Undock, Dock to bottom, Dock to left).
Detailed contents:
- Open the Performance tool
- Record performance
- Record runtime performance
- Record load performance
- Capture screenshots while recording
- Force garbage collection while recording
- Show recording settings
- Disable JavaScript samples
- Throttle the network while recording
- Throttle the CPU while recording
- Enable CSS selector stats
- Enable advanced paint instrumentation
- Annotate a recording and share it
- Clear the previous recording
- Analyze a performance recording
- Get actionable insights
- Navigate the recording
- Search activities
- Change the order of tracks and hide them
- View main thread activity
- Read the flame chart
- Track event initiators
- Hide functions and their children in the flame chart
- View activities in a table
- View performance markers
- View custom timings
- View interactions
- View layout shifts
- View animations
- View GPU activity
- View raster activity
- Analyze frames per second (FPS)
- View network requests
- View memory metrics
- View the duration of a portion of a recording
- View a screenshot
- View layers information
- View paint profiler
- View CSS selector statistics
- View messages between windows, iframes, and dedicated workers
- View WebSocket messages
- Analyze rendering performance with the Rendering tool
- Visualize memory leaks (Performance tool: Memory checkbox)
Open the Performance tool
To open the Performance tool in DevTools:
Right-click a webpage, and then select Inspect.
Or, press Ctrl+Shift+I (Windows, Linux) or Command+Option+I (macOS).
DevTools opens.
In DevTools, on the Activity Bar, select the Performance (
 ) tab.
If that tab isn't visible, click the More tools (
 ) button.
Record performance
The sections below describe how to record the performance of a webpage in DevTools.
Record runtime performance
To analyze the performance of a webpage while it's running (rather than while it's loading):
Go to the webpage that you want to analyze, such as the Photo Gallery demo.
Right-click the webpage, and then select Inspect.
DevTools opens.
On the Activity Bar, select the Performance (
) tool.Click the Record (
 ) button.
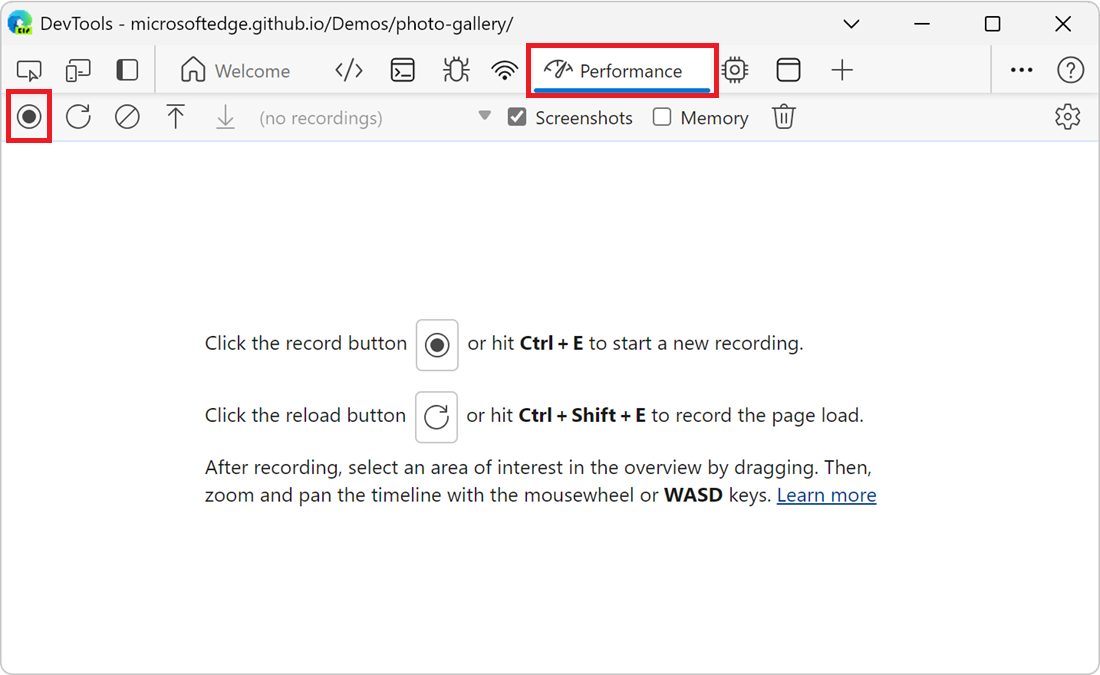
Interact with the page for a while. DevTools records all page activity that occurs as a result of your interactions.
Click Record again. Or, click Stop to stop recording.
The Performance tool displays the recording.
Record load performance
To analyze the performance of a webpage while it's loading (rather than while it's running):
Go to the webpage that you want to analyze, such as the Photo Gallery demo.
Right-click the webpage, and then select Inspect.
DevTools opens.
On the Activity Bar, select the Performance (
) tool.Click the Refresh page (
 ) button:
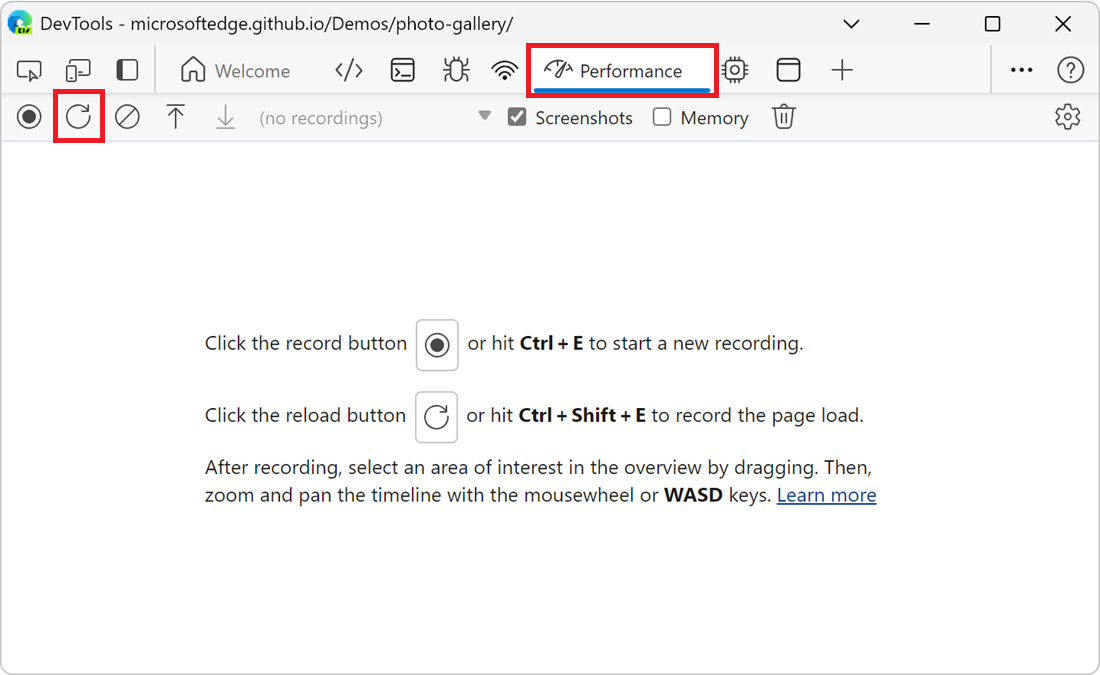
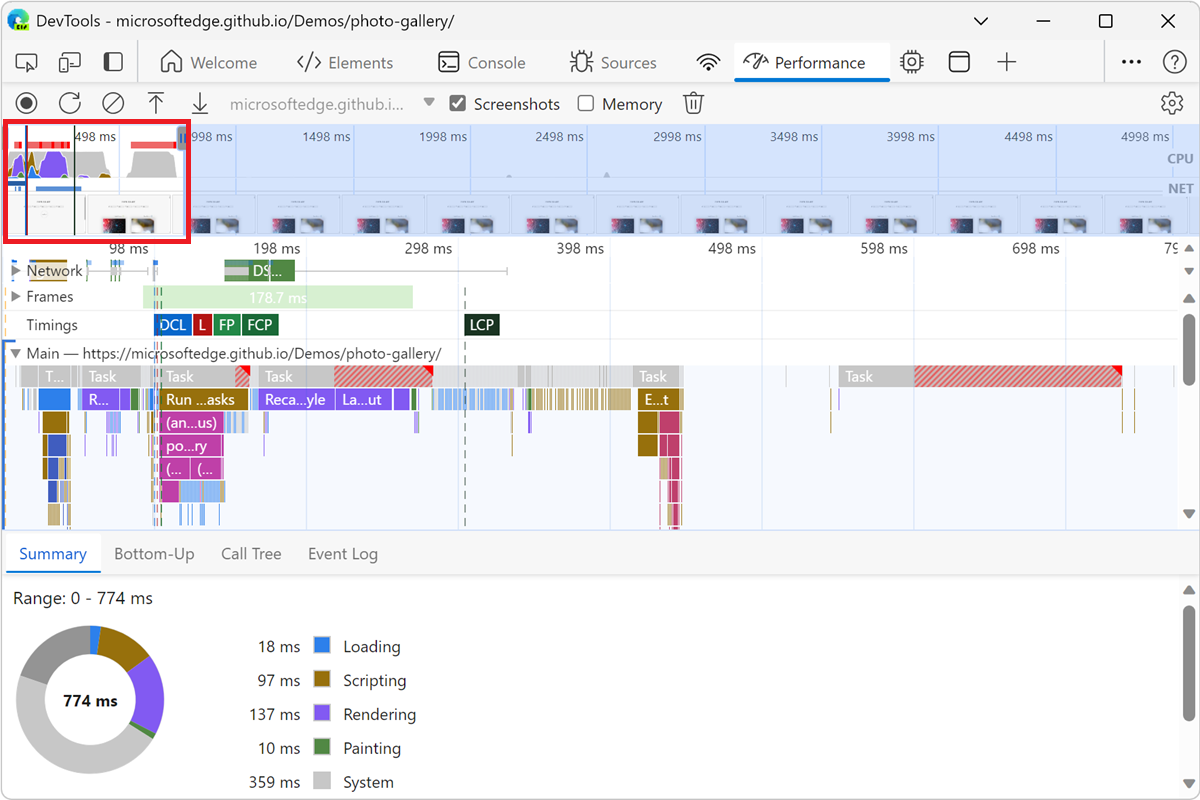
DevTools records performance metrics while the page refreshes and then automatically stops the recording a couple seconds after the load finishes. Then, DevTools displays the recording and automatically zooms in on the portion of the recording where most of the activity occurred:
Capture screenshots while recording
To capture a screenshot of every frame while recording, select the Screenshots checkbox:
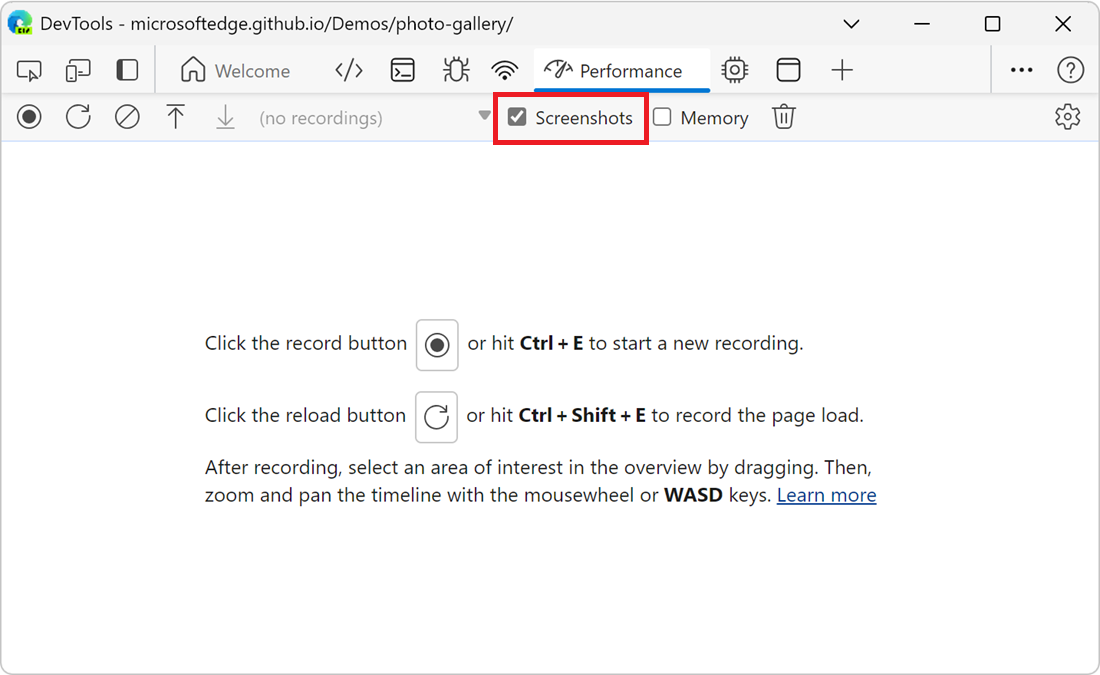
To learn how to interact with screenshots, see View a screenshot, below.
Force garbage collection while recording
To force garbage collection while you are recording a page, click the Collect garbage (![]() ) button:
) button:
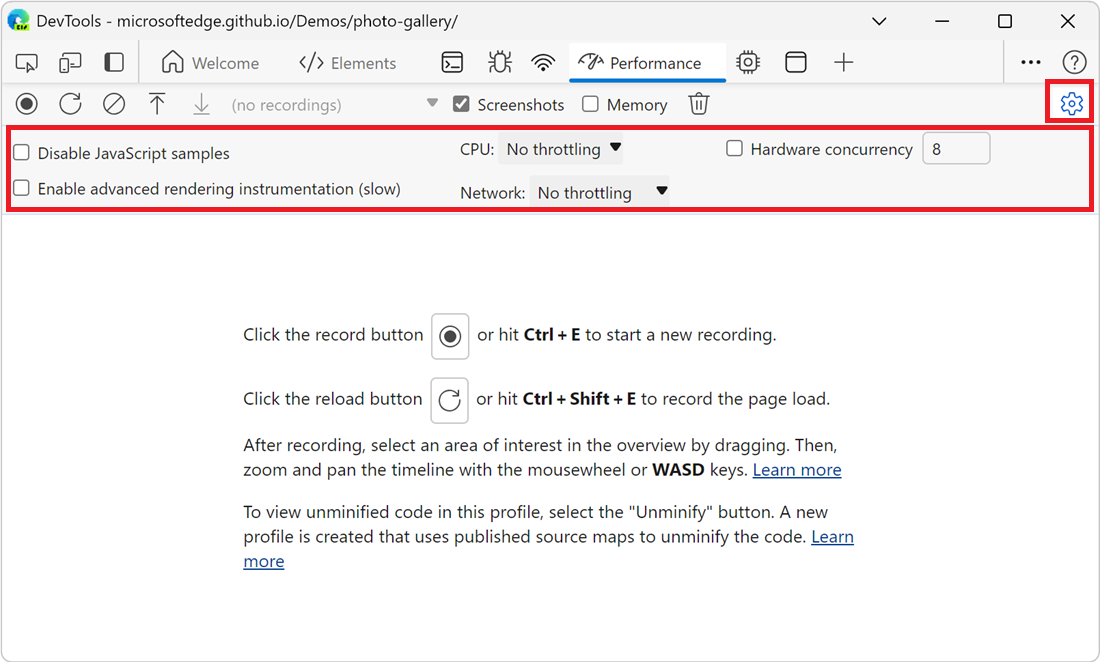
Show recording settings
To expose more settings related to how DevTools captures performance recordings:
In the Performance tool, click the Capture settings (
 ) button.
Checkboxes and dropdown lists are displayed at the top of the Performance tool:
Disable JavaScript samples
By default, the Main section of a recording displays detailed call stacks of JavaScript functions that were called during the recording. To disable the JavaScript call stacks:
In the Performance tool, click the Capture settings (
) button.Select the Disable JavaScript samples checkbox.
Take a recording of the page.
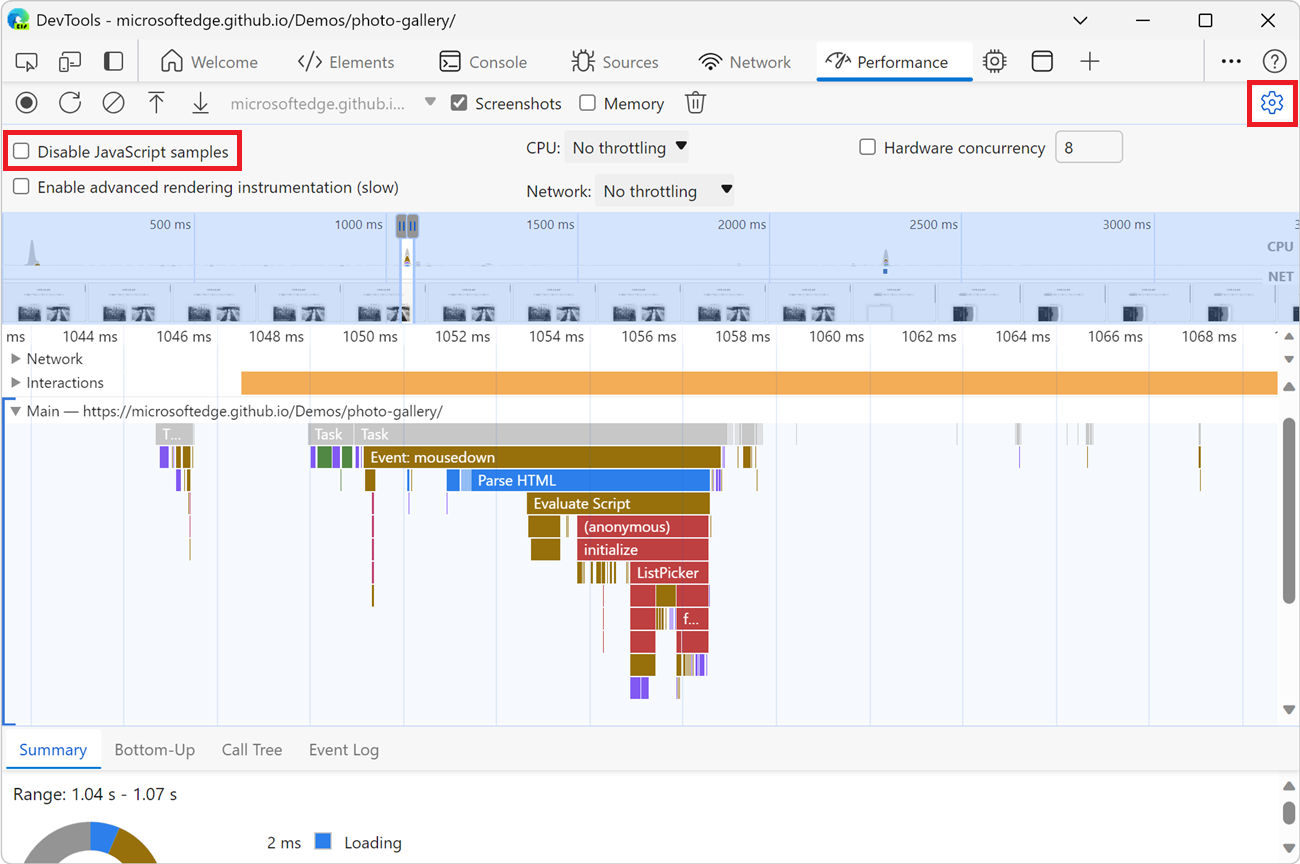
The following two figures show the difference between disabling and enabling JavaScript samples. The Main section of the recording is much shorter when JavaScript sampling is disabled, because the recording omits the JavaScript call stacks.
An example of a recording when JS samples are disabled:
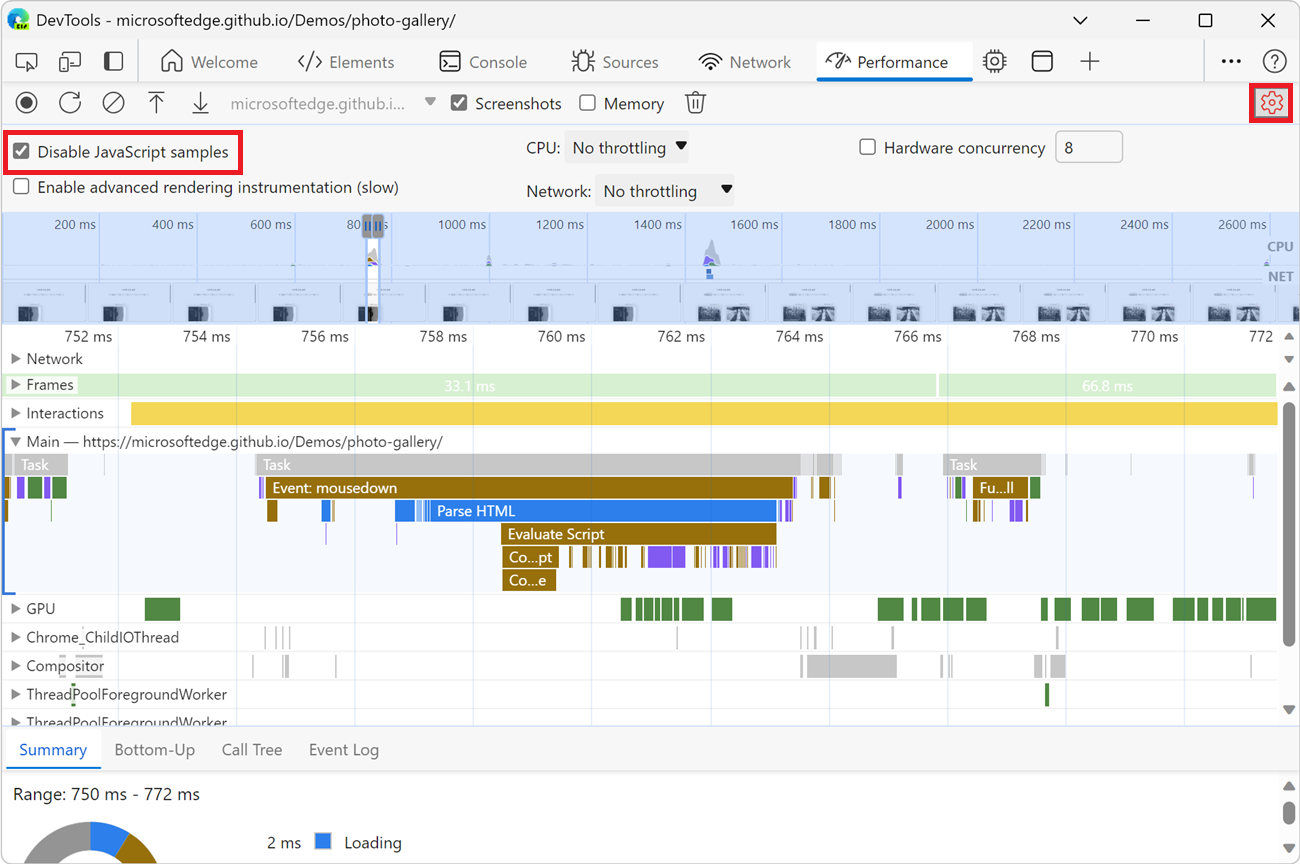
An example of a recording when JS samples are enabled:
Throttle the network while recording
To throttle the network while recording:
In the Performance tool, click the Capture settings (
) button. See Show recording settings, above.Set Network to the desired level of throttling.
A warning icon is displayed on the Network tool's tab, to remind you that throttling is enabled.
Throttle the CPU while recording
To throttle the CPU while recording:
In the Performance tool, click the Capture settings (
) button. See Show recording settings, above.Set CPU to the desired level of throttling.
A warning icon is displayed on the Performance tool's tab, to remind you that throttling is enabled.
Throttling is relative to the capabilities of your computer. For example, the 2x slowdown option makes your CPU operate twice as slow than normal. DevTools don't truly simulate the CPUs of mobile devices, because the architecture of mobile devices is very different from that of desktops and laptops.
Enable CSS selector stats
To view the statistics of your CSS rule selectors during long-running Recalculate Style events:
Click the Capture settings (
) button. See Show recording settings, above.Select the Enable CSS selector stats (slow) checkbox.
For details, see Analyze CSS selector performance during Recalculate Style events.
Enable advanced paint instrumentation
To view detailed paint instrumentation:
Click the Capture settings (
) button. See Show recording settings, above.Select the Enable advanced paint instrumentation (slow) checkbox.
To learn how to interact with the paint information, see View layers information, below, and View paint profiler, below.
Annotate a recording and share it
Once a performance trace is recorded, you can analyze it, and annotate it to share your findings.
To annotate a recording, open the Annotations tab in the Performance tool sidebar. If the sidebar is not visible, click the Show sidebar (![]() ) button.
) button.
The Annotations tab in the sidebar initially contains instructions about how to add annotations. After you create annotations, as shown below, the tab lists your existing annotations, and allows you to delete them.
There are several ways to add an annotation:
Label an item: To label an item in the performance trace, double-click the item, enter the label in the text box, and then press Enter.
Connect two items: To draw an arrow between two items in the performance trace, double-click the first item, click the arrow icon next to it, and then click the second item.
Label a time range: To draw and label an arbitrary time range in the performance trace, hold the Shift key and drag from the start of a time range to the end, enter the label in the text box that appears, and then press Enter.
For example, open the Activity Tabs Demo webpage in a new window or tab, create a performance recording, and then do the above three actions. Result:

In this example, there are:
- Three annotations.
- An arrow annotation connecting two annotations.
- An annotated time range highlighted in pink.
The Annotations tab shows the number of annotations next to its tab name; in this example, 5.
To delete an annotation, hover over it in the Annotations tab and then click the Delete button next to it.
To hide annotations from the performance trace, select Hide annotations at the bottom of the Annotations tab.
Save and share a recording
To save a recording as a file on your device and later share it with your annotated performance findings, in the action bar at the top of the Performance tool, click the Save profile (![]() ) button, and then select Save trace.
) button, and then select Save trace.

Alternatively, select Save trace without annotations.
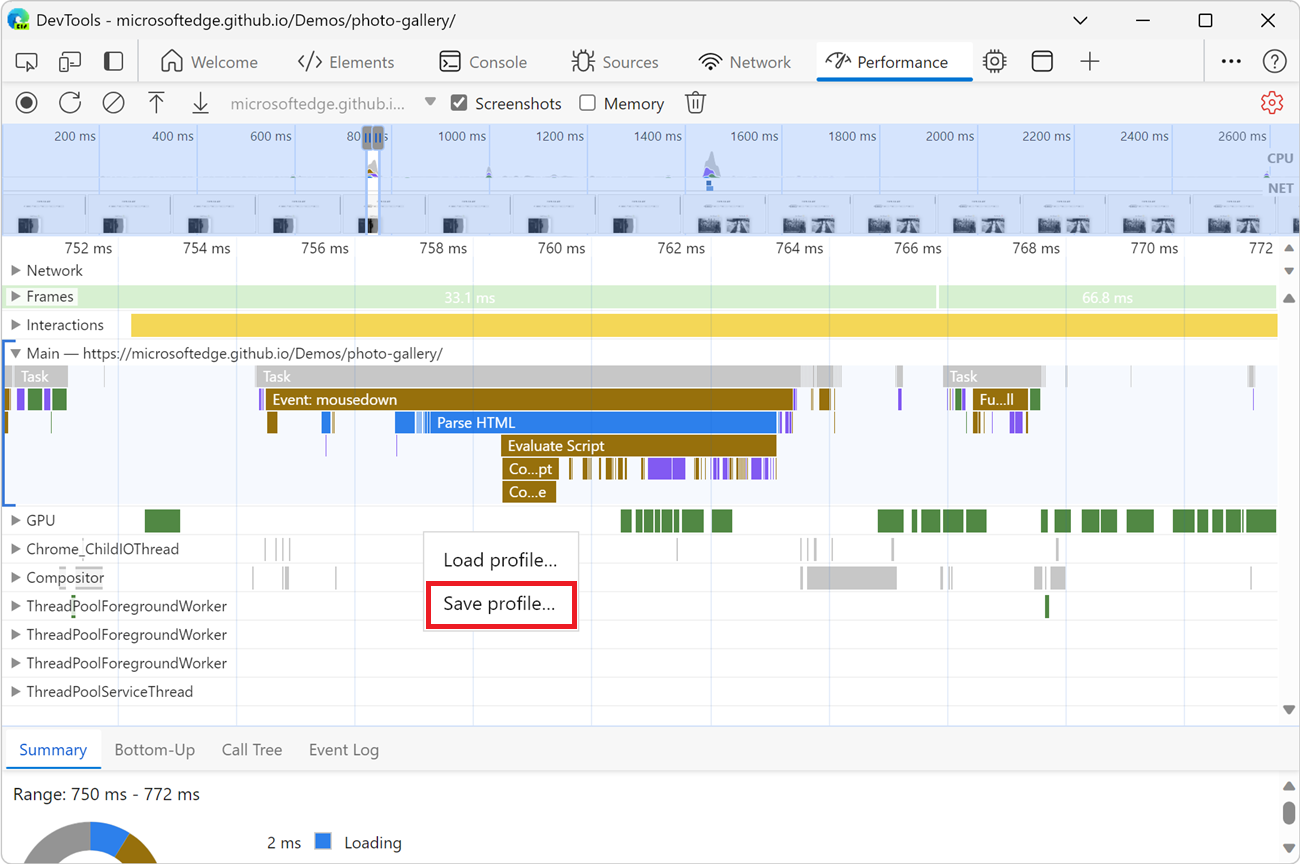
Instead of clicking the Save profile (![]() ) button at the top, you can right-click a track of a recording, and then select Save profile:
) button at the top, you can right-click a track of a recording, and then select Save profile:
Load a recording
To load a recording from a file, click the Load profile (![]() ) button in the action bar at the top of the Performance tool.
) button in the action bar at the top of the Performance tool.

The Performance tool will show annotations if they are present in the trace.
Or, right-click in the Performance tool, and then select Load profile:

You can right-click in an existing recording, or on the screen that's displayed in the Performance tool when there are no recordings.
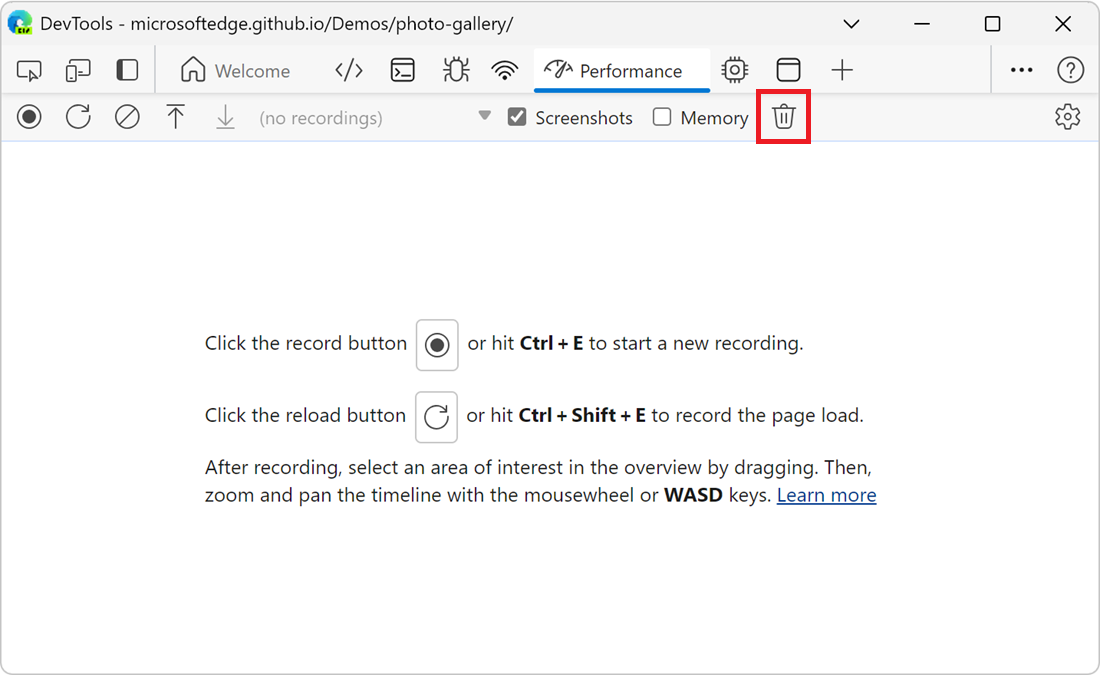
Clear the previous recording
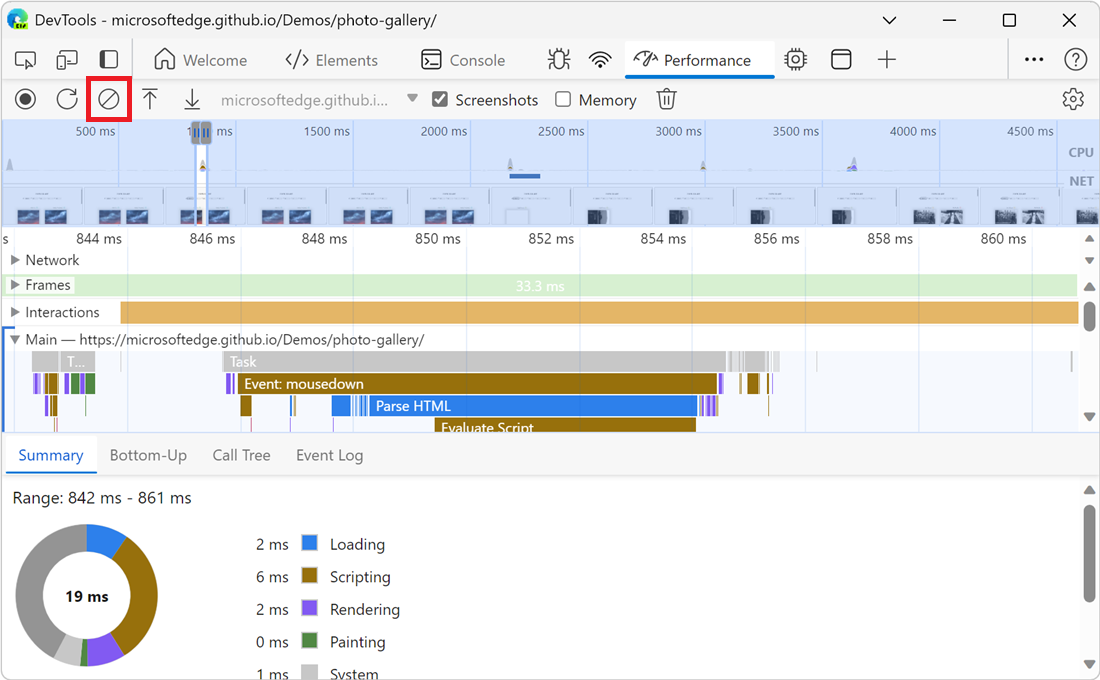
After making a recording, to remove that recording from the Performance tool, click the Clear recording (![]() ) button:
) button:
Analyze a performance recording
After you record runtime performance or record load performance, the Performance tool displays a lot of data about the recording. Use the recorded data to analyze the performance of your webpage.
Get actionable insights
The Performance tool extracts actionable insights from the recorded performance data. These insights are ways in which you can improve the performance of your website. The insights include:
- INP by phase
- LCP by phase
- LCP request discovery
- Layout shift culprits
- Render blocking request
- Network dependency tree
- Improve image delivery
- Document request latency
- Font display
- Optimize viewport for mobile
- Optimize DOM size
- 3rd parties
- CSS selector costs
- Forced reflow
- Use efficient cache lifetimes
The insights are focused on improving the Core Web Vitals metrics and on optimizing how quickly the webpage loads and renders.
After you record a profile in the Performance tool, the Insights tab in the sidebar shows the list of actionable insights that apply to the recorded performance data. To view the list of insights that don't apply to the profile, see the Passed insights section.
To use the insights:
Make a performance recording, per Record performance, above.
In the left sidebar of the Performance tool, select the Insights tab, expand different sections, and hover over and click items. The Performance tool highlights the corresponding events in the trace:

If the sidebar and Insights tab is not visible, click the Show sidebar (
 ) button.
Navigate the recording
To closely inspect your performance recording, you can select a portion of a recording, scroll a long flame chart, zoom in and out, and use breadcrumbs to jump between zoom levels.
Use keyboard shortcuts to navigate
To use keyboard shortcuts to quickly navigate the recording, first, choose your preferred style of keyboard navigation, as follows:
In the top-right corner of the Performance tool, click the Show shortcuts (
 ) button, and then select the Modern or Classic option button.
The Keyboard shortcuts dialog displays the available shortcuts for the selected mapping option.
When the Modern option button is selected:

- To zoom: Command/Ctrl + mouse wheel.
- To vertical scroll: Mouse wheel.
- To horizontal scroll: Shift + mouse wheel.
When the Classic option button is selected:
- To zoom: Mouse wheel, or touchpad up or down.
- To vertical scroll: Shift + mouse wheel.
- To horizontal scroll: Shift + Left arrow|Right arrow
Additional shortcuts:
Zoom, by pressing W or S.
Pan left and right, by pressing A or D.
Select a portion of a recording
At the top of the recording, the Timeline overview section is displayed, including the CPU and NET charts (indicated on the right):

To select a portion of a recording, in the Timeline overview, click and drag horizontally:

To select a portion using the keyboard:
Focus the Main track or any of its neighbors.
Use the W, A, S, D keys to zoom in, move left, zoom out, and move right, respectively.
To select a portion using a trackpad:
Hover over the Timeline overview section or any of the tracks (Main and its neighbors).
Using two fingers, swipe up to zoom out, swipe left to move left, swipe down to zoom in, and swipe right to move right.
You can select a portion of a recording by using a mouse, keyboard, or trackpad.
Mouse:
To select a portion of a recording by using the mouse:
- Drag your mouse left or right across the Overview. The Overview is the section that contains the CPU and NET charts:
To scroll a long flame chart in the Main section or in any of the neighboring sections, click and hold while dragging up and down. Drag left or right to move which portion of the recording is selected.
Keyboard:
To select a portion of a recording by using the keyboard:
Select the background of the Main section, or select the background of a section that's next to the Main section, such as Interactions, Network, or GPU. This keyboard workflow only works when one of these sections is in focus.
Press
WorSto zoom in or out. PressAorDto move left or right.
Trackpad:
To select a portion of a recording by using a trackpad:
Hover over the Overview section or the Details section. The Overview section is the area containing the FPS, CPU, and NET charts. The Details section is the area containing the Main section and the Interactions section.
Using two fingers, swipe up to zoom out, or down to zoom in. Using two fingers, swipe left to move left, or right to move right.
Zoom on portions of a recording and switch between zoom levels
The Timeline overview lets you zoom in on portions of your recording in succession, and create breadcrumbs at each step, allowing you to then switch between these zoom levels.
To zoom on a portion of your recording and use breadcrumbs:
In Timeline overview, select a portion of the recording (above).
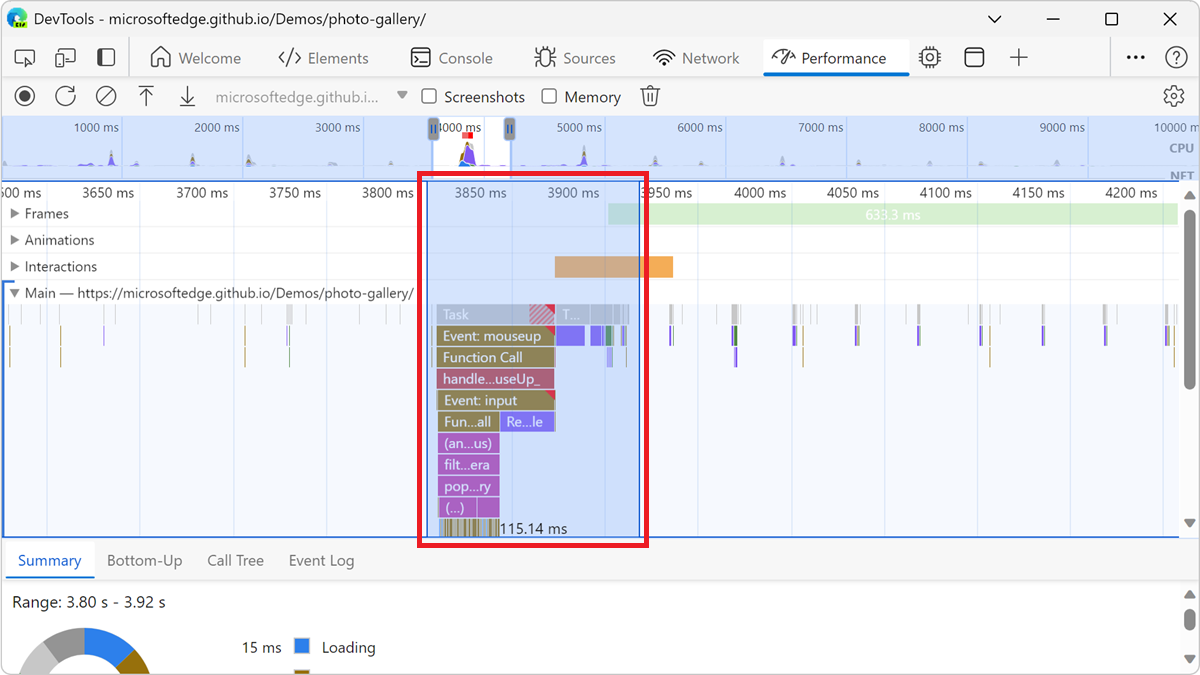
Hover over the selection, and then click the N ms (
 ) button:
The selection expands to fill the Timeline overview. A chain of breadcrumbs starts building at top of the Timeline overview.
Repeat the previous two steps to create another nested breadcrumb. You can continue to nest breadcrumbs as long as the selection range is greater than 5 milliseconds.
To jump to a chosen zoom level, click the corresponding breadcrumb in the chain at top of the Timeline overview.
To remove the children of a breadcrumb, right-click the parent breadcrumb and then select Remove child breadcrumbs:

Scroll a long flame chart
To scroll a long flame chart in the Main track or any of its neighbors, click and hold, then drag in any direction until what you are looking for comes into view.
Search activities
You can search across the activities in the Main track and requests in the Network track.
To open the search box at the bottom of the Performance tool:
Press Ctrl+F (Windows, Linux) or Command+F (macOS).
The Find box appears at the bottom of the Performance tool:
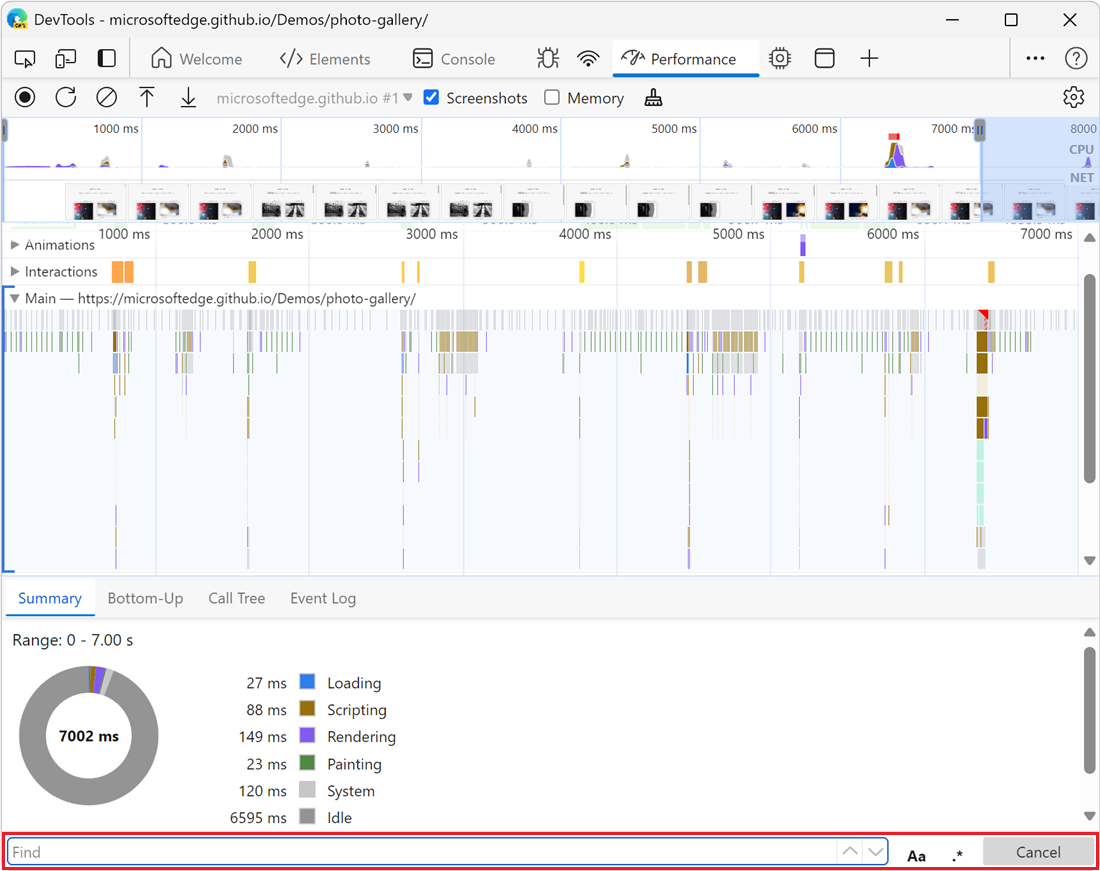
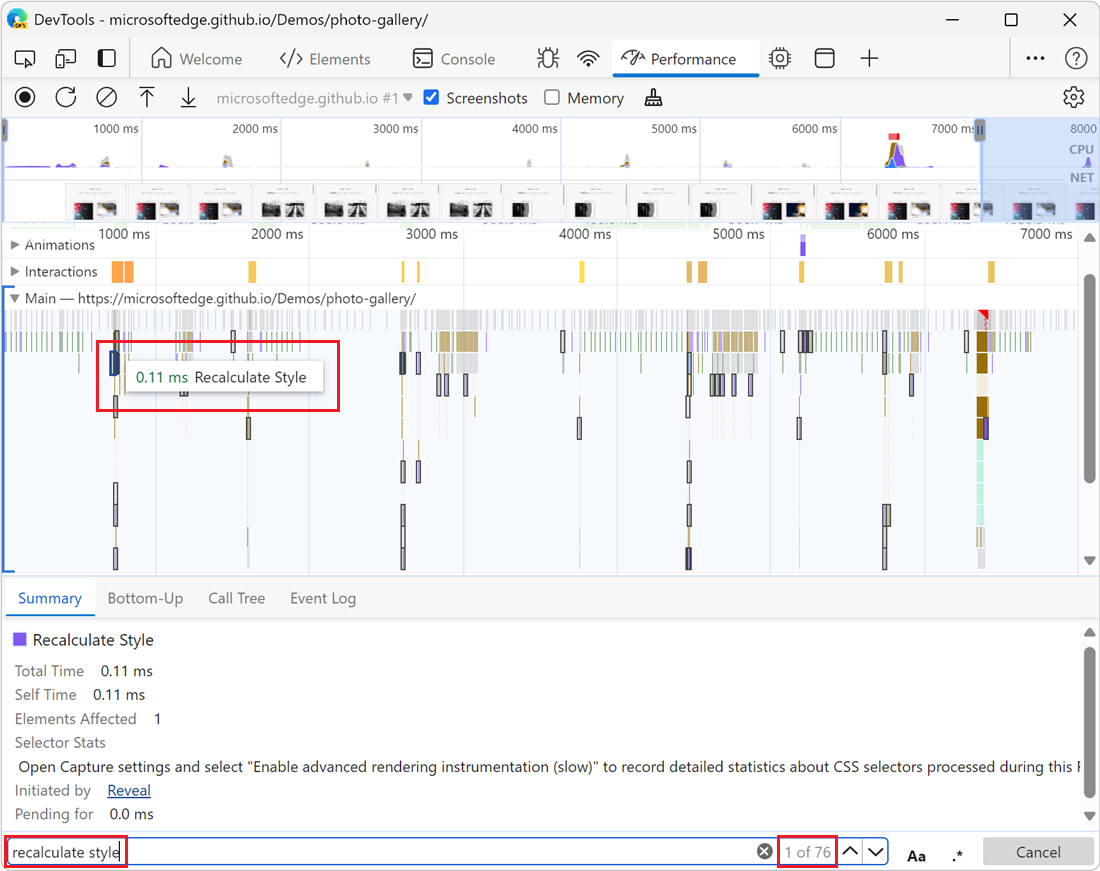
In the Find box, enter a query, such as "recalculate style".
The matching activities are highlighted in the Main section as you type, and the total number of matches appears in the search box. The first matching activity is selected, outlined in blue:
To navigate among the activities that match your query:
To select the next activity, press Enter or click the Next (
 ) button.
To select the previous activity, press Shift+Enter or click the Previous (
 ) button.
The Performance tool shows a tooltip over the activity that's selected in the search box.
To modify the query settings:
To use a regular expression in your query, click the Enable regular expressions (
 ) button. If you select the Regex button and then enter
 ^E.*that finds any activity that any activity that begins with the letter E.To make the query case-sensitive, click the Enable case sensitive search (
 ) button.
To hide the search box, click the Cancel button.
Change the order of tracks and hide them
To declutter the performance trace, you can change the order of tracks and hide the irrelevant ones in track configuration mode.
To move and hide tracks:
To enter the configuration mode, right-click a track name and then select Configure tracks.
Click the Move track up (
 ) button or the Move track down (
 ) button to move a track up or down. Click the Hide track (
 ) button to hide it.
Right-click the track, and then select Finish configuring.
The Performance tool applies your track configuration to new traces as well, unless you close and then re-open DevTools.
View main thread activity
Use the Main section to view the activity that occurred on the main thread of the page:
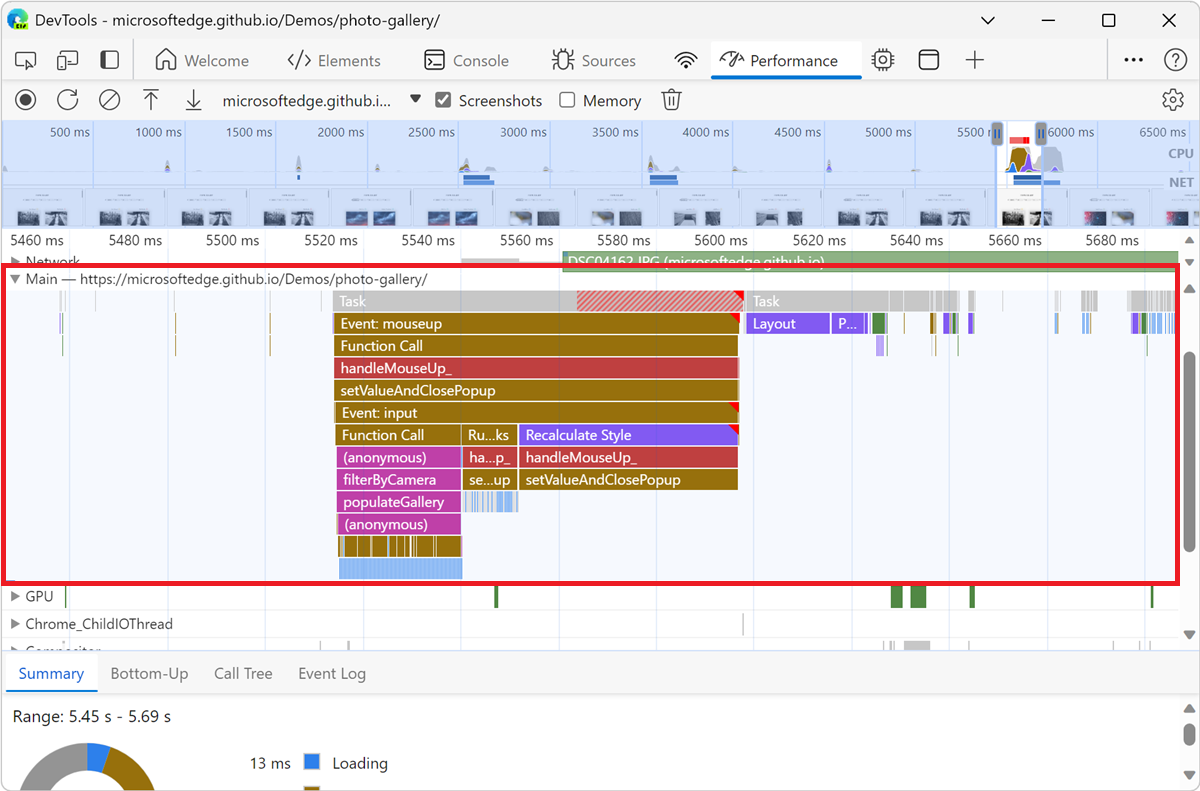
Select an event to view more information about it in the Summary tab. DevTools outlines the selected event:
DevTools represents main thread activity with a flame chart:
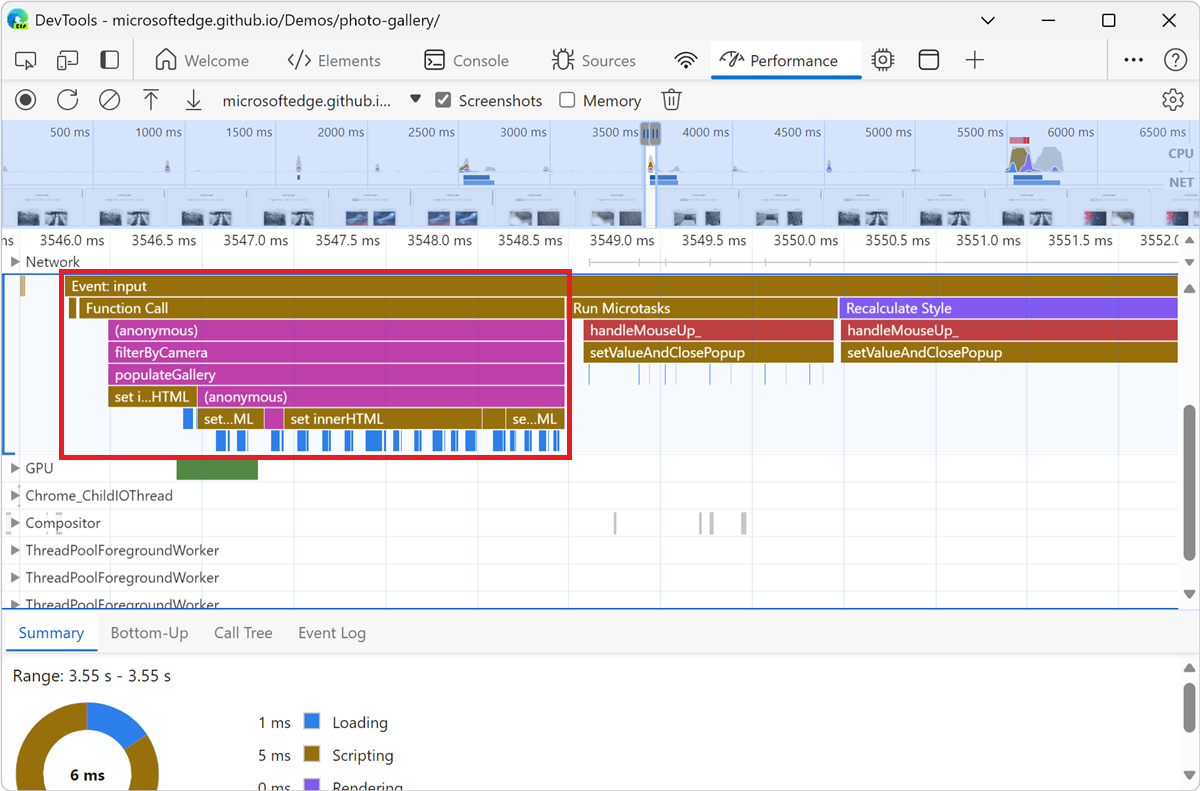
The x-axis represents the recording over time. The y-axis represents the call stack. An event that's near the top causes the events that are below it; for example, in the previous figure, an input event caused a Function Call, which ran an anonymous function that called filterByCamera and then populateGallery. The populateGallery function then made DOM changes by calling set innerHTML.
DevTools assigns scripts random colors. In the previous figure, function requests from a script are colored fuchsia (purple-pink). The darker yellow represents scripting activity, and the purple event represents rendering activity. These darker yellow and purple events are consistent across all recordings.
If you want to hide the detailed flame chart of JavaScript requests, see Disable JavaScript samples, above.
When JavaScript samples are disabled, only high-level events are displayed, such as Event: input and Function Call from the previous figure.
Read the flame chart
The Performance tool represents main thread activity in a flame chart. The x-axis represents the recording over time. The y-axis represents the call stack. The events on top cause the events below.

The Performance tool assigns scripts random colors to break up the flame chart and make it more readable.
Long tasks are also highlighted with a red triangle, and with the part over 50 milliseconds shaded in red.
Additionally, the Main track shows information on CPU profiles started and stopped with profile() and profileEnd() console functions.
To hide the detailed flame chart of JavaScript calls, see Disable JavaScript samples. When JS samples are disabled, you see only the high-level events such as Event (click) and Function Call.
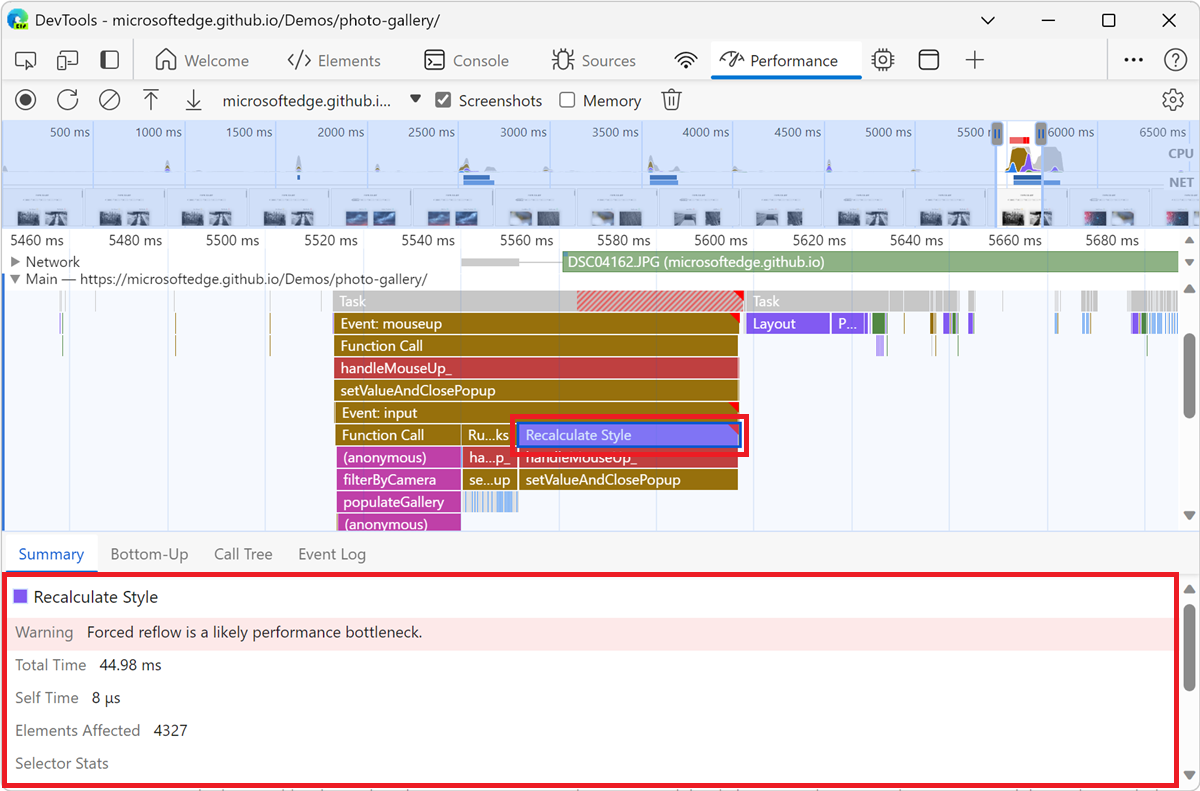
Track event initiators
The Main track can show arrows that connect the following initiators and the events they caused:
- Style or layout invalidation -> Recalculate styles or Layout
- Request Animation Frame -> Animation Frame Fired
- Request Idle Callback -> Fire Idle Callback
- Install Timer -> Timer Fired
- Create WebSocket -> Send... and Receive WebSocket Handshake or Destroy WebSocket
- Schedule postTask -> Fire postTask or Abort postTask
To see the arrows, find either an initiator or the event it caused in the flame chart and select it.
When selected, the Summary tab shows Initiator for links for initiators and Initiated by links for the events they caused. Click them to jump between the corresponding events.
Hide functions and their children in the flame chart
To declutter the flame chart in the Main thread, you can hide selected functions or their children:
In the Main track, right-click a function and choose one of the following options or press the corresponding shortcut:
- Hide function (H)
- Hide children (C)
- Hide repeating children (R)
- Reset children (U)
- Reset trace (T)
- Add script to ignore list (I)
A number hidden drop-down (
 ) button appears next to the function name with hidden children.
To see the number of hidden children, hover over the number hidden drop-down (
) button.To reset a function with hidden children or the whole flame chart, select the function and press U or right-click any function and select Reset trace respectively.
Ignore scripts in the flame chart
To add a script to the ignore list, right-click a script in the chart and select Add script to ignore list.
The chart collapses ignored scripts, marks them as On ignore list, and adds them to the Custom exclusion rules in Customize and control DevTools (![]() ) > Settings > Ignore list. Ignored scripts are saved until you remove them either from the trace or from the Custom exclusion rules.
) > Settings > Ignore list. Ignored scripts are saved until you remove them either from the trace or from the Custom exclusion rules.
View activities in a table
After recording a page, in addition to the Main section to analyze activities, DevTools also provides three tabular views for analyzing activities. Each view gives you a different perspective on the activities:
To view the activities where the most time was directly spent, use the Bottom-up tab.
To view the root activities that cause the most work, use the Call tree tab.
To view the activities in the order in which they occurred during the recording, use the Event log tab.
To help you find what you are looking for faster, all three tabs have buttons for advanced filtering next to the Filter bar:
The Enable regular expressions (
) button.The Enable case sensitive search (
) button.

Each tabular view in the Performance tool shows links for activities such as functions calls. To help you debug, DevTools finds the corresponding function declarations in source files. Additionally, if the appropriate source maps are present and enabled, DevTools automatically finds the original files.
Click a link to open a source file in the Sources tool.
The next three sections all refer to the same demo. You can run the demo yourself at Activity Tabs Demo and see the source at MicrosoftEdge / Demos > /devtools-performance-activitytabs/.
Root activities
Here's an explanation of the root activities concept that's mentioned in the Call Tree tab, Bottom-Up tab, and Event Log sections.
Root activities are activities that cause the browser to do some work. For example, when you click a webpage, the browser runs an Event activity as the root activity. That Event activity may cause other activities to run, such as a handler.
In the flame chart of the Main section, root activities are at the top of the chart. In the Call tree and Event log tabs, root activities are the top-level items.
For an example of root activities, see The Call tree tab, below.
The Call tree tab
Use the Call tree tab to view which root activities cause the most work.
The Call tree tab only displays activities during the selected portion of the recording. To learn how to select a portion of a recording, see Select a portion of a recording, above.
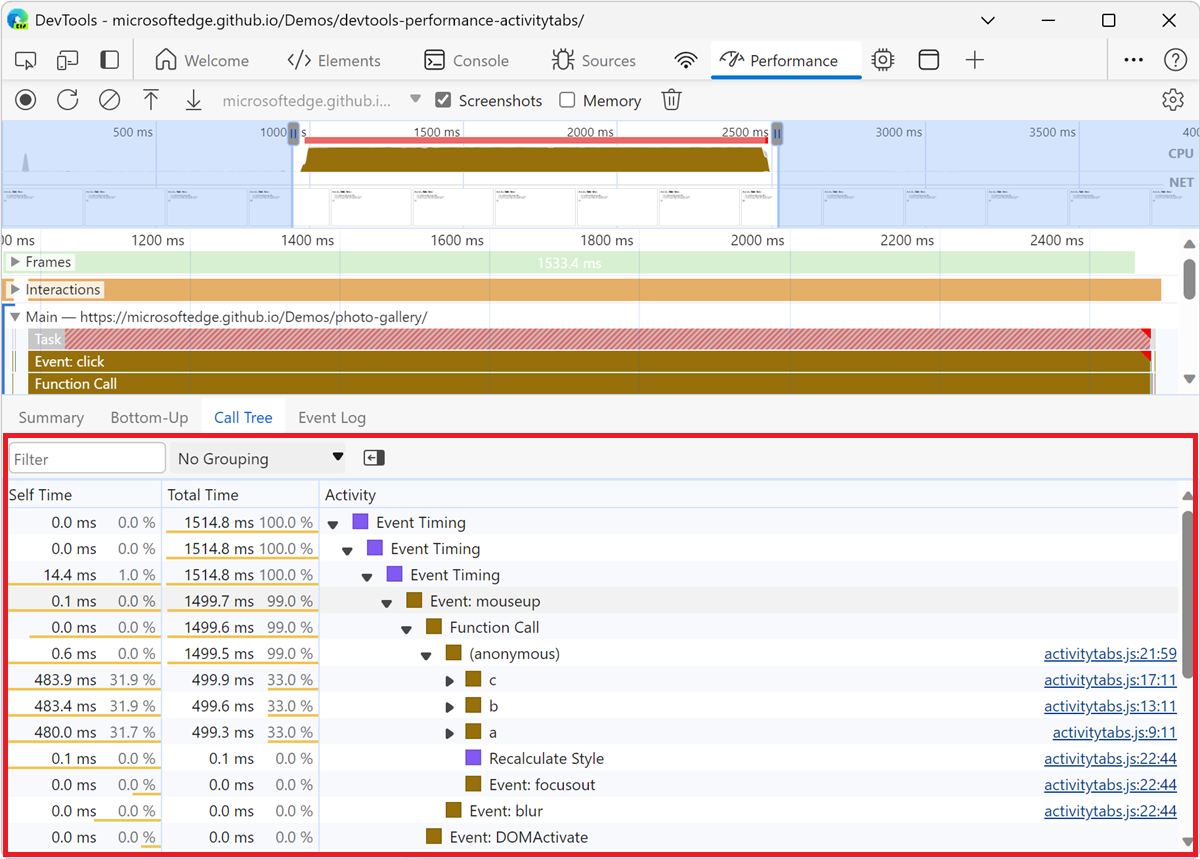
In the previous figure, the top-level items in the Activity column, such as Event Timing, are root activities. The nesting represents the call stack. For example, in the previous figure, Event Timing caused Event: mouseup, which caused Function Call, which cause (anonymous), and so on.
Self Time represents the time directly spent in that activity. Total Time represents the time spent in that activity or any of the children.
Click Self Time, Total Time, or Activity to sort the table by that column.
Use the Filter text box to filter events by activity name.
By default the Grouping menu is set to No Grouping. Use the Grouping menu to sort the activity table based on various criteria.
Click Show Heaviest Stack (![]() ) to reveal another table to the right of the Activity table. Click on an activity to populate the Heaviest Stack table. The Heaviest Stack table displays which children of the selected activity took the longest time to run.
) to reveal another table to the right of the Activity table. Click on an activity to populate the Heaviest Stack table. The Heaviest Stack table displays which children of the selected activity took the longest time to run.
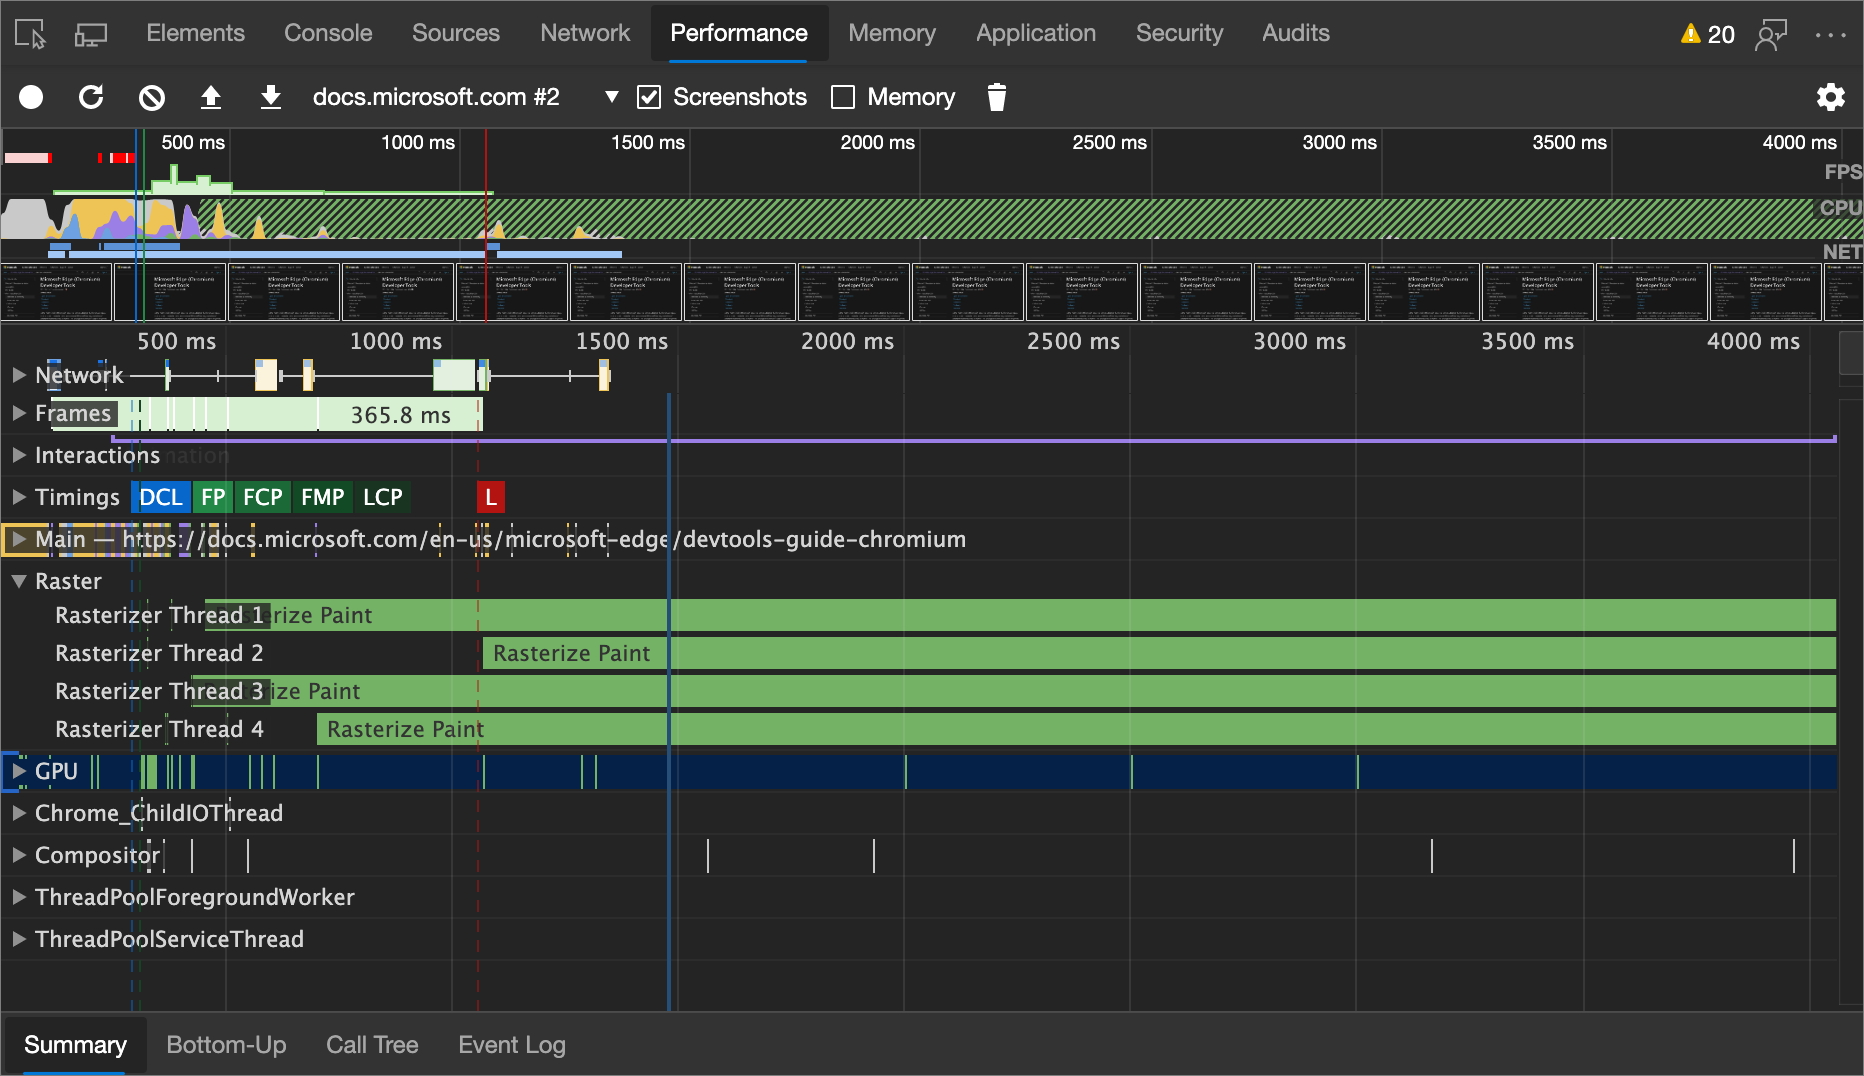
The Bottom-up tab
Use the Bottom-up tab to view which activities directly took up the most time in aggregate.
The Bottom-up tab only displays activities during the selected portion of the recording. To learn how to select a portion of a recording, see Select a portion of a recording, above.
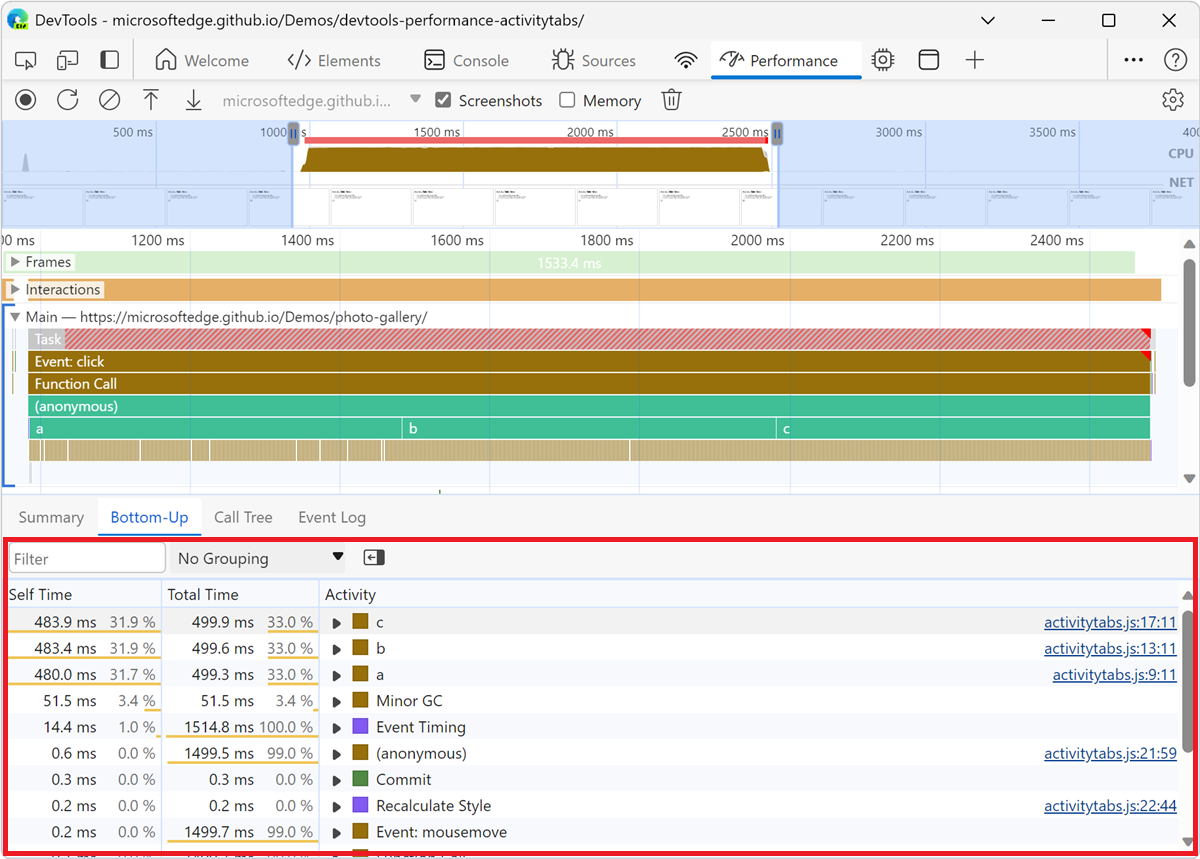
In the Main section flame chart of the previous figure, almost all of the time was spent running the a, b, and c functions. The top activities in the Bottom-up tab of the previous figure are also a, b, and c. In the Bottom-up tab, the next most expensive activity is Minor GC.
The Self Time column represents the aggregated time spent directly in that activity, across all of the occurrences.
The Total Time column represents aggregated time spent in that activity or any of the children.
The Event log tab
Use the Event log tab to view activities in the order in which they occurred during the recording.
The Event log tab only displays activities during the selected portion of the recording. To learn how to select a portion of a recording, see Select a portion of a recording, above.
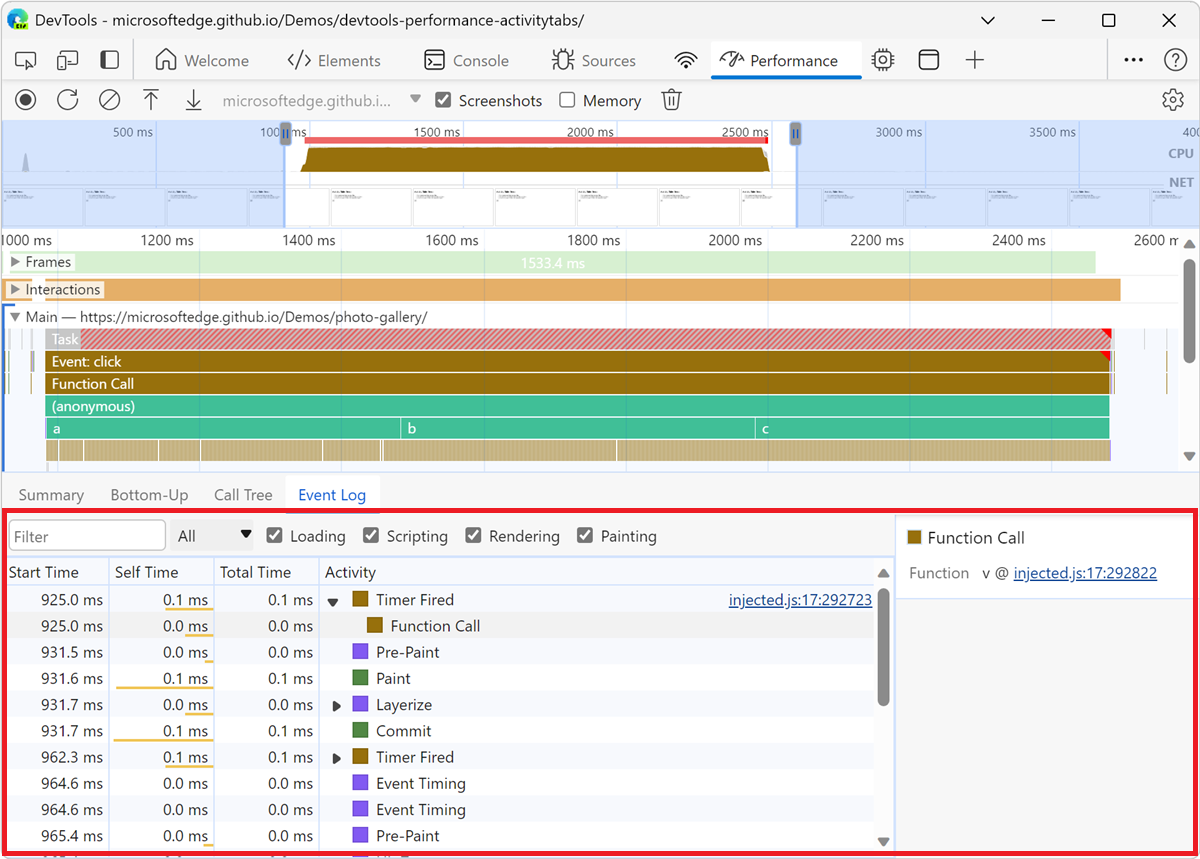
The Start Time column represents the point at which that activity started, relative to the start of the recording. For example, the start time of 925.0 ms for the selected item in the previous figure means that activity started 925.0 ms after the recording started.
The Self Time column represents the time spent directly in that activity.
The Total Time column represents time spent directly in that activity or in any of the children.
Click the Start Time, Self Time, or Total Time column heading, to sort the table by that column.
Use the Filter text box to filter activities by name.
Use the Duration menu to filter out any activities that took less than 1 ms or 15 ms. By default, the Duration menu is set to All, meaning that all activities are shown.
Clear the Loading, Scripting, Rendering, or Painting checkboxes to filter out all activities from those categories.
View performance markers
In an overlay with vertical lines across the performance trace, you can see important performance markers, such as:
- First Paint (FP)
- First Paint (FP) in Glossary at MDN.
- First Contentful Paint (FCP)
- First Contentful Paint (FCP) in Glossary at MDN.
- PerformancePaintTiming at MDN.
- Largest Contentful Paint (LCP)
- Largest Contentful Paint (LCP) in Glossary at MDN.
- LargestContentfulPaint at MDN.
- DOMContentLoaded Event (DCL)
- DOMContentLoaded Event (DCL) at MDN.
- Onload Event (L)
- Onload Event (L) at MDN.
Hover over a marker name at the bottom of the trace to see its timestamp.
View custom timings
On the Timings track, view your custom performance markers such as:
performance.mark()calls.performance.measure()calls.
Select a marker to see more details in the Summary tab, including its timestamp, total time, self time, and the detail object. For performance.mark() and performance.measure() calls, the tab also shows stack traces.
View interactions
Use the Interactions section to find and analyze user interactions that happened during the recording:
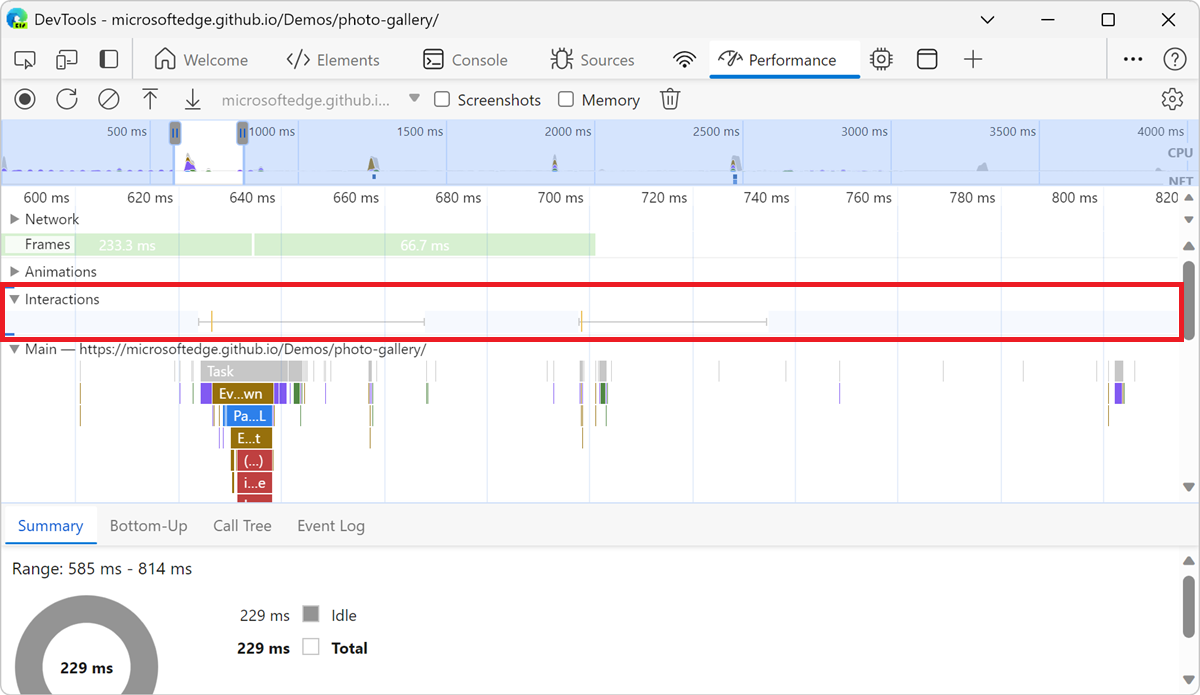
A red line at the bottom of an interaction represents time spent waiting for the main thread.
Click an interaction to view more information about it in the Summary tab.
View layout shifts
View layout shifts on the Layout shifts track. Shifts are shown as purple diamonds and are grouped in clusters (purple lines) based on their proximity on the timeline.
To highlight an element that caused a layout shift in the viewport, hover over the corresponding diamond.
To see more information about a layout shift or shifts in the Summary tab with timings, scores, elements, and potential culprits, click the corresponding diamond or cluster.
For more information, see Cumulative Layout Shift (CLS) at MDN.
View animations
View animations on the Animations track. Animations are named as corresponding CSS properties or elements if any, for example, transform or my-element. Non-compositing animations are marked with red triangles in the top right corner.
Select an animation to see more details in the Summary tab, including reasons for compositing failures.
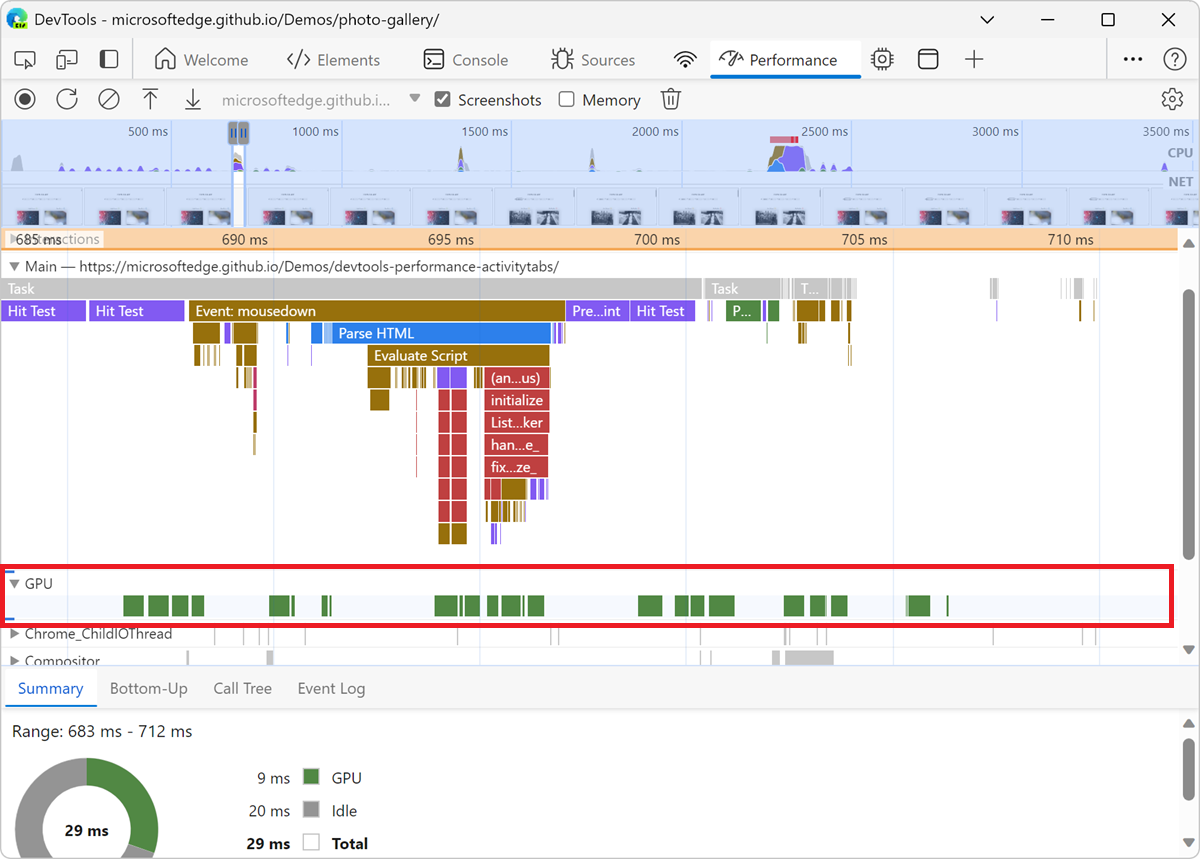
View GPU activity
View GPU activity in the GPU section of the Performance tool:
View raster activity
View raster activity in the Thread Pool section.
Analyze frames per second (FPS)
DevTools provides two ways to analyze frames per second:
Use the Frames section to view how long a particular frame took. See The Frames section, below.
Use the FPS meter for a realtime estimate of FPS as the page runs. See View frames per second in realtime with the FPS meter, below.
The Frames section
The Frames section tells you exactly how long a particular frame took.
Hover over a frame to view a tooltip with more information about it:
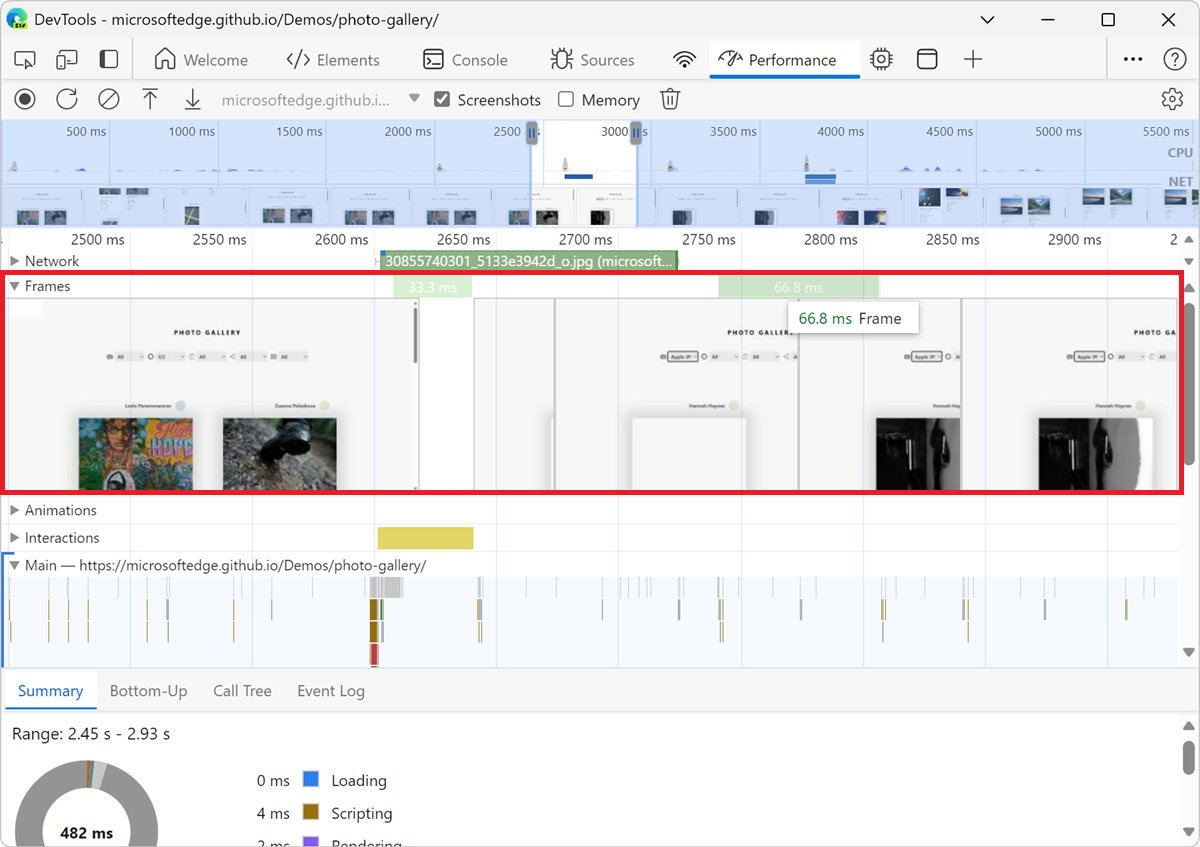
The above example shows a tooltip when you hover over a frame.
The Frames section can show four types of frames:
Idle frame (white). No changes.
Frame (green). Rendered as expected and in time.
Partially presented frame (yellow with a sparse wide dash-line pattern). Microsoft Edge did its best to render at least some visual updates in time. For example, in case the work of the main thread of the renderer process (canvas animation) is late but the compositor thread (scrolling) is in time.
Dropped frame (red with a dense solid-line pattern). Microsoft Edge can't render the frame in reasonable time.
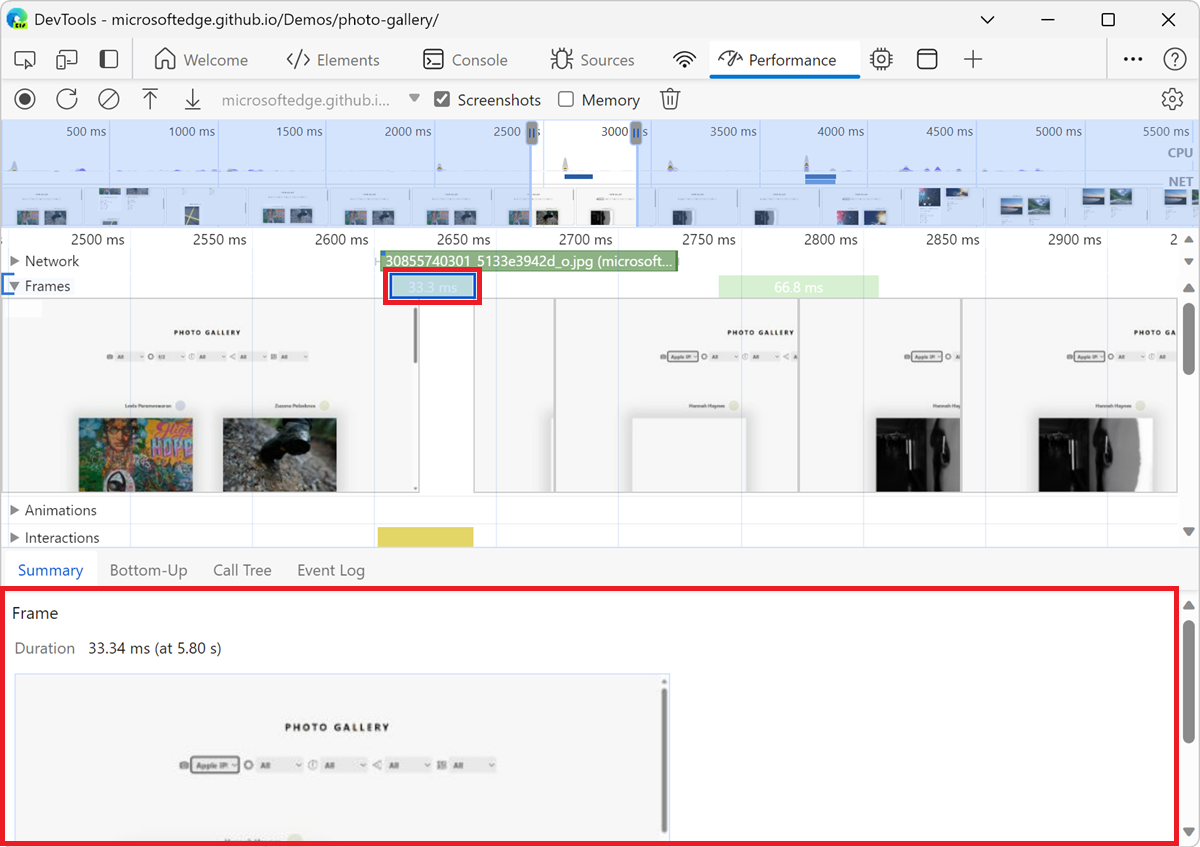
Click a frame to view more information about the frame in the Summary tab at the bottom of the Performance tool. DevTools outlines the selected frame in blue:
View network requests
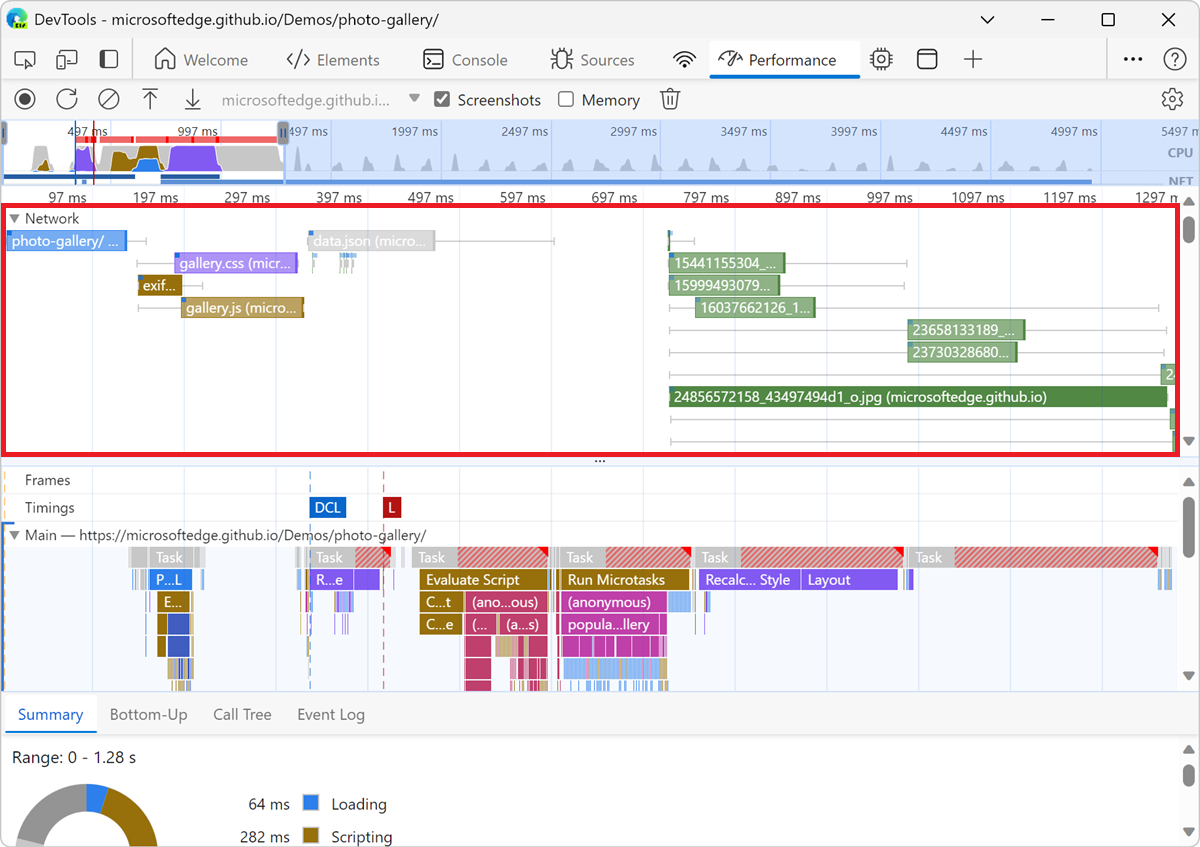
Expand the Network section to view a waterfall of network requests that occurred during the recording:
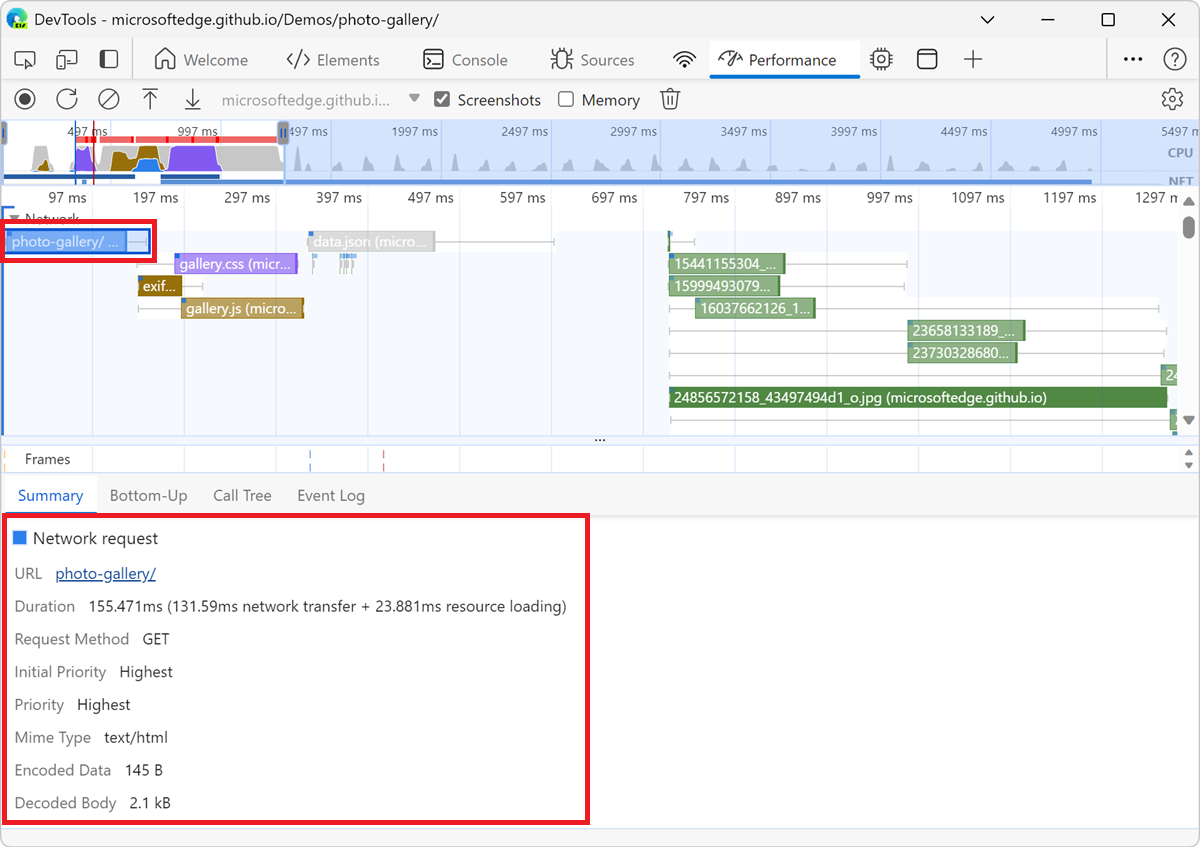
Click on a request to view more information about it in the Summary tab:
Requests in the Network section are color-coded as follows:
- Blue background: HTML request.
- Purple background: CSS request.
- Dark yellow background: JS request.
- Green background: image request.
Requests have squares in the top-left corner:
- A darker-blue square in the top-left of a request means it's a higher-priority request.
- A lighter-blue square means lower-priority.
For example, in the previous figure, the photo-gallery request, in the top left corner of the Network section is higher-priority.
Requests might have lines on the left and right sides, and their bars might be split into two colors. Here's what these lines and colors represent:
The left line is everything up to the
Connection Startgroup of events, inclusive. In other words, it's everything beforeRequest Sent, exclusive.The light portion of the bar is
Request SentandWaiting (TTFB)for server response.The dark portion of the bar is
Content Download.The right line is essentially time spent waiting for the main thread. This isn't represented in the Timing tab.
View memory metrics
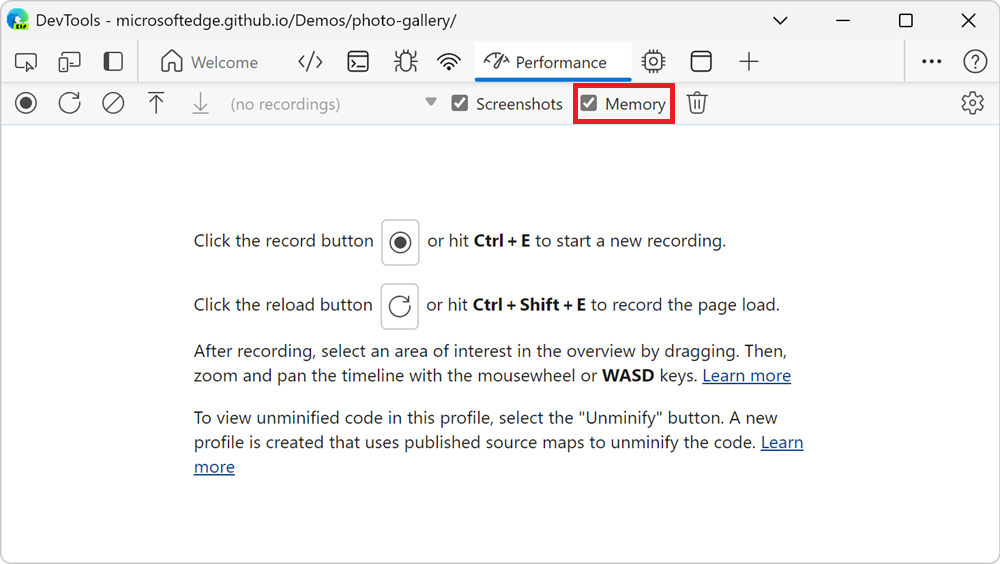
Select the Memory checkbox to view memory metrics in a performance recording:
DevTools displays a Memory chart, above the Summary tab. There is also a chart below the NET chart, called HEAP. The HEAP chart provides the same information as the JS Heap line in the Memory chart:
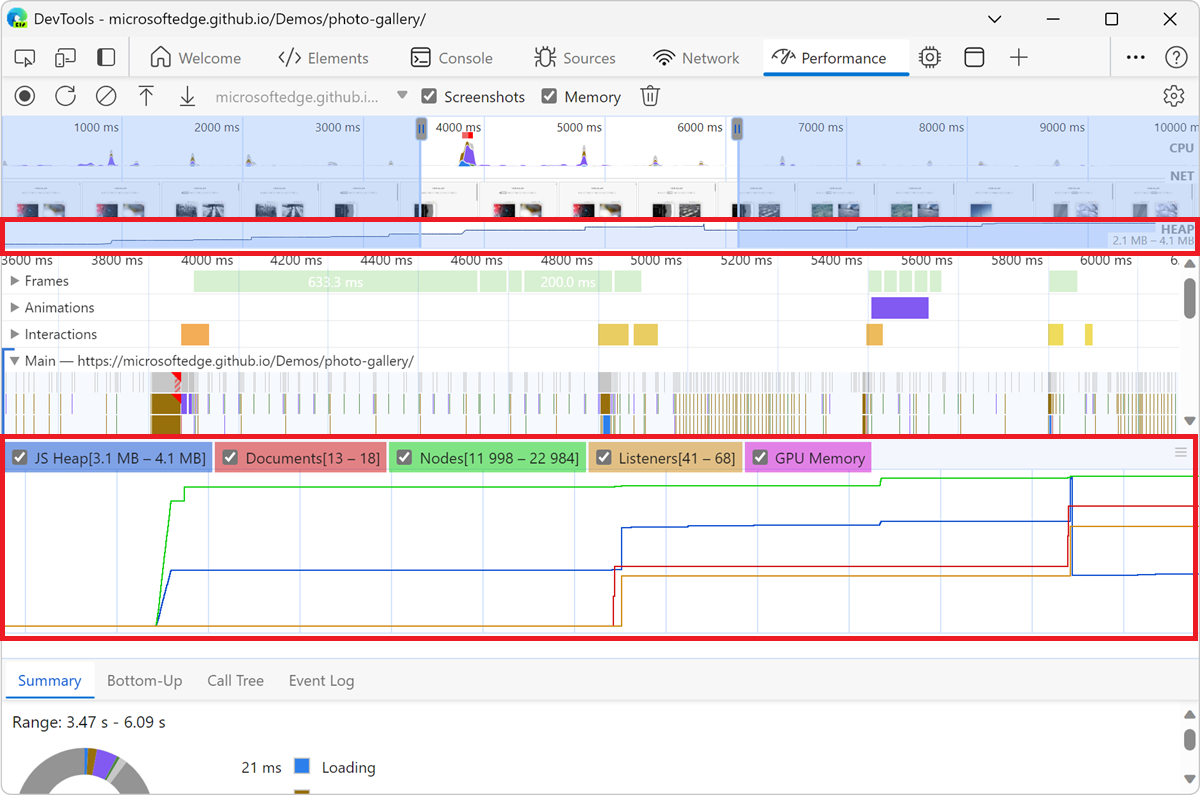
The colored lines on the chart map to the colored checkboxes above the chart. Clear a checkbox to hide that category from the chart.
The chart only displays the region of the recording that is currently selected. For example, in the previous figure, the Memory chart is only showing memory usage from around the 3600 ms mark to the 6200 ms mark.
See also:
View the duration of a portion of a recording
When analyzing a section like Network or Main, sometimes you need a more precise estimate of how long certain events took. Hold Shift, click and hold, and drag left or right to select a portion of the recording. At the bottom of your selection, DevTools shows how long that portion took:
View a screenshot
To learn how to turn on screenshots, see Capture screenshots while recording, above.
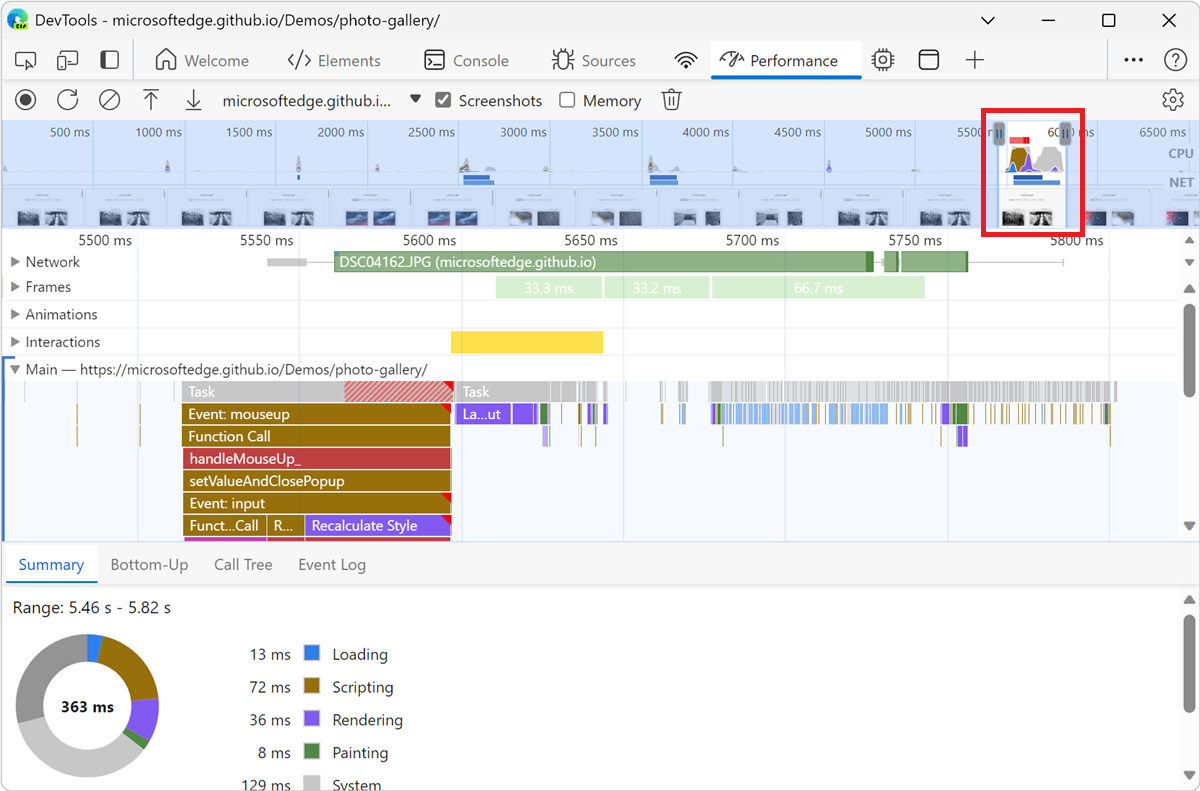
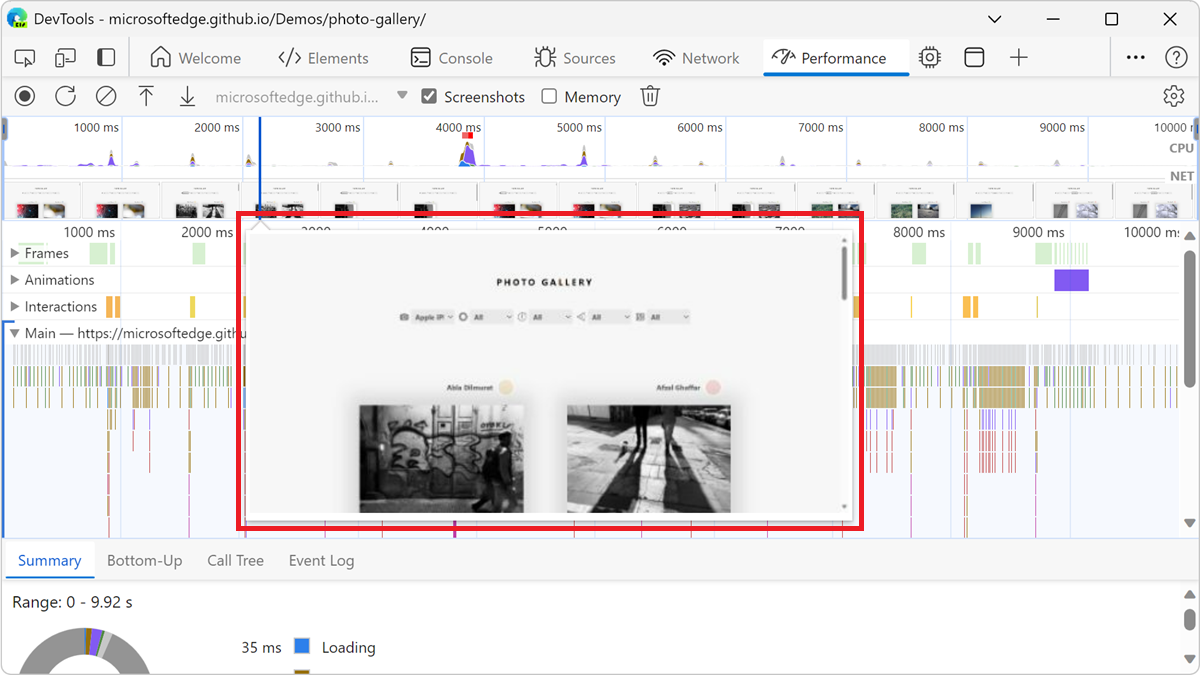
To view a screenshot of how the page looked during that moment of the recording, hover over the Overview. The Overview is the section that contains the CPU and NET charts:
You can also view screenshots by selecting a frame in the Frames section. DevTools displays a small version of the screenshot in the Summary tab:
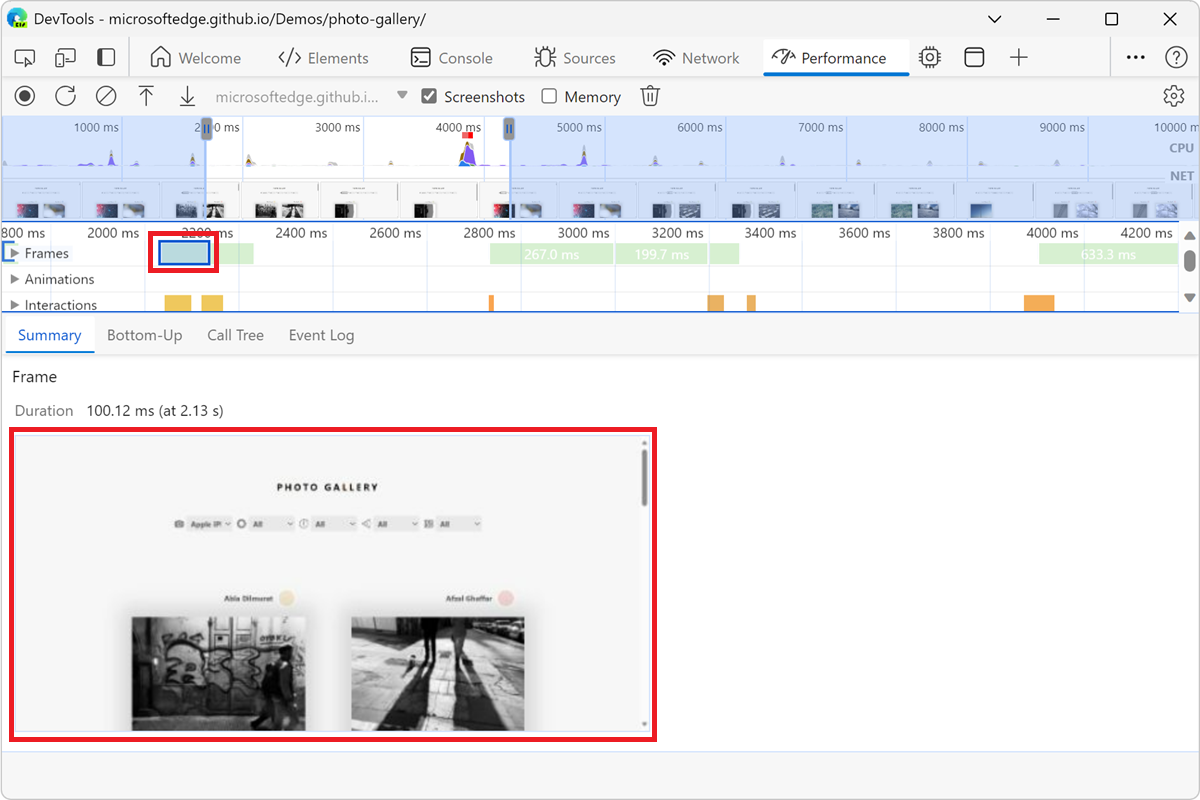
To zoom in on the screenshot, click the thumbnail in the Summary tab.
View layers information
To view advanced layers information about a frame:
In the Performance tool, click the Capture settings (
) button, and then select the Enable advanced rendering instrumentation (slow) checkbox.In the Frames section, select a frame. DevTools displays information about the layers in the Layers tab at the bottom of the Performance tool:
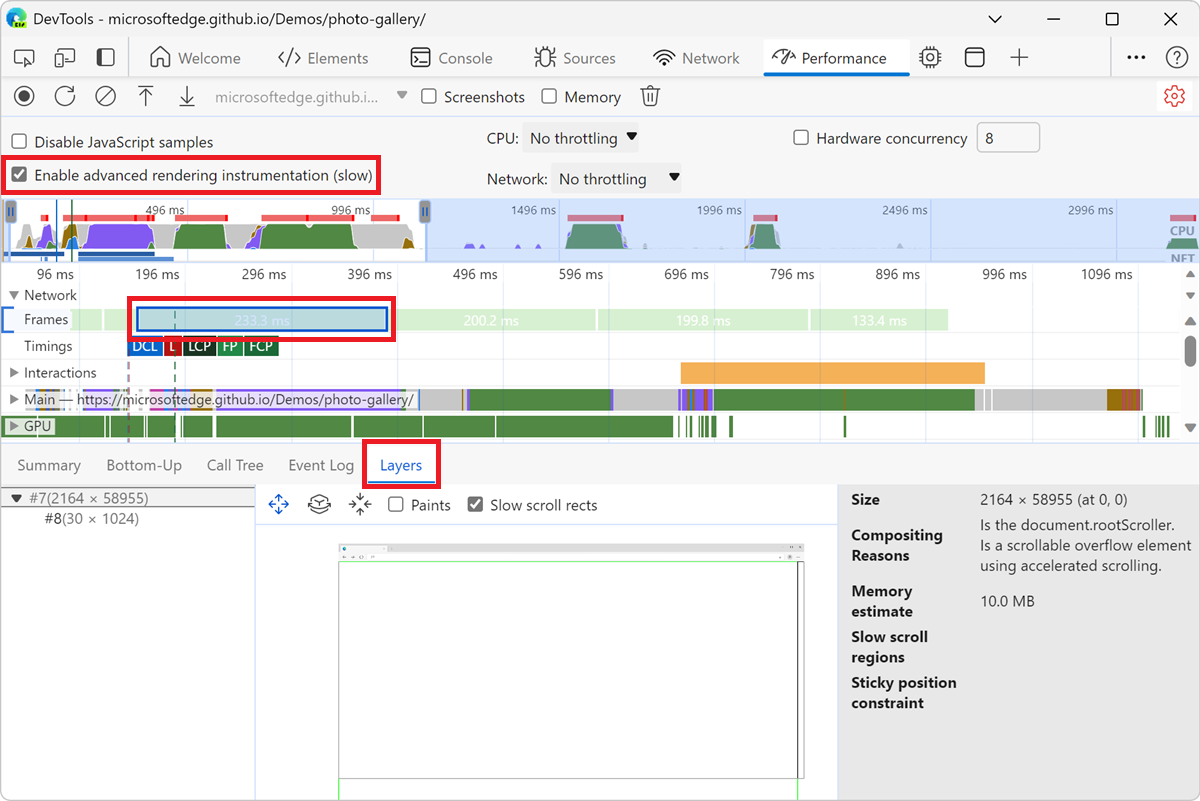
The Layers tab works like the Composited Layers tab in the 3D View tool. To learn how to interact with the Layers tab, see Navigate webpage layers, z-index, and DOM using the 3D View tool.
View paint profiler
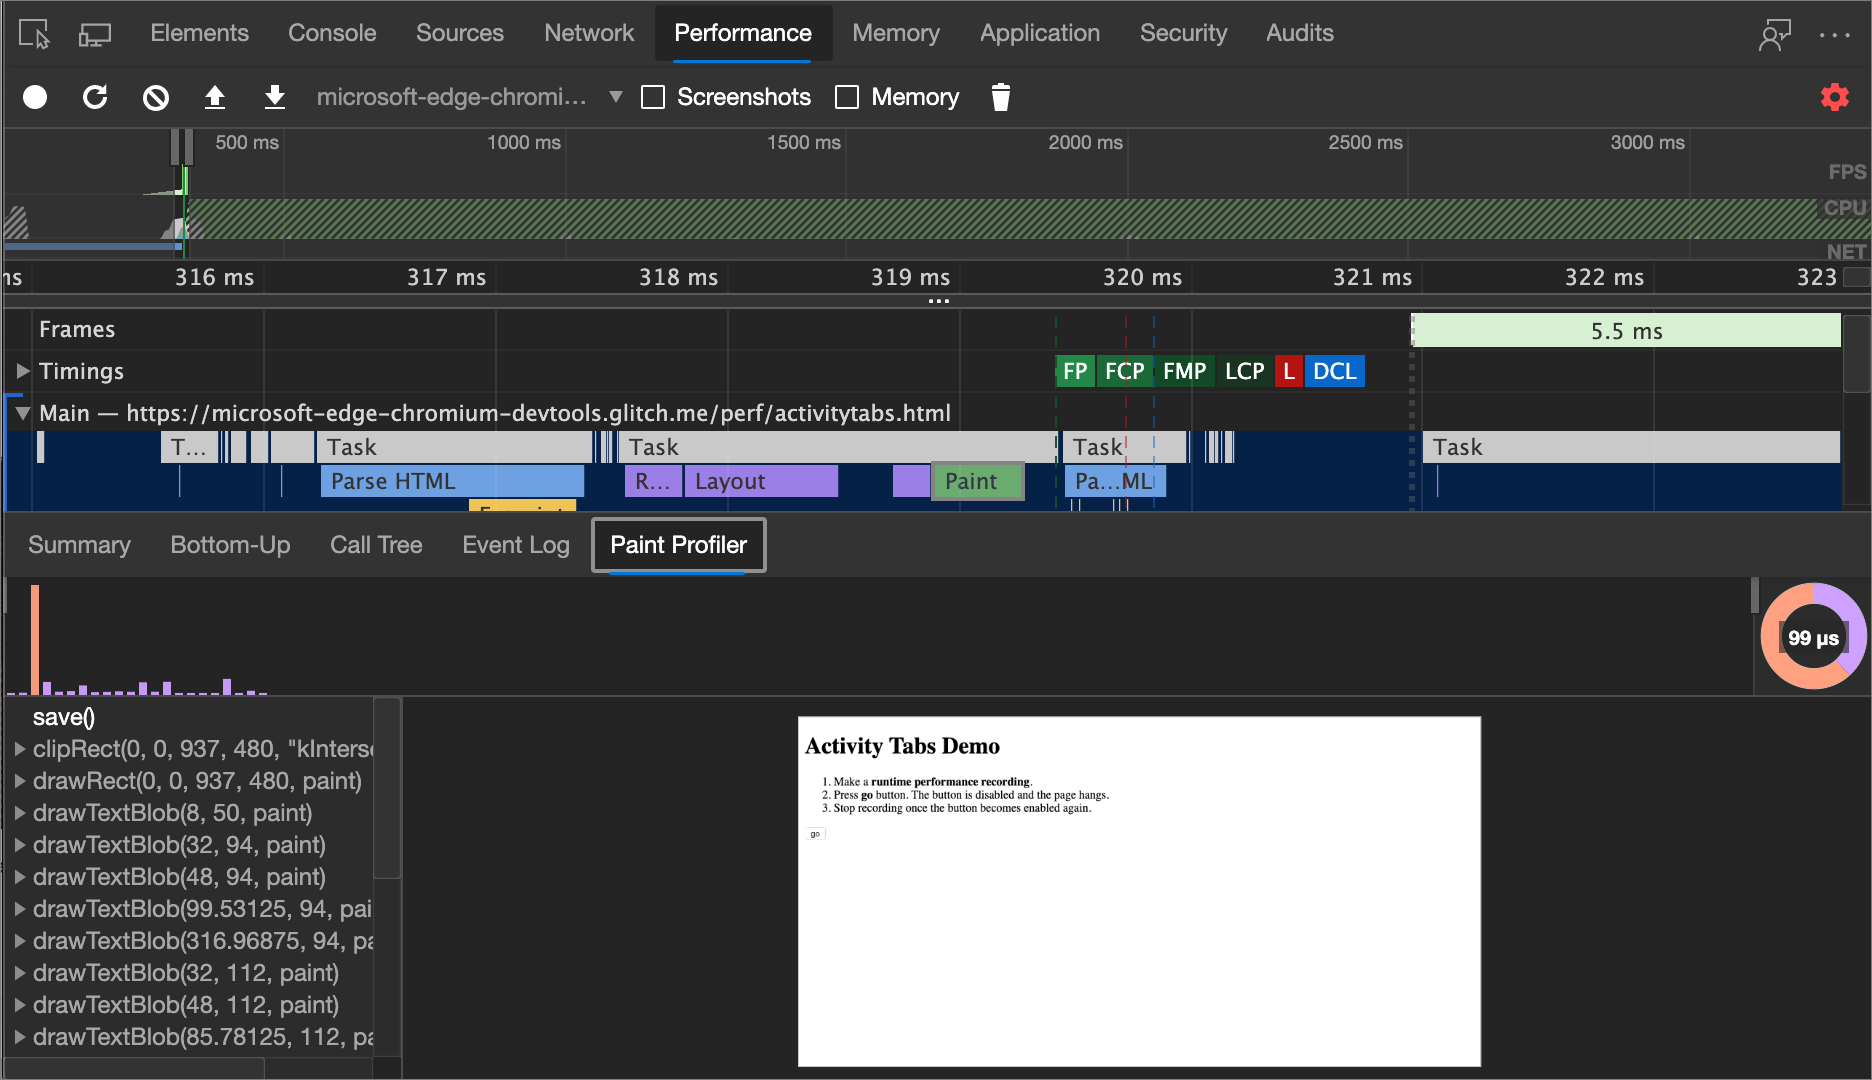
To view advanced information about a paint event:
In the Performance tool, click the Capture settings (
) button, and then select the Enable advanced rendering instrumentation (slow) checkbox.Select a Paint event in the Main section. DevTools displays information about the paint event in the Paint Profiler tab:
View CSS selector statistics
To view statistics about the selectors of the CSS rules that got recalculated during a performance recording:
In the Performance tool, click the Capture settings (
) button, and then select the Enable advanced rendering instrumentation (slow) checkbox.DevTools displays aggregate information about the selectors of the CSS rules that were recalculated during the recording in the Selector Stats tab:
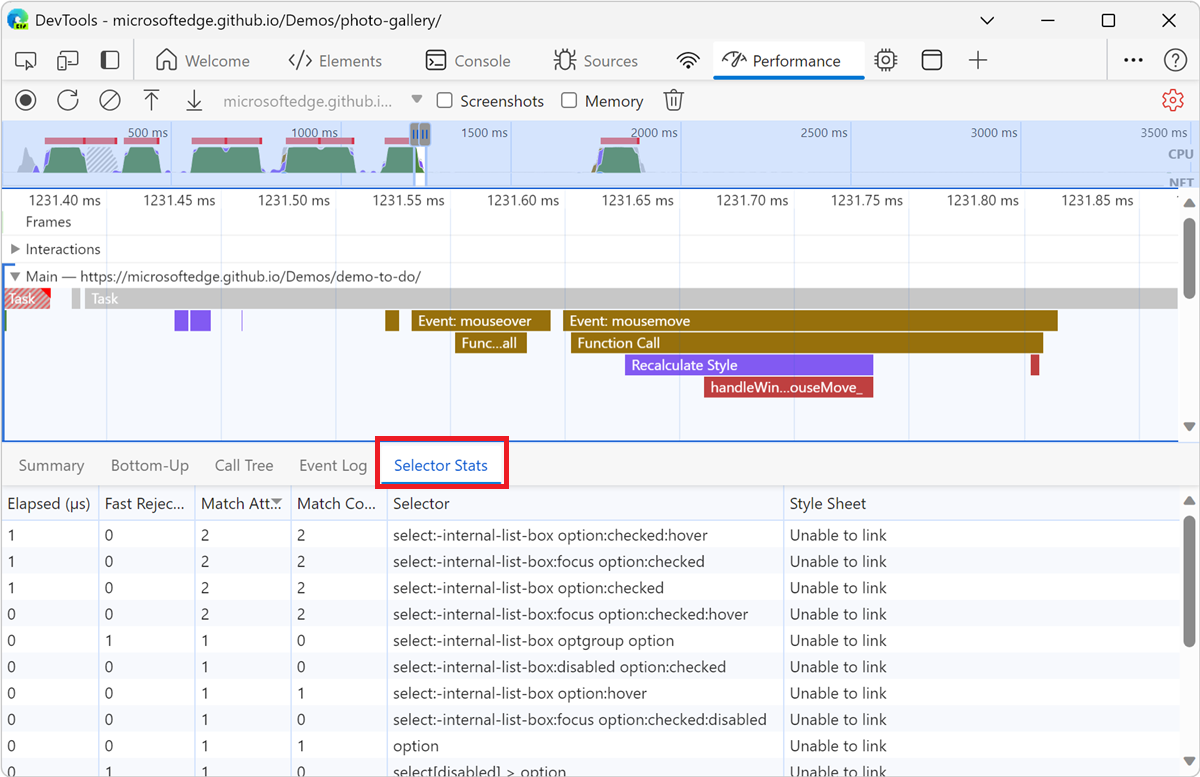
- In the Main section, select a Recalculate Style event. In the Selector Stats tab, DevTools displays information about the selectors of the CSS rules that were recalculated during that event.
See also:
View messages between windows, iframes, and dedicated workers
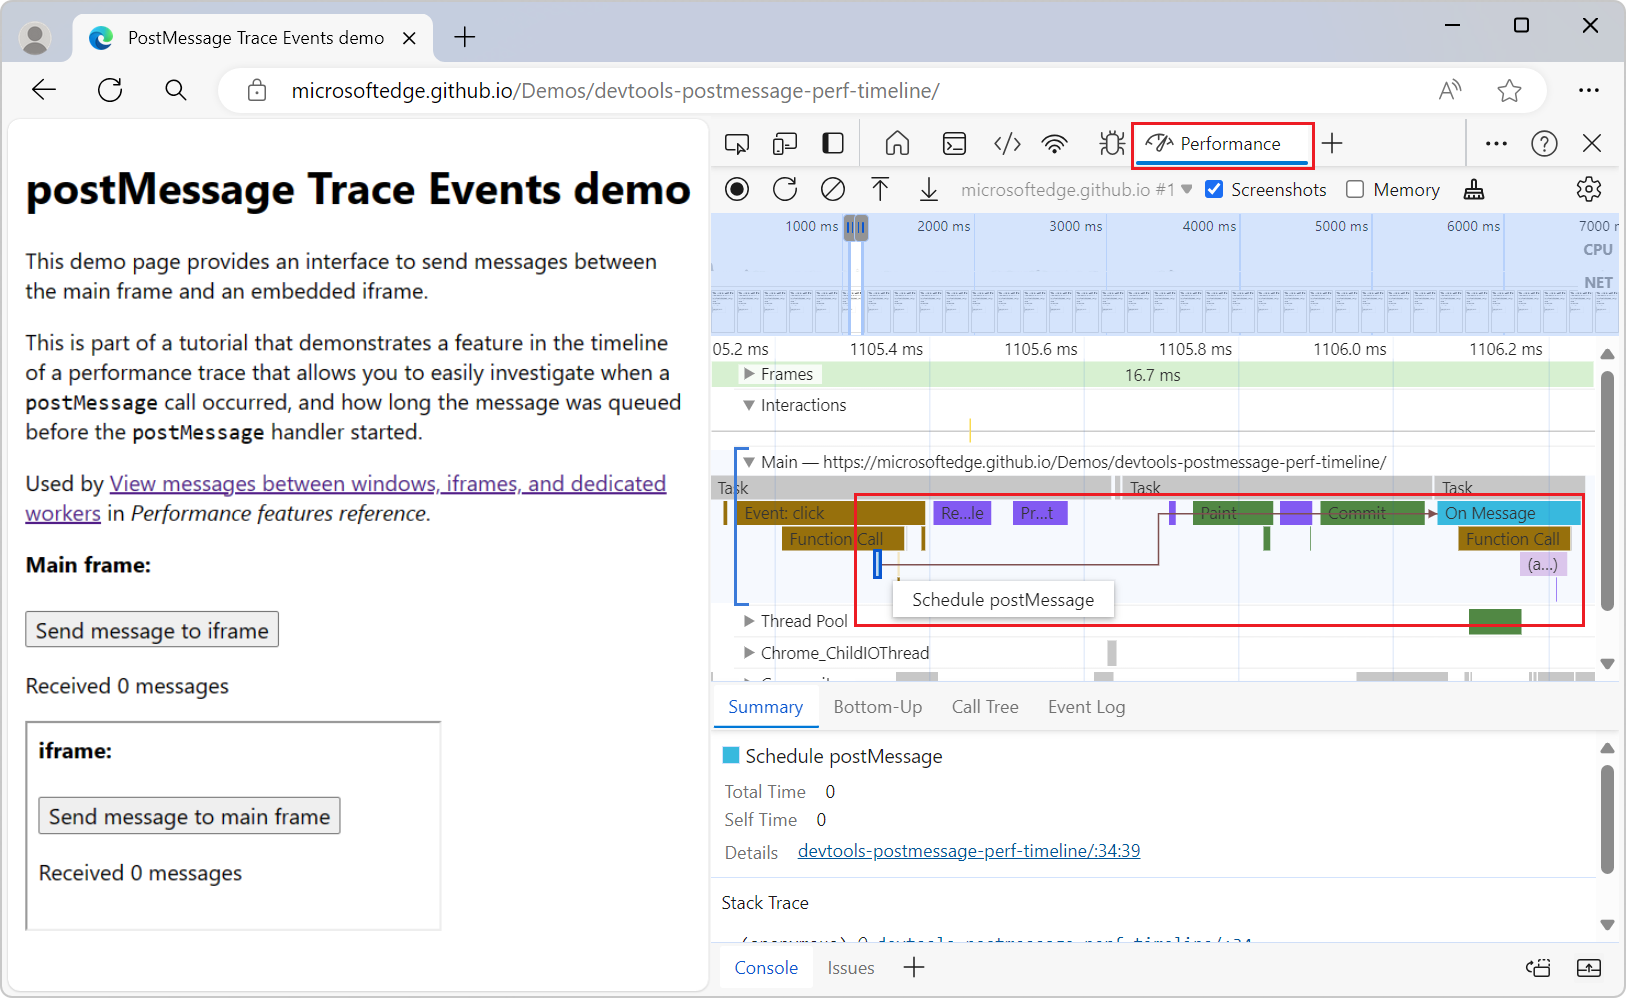
The DevTools experiment Performance panel: show postMessage dispatch and handling flows improves the Performance tool's Main section to help you quickly identify postMessage events and handlers, by distinguishing events that are triggered by the postMessage method from other events that are displayed in the Performance tool. This experiment helps you investigate performance issues that are related to posting messages across various threads of an application.
Without this experiment, events that are triggered by dispatching and handling messages between threads of an application appear as generic scripting function-call events. With this experiment enabled:
postMessagedispatch events appear as Schedule postMessage.postMessagehandler events appear as On Message:
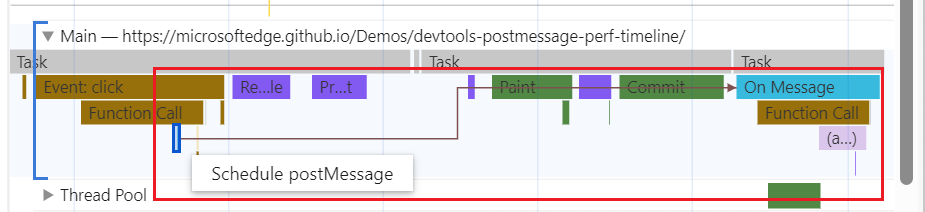
This experiment helps you investigate when a postMessage call occurred, and how long the message was queued before the postMessage handler starts. The dispatch events are linked to handler events by initiator arrows that appear when you click on either type of event:
To use this feature, in DevTools, select Customize and control DevTools (![]() ) > Settings > Experiments, select the checkbox Performance panel: show postMessage dispatch and handling flows, click the Close (X) button, and then click the Reload DevTools button.
) > Settings > Experiments, select the checkbox Performance panel: show postMessage dispatch and handling flows, click the Close (X) button, and then click the Reload DevTools button.
See also:
- Performance recording event reference
- postMessage Trace Events demo (rendered)
- postMessage Trace Events demo (source code)
View WebSocket messages
WebSocket activities are displayed in the Network track in the Performance tool, to help correlate JavaScript activity with WebSocket messages. This can help identify whether latency issues are coming from the client's parsing of a message, or from the server's response.
To view WebSocket messages in the Performance tool:
Go to a webpage that sends WebSocket messages, such as Simple chat app, in a new window or tab.
Right-click the webpage, and then select Inspect.
DevTools opens.
In the Activity Bar, select the Performance (
) tool.In the upper left of the Performance tool, click the Record (
) button.In the chat webpage, in the User Name text box, enter a name, such as "John", and then click the Connect button.
At the bottom of the chat form, a message is displayed, such as "John:v8g... connected."
In the Send a message text box, enter a message, such as "Hello", and then click the Send button.
In the chat app, the message is displayed, such as "Hello":

WebSocket traffic is generated.
In the upper left of the Performance tool, click the Stop (
 ) button.
Or, in the middle of the Performance tool, click the Stop button.
In the Performance tool, the timeline is displayed.
Expand the Network track.
Click a vertical gold line.
At the bottom of the Performance tool, in the Summary tab, information about the selected WebSocket message is displayed, such as:
- Send WebSocket handshake
- Receive WebSocket handshake
- Receive WebSocket message:

See also:
- Analyze the messages of a WebSocket connection in Network features reference.
- Track event initiators, above.
- Analyze runtime performance (tutorial)
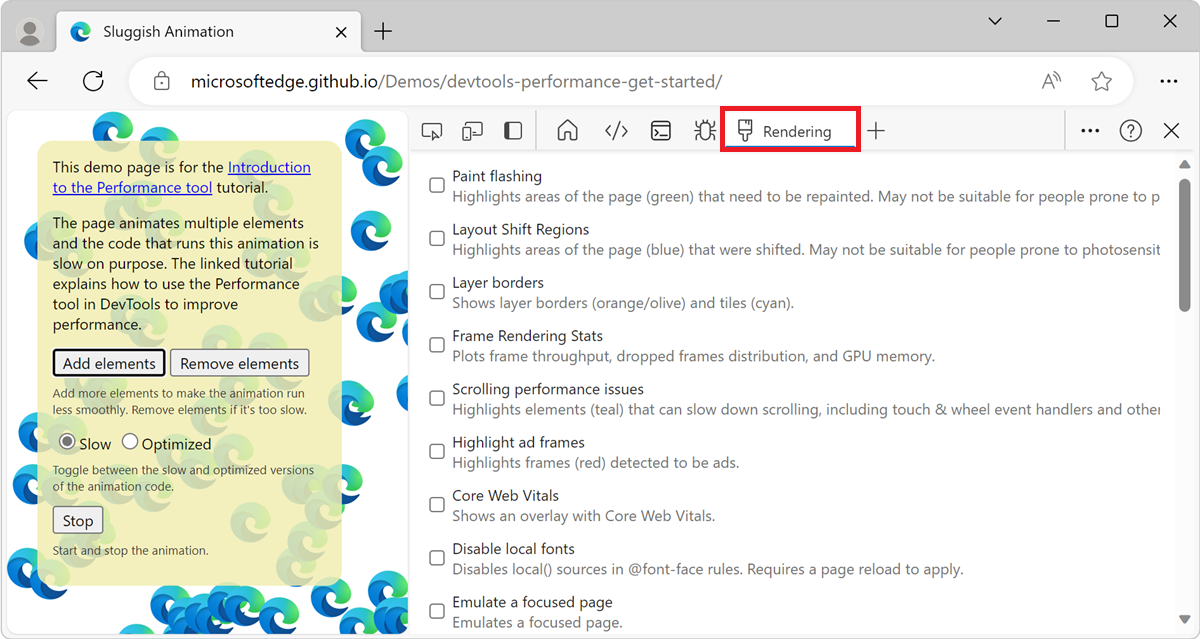
Analyze rendering performance with the Rendering tool
Use the Rendering tool to help visualize the rendering performance of your page. The Rendering tool is a Quick View tool; if you open it from the Command Menu, it opens at the bottom of DevTools.
To open the Rendering tool:
Open a webpage, such as Sluggish Animation, in a new window or tab.
Right-click the webpage, and then select Inspect.
DevTools opens.
If the Quick View panel isn't shown, select Customize and control DevTools (
 ) > Toggle Quick View panel.
Or, press Esc.
On the Quick View toolbar, click the More tools (
) button, and then select Rendering.The Rendering tool opens in the Quick View panel:
See also:
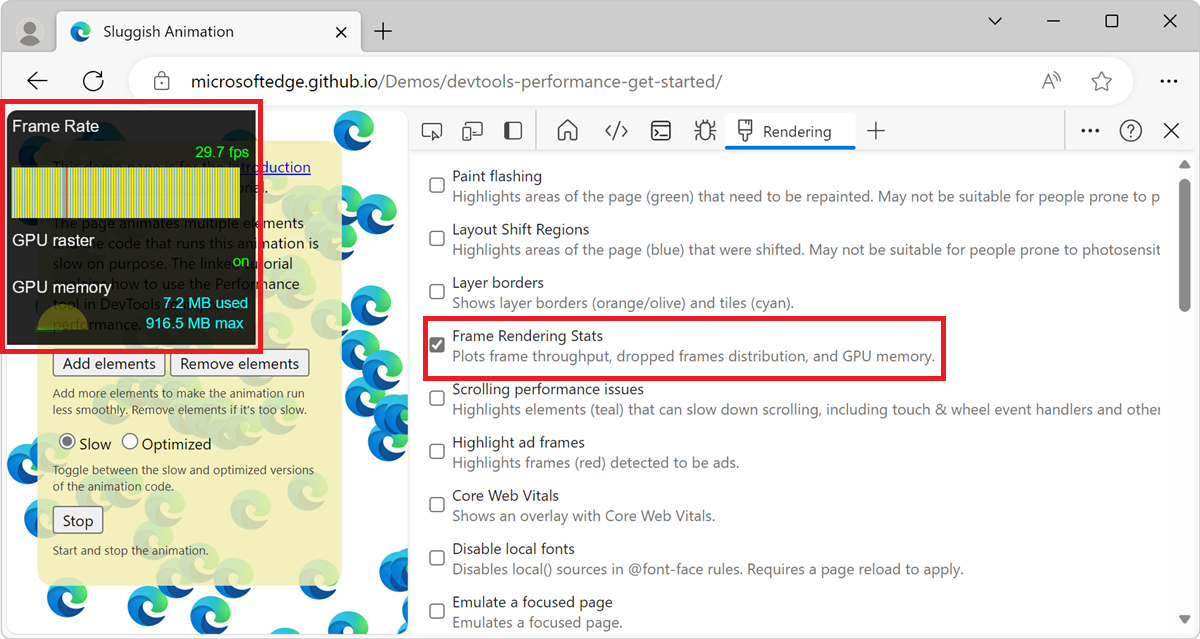
View frames per second in realtime with the FPS meter
The FPS meter is an overlay that appears in the top-left corner of the rendered webpage. It provides a realtime estimate of FPS as the page runs. To open the FPS meter:
Open the Rendering tool. See Analyze rendering performance with the Rendering tool, above.
Select the Frame Rendering Stats checkbox. The FPS meter overlay appears in the rendered webpage:
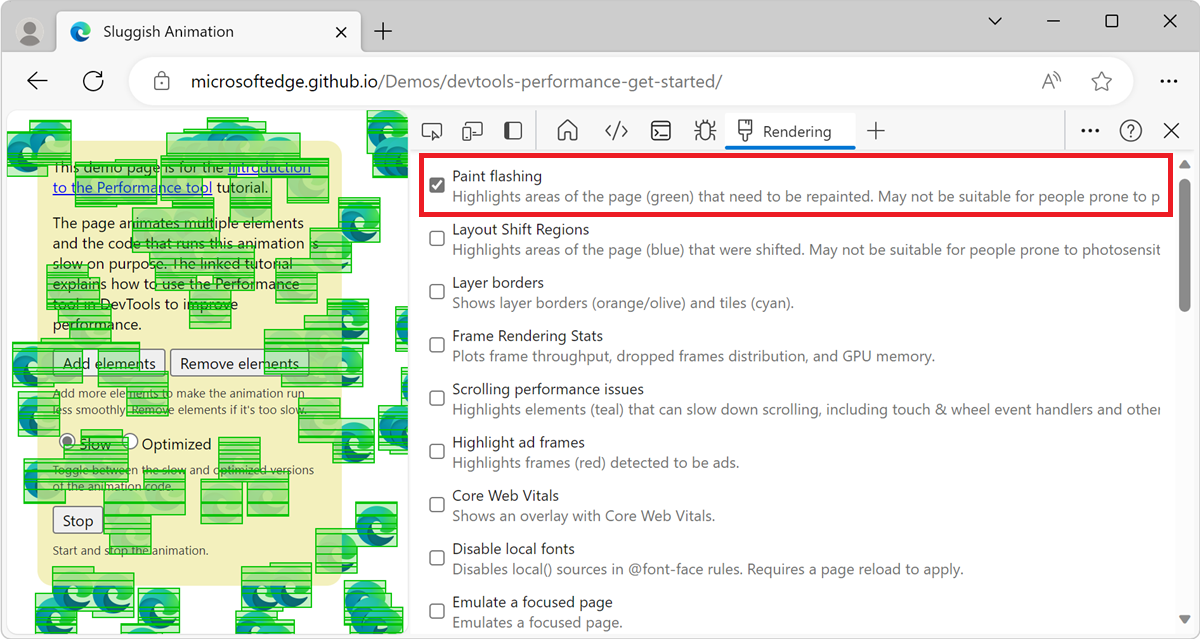
View painting events in realtime with Paint Flashing
Use Paint Flashing to get a realtime view of all paint events on the page. Whenever a part of the page gets re-painted, DevTools outlines that section in green.
To turn on Paint Flashing:
Open the Rendering tool. See Analyze rendering performance with the Rendering tool, above.
Select the Paint Flashing checkbox. Green outlines appear in the rendered webpage:
View an overlay of layers with Layer Borders
To view an overlay of layer borders and tiles on top of the page:
Open the Rendering tool, as described in Analyze rendering performance with the Rendering tool, above.
Select the Layer Borders checkbox. Layer borders appear in the rendered webpage:
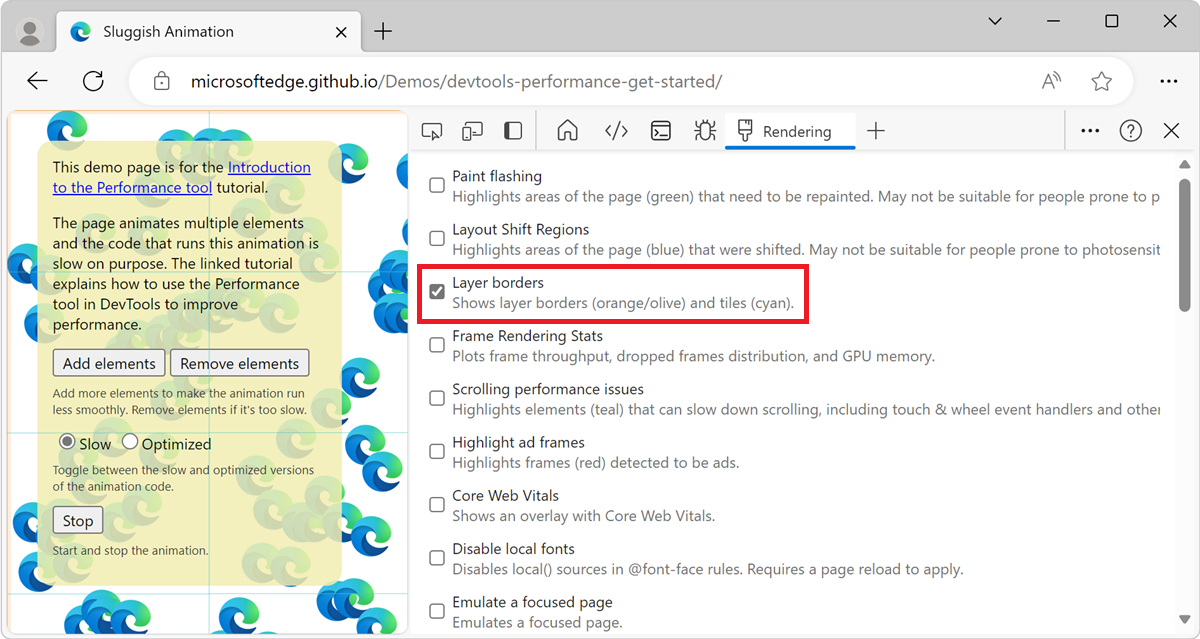
See the comments in debug_colors.cc for an explanation of the color-codings.
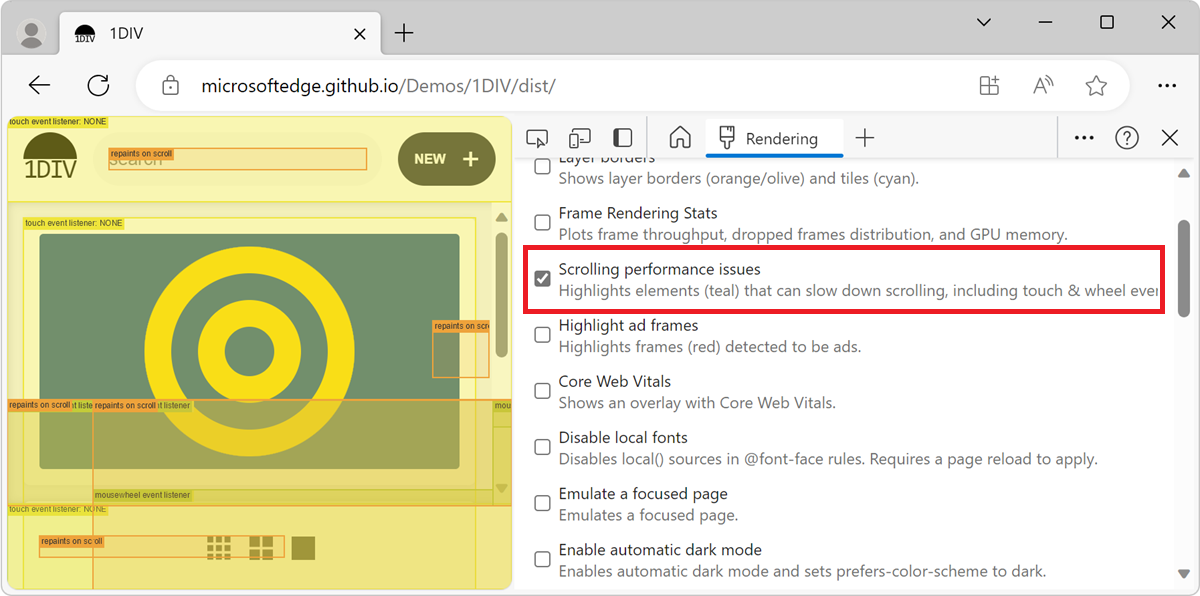
Find scroll performance issues in realtime
Use the Scrolling Performance Issues checkbox to identify elements of the page that have event listeners related to scrolling that may harm the performance of the page. DevTools outlines the potentially problematic elements in teal.
To view scroll performance issues:
Open the Rendering tool, as described in Analyze rendering performance with the Rendering tool, above.
Select the Scrolling Performance Issues checkbox. Potentially problematic elements are outlined:
See also:
- Slow scroll rects (checkbox) in Navigate webpage layers, z-index, and DOM using the 3D View tool.
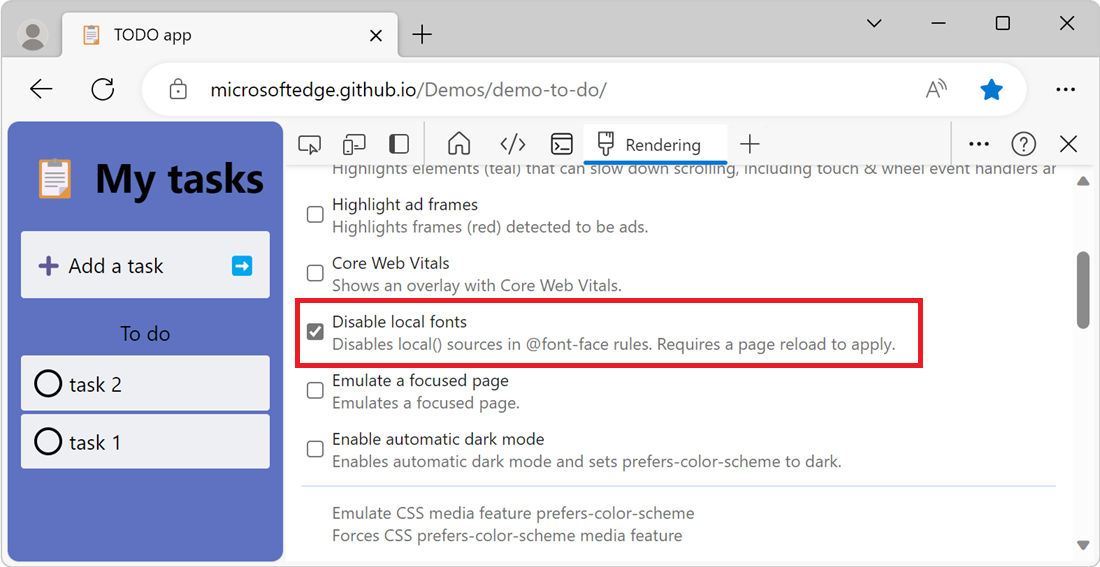
Disable local fonts
In the Rendering tool, use the Disable local fonts checkbox to emulate missing local() sources in @font-face rules.
For example, when the Rubik font is installed on your device and the @font-face src rule uses it as a local() font, Microsoft Edge uses the local font file from your device.
When Disable local fonts is selected, DevTools ignores the local() fonts and fetches each font from the network:
This feature is useful if you use two different copies of the same font during development, such as:
- A local font for your design tools.
- A web font for your code.
Use Disable local fonts to make it easier to:
- Debug and measure loading performance and optimization of web fonts.
- Verify accuracy of your CSS
@font-facerules. - Discover differences between local versions installed on your device and a web font.
Visualize memory leaks (Performance tool: Memory checkbox)
As a starting point to investigate webpage memory usage, use the Performance tool's Memory checkbox. (Or, Monitor memory use in realtime (Browser Task Manager).)
The Performance tool helps you visualize the memory use of a page over time.
In DevTools, open the Performance tool.
Select the Memory checkbox.
Make a recording, per Record performance, above.
It's a good practice to start and end your recording with a forced garbage collection. To force garbage collection, click the collect garbage ![]() button while recording.
button while recording.
To demonstrate memory recordings, consider the following code:
var x = [];
function grow() {
    for (var i = 0; i < 10000; i++) {
        document.body.appendChild(document.createElement('div'));
    }
    x.push(new Array(1000000).join('x'));
}
document.getElementById('grow').addEventListener('click', grow);
Every time that the button referenced in the code is clicked, 10,000 div nodes are appended to the document body, and a string of 1,000,000 x characters is pushed onto the x array. Running the previous code produces a recording in the Performance tool:
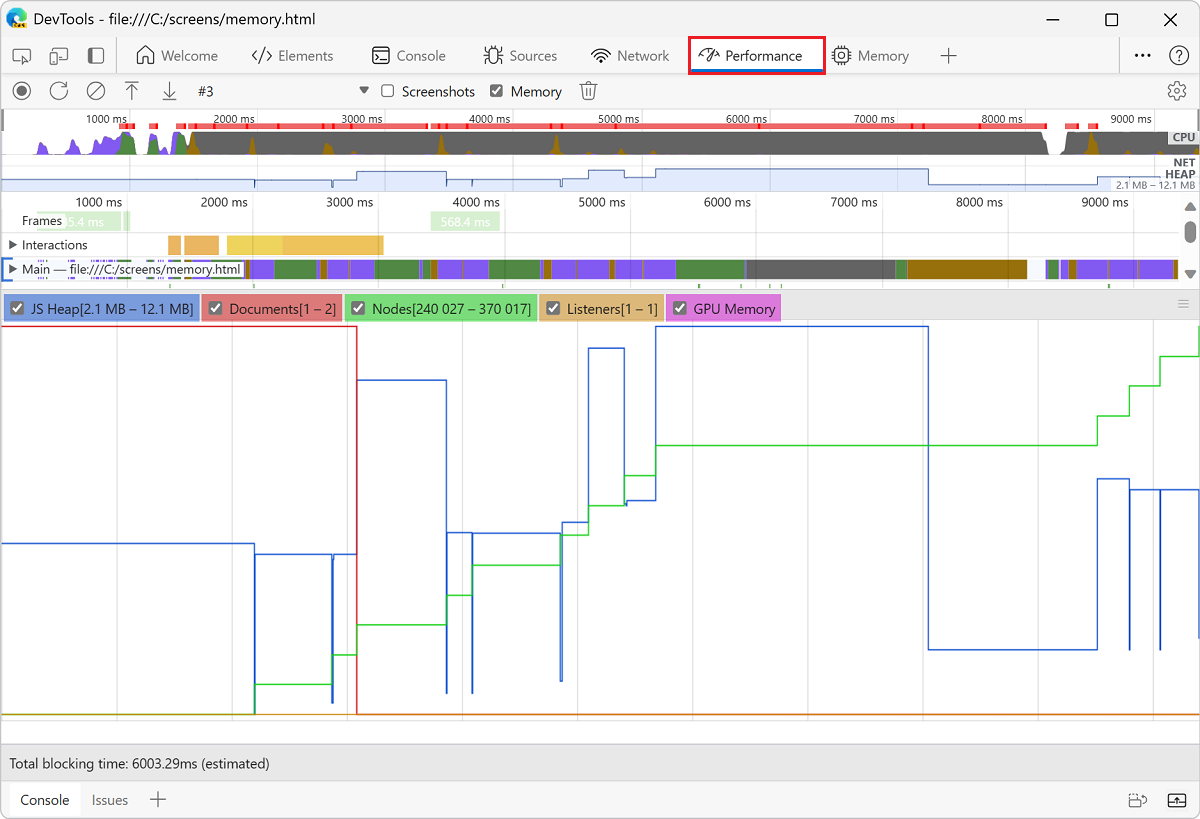
First, an explanation of the user interface. The HEAP graph in the Overview pane (below NET) represents the JS heap. Below the Overview pane is the Counter pane. The memory usage is broken down by JS heap (same as HEAP graph in the Overview pane), documents, DOM nodes, listeners, and GPU memory. Clear a checkbox to hide it from the graph.
Now, an analysis of the code compared with the previous figure. If you review the node counter (the green graph), it matches up cleanly with the code. The node count increases in discrete steps. You can presume that each increase in the node count is a call to grow().
The JS heap graph (the blue graph) is not as straightforward. In keeping with best practices, the first dip is actually a forced garbage collection (click the collect garbage ![]() button).
button).
As the recording progresses, the JS heap size spikes are displayed. This is natural and expected: the JavaScript code is creating the DOM nodes on every button you click, and is doing a lot of work when it creates the string of one million characters.
The key thing here is the fact that the JS heap ends higher than it began (the "beginning" here being the point after the forced garbage collection). In the real world, if you saw this pattern of increasing JS heap size or node size, it would potentially indicate a memory leak.
See also:
- View memory metrics, above.
Note
Portions of this page are modifications based on work created and shared by Google and used according to terms described in the Creative Commons Attribution 4.0 International License. The original page is found here and is authored by Kayce Basques.
![]() This work is licensed under a Creative Commons Attribution 4.0 International License.
This work is licensed under a Creative Commons Attribution 4.0 International License.