Experimental features in Microsoft Edge DevTools
Microsoft Edge DevTools provide access to experimental features that are still in development. This article lists and describes the experimental features that are in either:
- The latest version of the Canary preview channel of Microsoft Edge.
- The latest version of the Stable release of Microsoft Edge.
All channels of Microsoft Edge have experimental features. You can get the latest experimental features by using the Microsoft Edge Canary channel. To view the full list of experiments that are available in your version of Microsoft Edge, see the Settings > Experiments page in DevTools.
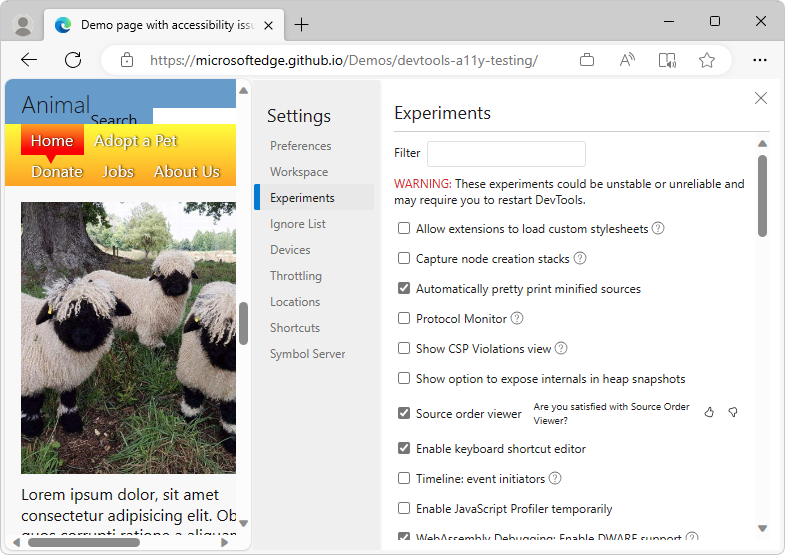
These experiments could be unstable or unreliable and may require you to restart DevTools.
Experiments which are turned on by default
The following experimental features are turned on by default. You can use these features right away, without changing any settings. You can turn off these default experimental features, if needed.
Turned on by default in Microsoft Edge Canary 125:
- Resolve variable names in expressions using source maps
- Set all breakpoints eagerly at startup
- Enable background page selector (e.g. for prerendering debugging)
- Autofill panel
- Enable webhint
- Show issues in Elements
- Open source files in Visual Studio Code
- Enable Speculative Loads Panel in Application panel
Turned on by default in Microsoft Edge Stable 123:
- Resolve variable names in expressions using source maps
- Set all breakpoints eagerly at startup
- Enable background page selector (e.g. for prerendering debugging)
- Show warning about Self-XSS when pasting code
- Enable webhint
- Show issues in Elements
- Open source files in Visual Studio Code
- View console.profile() results in the Performance panel for Node.js
- Enable Speculative Loads Panel in Application panel
Turning an experiment on or off
Experimental features are constantly being updated and might cause performance issues. This is one reason you might want to turn off an experiment.
To turn an experiment on or off in Microsoft Edge:
To open DevTools, right-click the webpage, and then select Inspect. Or, press Ctrl+Shift+I (Windows, Linux) or Command+Option+I (macOS). DevTools opens.
In DevTools, on the main toolbar, click the Customize and control DevTools (
 ) button, and then click the Settings (
 ) button. Or, press Shift+?.
On the left side of the Settings panel, select the Experiments page:
Select or clear the checkbox for an experiment. Some experiments are selected by default.
Click Close (
 ) in the upper right of DevTools Settings.
Click the Reload DevTools button.
Restoring defaults for which experiments are selected
To restore the default settings for which experimental features are turned on:
To open DevTools, right-click the webpage, and then select Inspect. Or, press Ctrl+Shift+I (Windows, Linux) or Command+Option+I (macOS). DevTools opens.
In DevTools, on the main toolbar, click the Settings (
) button. Or, press Shift+?. The Settings panel opens, with the Preferences page selected.At the bottom of the Preferences page, click the Restore defaults and refresh button, and then click Close (
).
Filtering the experiments
You can filter the experimental features by text included in the title.
To open DevTools, right-click the webpage, and then select Inspect. Or, press Ctrl+Shift+I (Windows, Linux) or Command+Option+I (macOS). DevTools opens.
In DevTools, on the main toolbar, click the Settings (
) button. Or, press Shift+?. The Settings panel opens, with the Preferences page selected.On the left side of the Settings panel, select the Experiments page.
Click in the Filter text box and enter text, such as timeline. As you type, only the matching checkboxes are shown in the Experiments page.
To end filtering, clear the Filter text box.
Providing feedback about the experiments
We're eager to hear your feedback about experimental features. To share feedback with us, Contact the Microsoft Edge DevTools team.
List of experiments
The experiments checkboxes that appear in the latest version of the Canary preview channel of Microsoft Edge are listed below. The Stable release is also noted, following behind the addition or removal of checkboxes in Canary.
Allow extensions to load custom stylesheets
Some Microsoft Edge Add-ons can define custom color themes for DevTools. If you install an add-on that defines a custom color theme for DevTools, you need to enable the Allow extensions to load custom stylesheets experiment to view the add-on themes.
See also:
Status:
- This checkbox is present in Microsoft Edge Canary 125.
- This checkbox is present in Microsoft Edge Stable 123.
Capture node creation stacks
To capture JavaScript stack traces when DOM nodes are added to the DOM at runtime, enable this experiment. This experiment adds the Stack Trace tab in the Elements tool, grouped with the Styles tab:
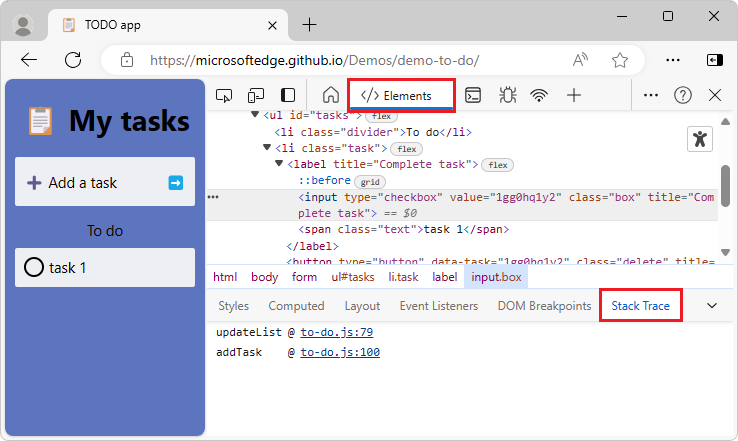
After you enable the experiment, you can test it as follows:
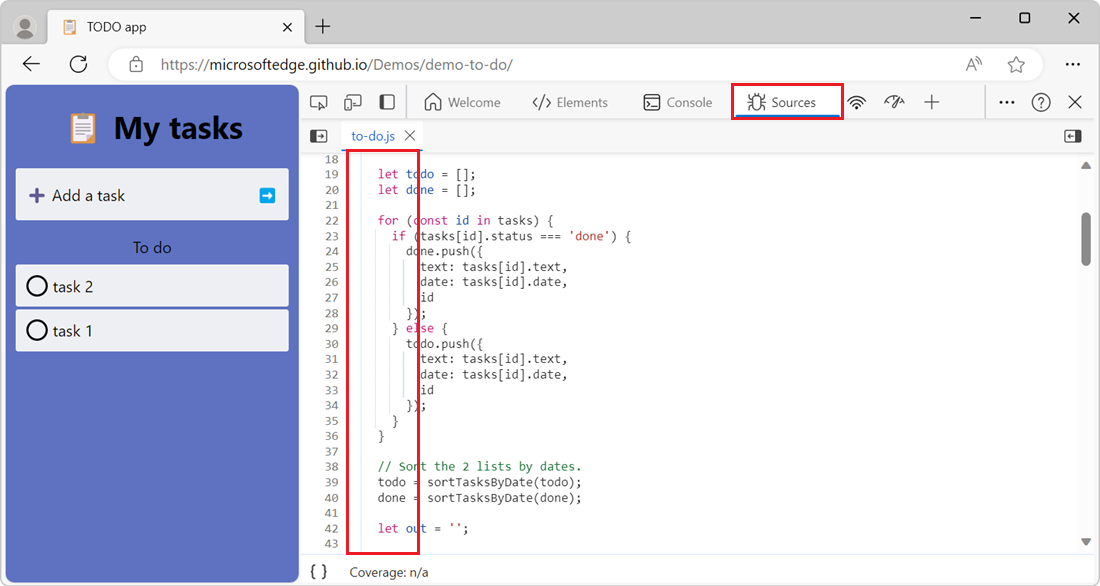
- In a new window or tab, open a webpage that creates DOM nodes dynamically via JavaScript, such as the TODO demo app.
- In the rendered demo page, create a new todo item.
- In the rendered demo page, right-click the new todo item, and then select Inspect. DevTools opens, showing the Elements tool.
- Click the Stack Trace tab, which is grouped with the Styles tab.
See also:
Status:
- This checkbox is present in Microsoft Edge Canary 125.
- This checkbox is present in Microsoft Edge Stable 123.
Protocol Monitor
Makes the Protocol monitor tool available in DevTools:
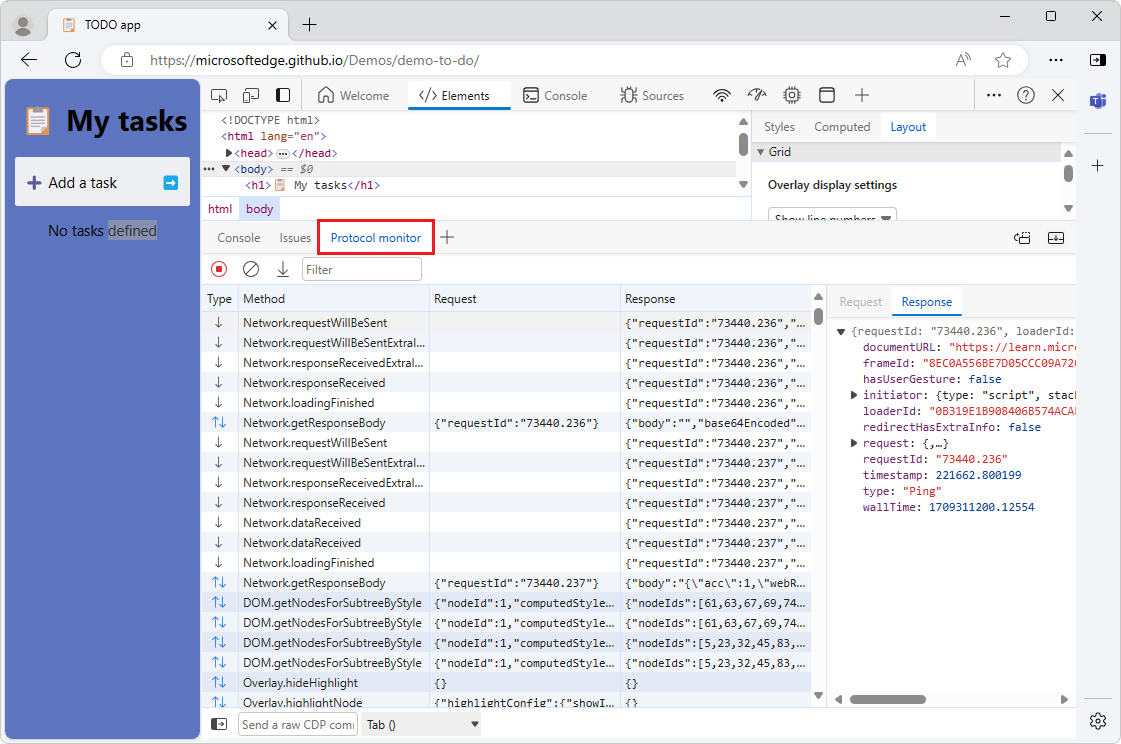
The Protocol monitor tool displays the messages that are sent and received by DevTools, to debug the inspected page. DevTools communicates with the inspected page by using the Chrome DevTools Protocol (CDP).
To select this checkbox and then open the Protocol monitor tool:
Select this Protocol Monitor checkbox as described in Turning an experiment on or off, above.
In Quick View at the bottom of DevTools, click the More tools (+) button, and then select Protocol monitor.
Or, open the Command Menu, such as by pressing Ctrl+Shift+P (Windows/Linux) or Command+Shift+P (macOS), and then type protocol in the text box. Then select Show Protocol monitor.
The Protocol monitor tool is displayed in the Quick View panel at the bottom of DevTools.
See also:
- Use the Chrome DevTools Protocol (CDP) in WebView2 apps
- [Experimental] Protocol monitor in What's New In DevTools (Chrome 92).
Status:
- This checkbox is present in Microsoft Edge Canary 125.
- This checkbox is present in Microsoft Edge Stable 123.
Show option to expose internals in heap snapshots
new as of Microsoft Edge 105
Whether to display a checkbox to expose internals in heap snapshots in the Memory tool.
See also:
Status:
- This checkbox is present in Microsoft Edge Canary 125.
- This checkbox is present in Microsoft Edge Stable 123.
In heap snapshots, treat backing store size as part of the containing object
new as of Microsoft Edge 124
Configures the Shallow Size column in the Memory tool to report the entire size of objects, including the size of the object's backing store. If this experiment is enabled, when you take a new heap snapshot, the Shallow Size column now includes the entire size of objects:
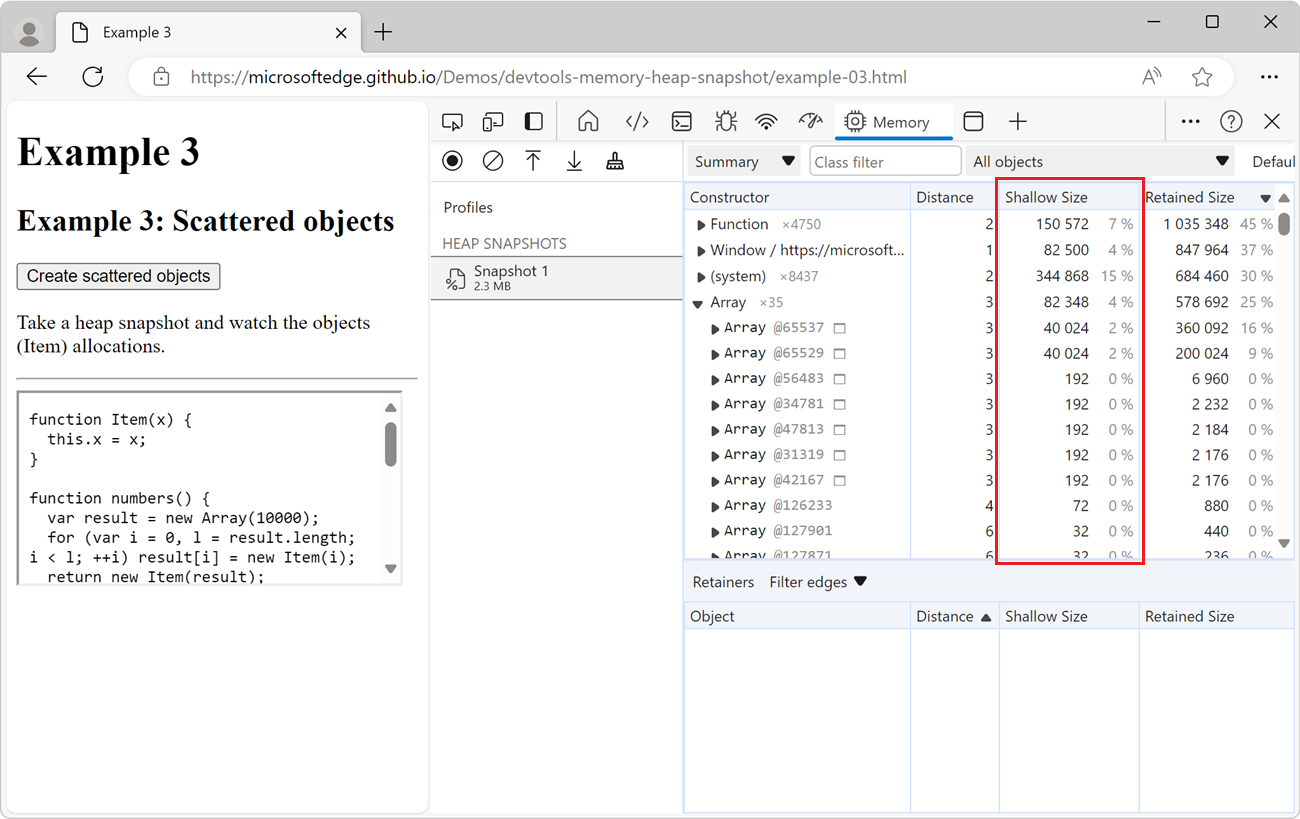
By default, the Shallow Size column in the Memory tool only includes the size of the object itself. The shallow size is the size of the JavaScript heap that's directly held by an object. The shallow size of an object is usually small, because a JavaScript object often only stores its description of the object, not the values, in the object's directly held memory. Most JavaScript objects store their values in a backing store that's elsewhere in the JavaScript heap, and only expose a small wrapper object on the portion of the JavaScript heap that's directly owned by the object. For example, JavaScript Array instances store the contents of the array in a backing store, which is a separate memory location that's not included in the array's shallow size.
See also:
- Configure the Shallow Size column to include an entire object's size in Record heap snapshots using the Memory tool.
Status:
- This checkbox is present in Microsoft Edge Canary 125.
- This checkbox is present in Microsoft Edge Stable 123.
Enable JavaScript Profiler temporarily
new as of Microsoft Edge 114
Temporarily enables the JavaScript Profiler tool (tab) in DevTools. The JavaScript Profiler tool will be deprecated. To record JavaScript CPU profiles, use the Performance tool instead.
See also:
Status:
- This checkbox is not present in Microsoft Edge Canary 125.
- This checkbox is present in Microsoft Edge Stable 123.
Disable Indentation Markers temporarily
new as of Microsoft Edge 122
Temporarily disables the indentation markers in the Sources tool. The indentation markers are the vertical lines that indicate the indentation level of the code:
See also:
Status:
- This checkbox is present in Microsoft Edge Canary 125.
- This checkbox is present in Microsoft Edge Stable 123.
Resolve variable names in expressions using source maps
Uses source maps to automatically map original variable names to minified variable names when evaluating expressions.
This checkbox affects the Console, and the Watch sidebar tab in the Sources tool.
See also:
- Map the processed code to your original source code, for debugging
- Mapping minified code to your source code to show readable code in Sources tool overview.
Status:
- This checkbox is present in Microsoft Edge Canary 125.
- This checkbox is present in Microsoft Edge Stable 123.
Set all breakpoints eagerly at startup
Sets all possible defined breakpoints at startup.
See also:
Status:
- This checkbox is present in Microsoft Edge Canary 125.
- This checkbox is present in Microsoft Edge Stable 123.
Enable new Advanced Perceptual Contrast Algorithm (APCA) replacing previous contrast ratio and AA/AAA guidelines
The Advanced Perceptual Contrast Algorithm (APCA) replaces the AA/AAA guidelines contrast ratio in the Color Picker. The Color Picker is used in the Styles tab in the Elements tool.
APCA is a new way to compute contrast. It is based on modern research on color perception. Compared to AA/AAA guidelines, APCA is more context-dependent. The contrast is calculated based on the following spatial properties of the text, color, and context.
- Spatial properties of text that include font weight and size.
- Spatial properties of color that include perceived contrast between text and background.
- Spatial properties of context that include ambient light, surroundings, and intended purpose.
See also:
- New color contrast calculation - Advanced Perceptual Contrast Algorithm (APCA) in What's New in DevTools (Microsoft Edge 89).
- Change colors with the Color Picker in CSS features reference.
- Test text-color contrast using the Color Picker
Status:
- This checkbox is present in Microsoft Edge Canary 125.
- This checkbox is present in Microsoft Edge Stable 123.
Enable full accessibility tree view in the Elements panel
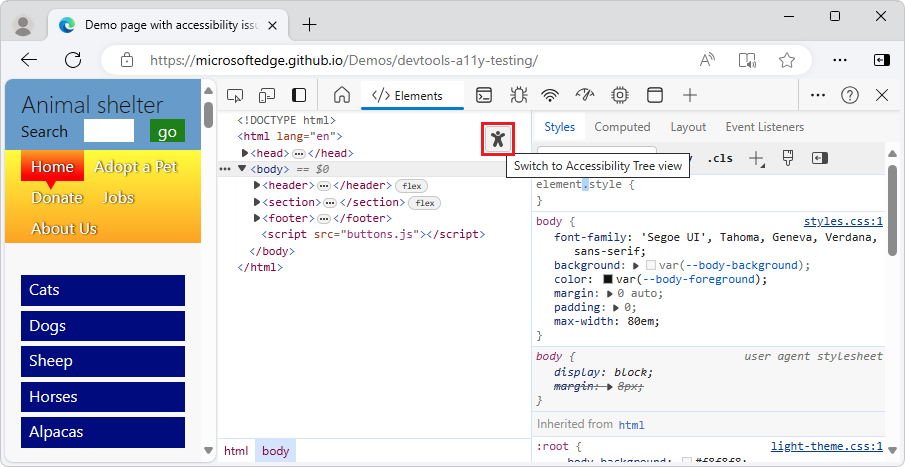
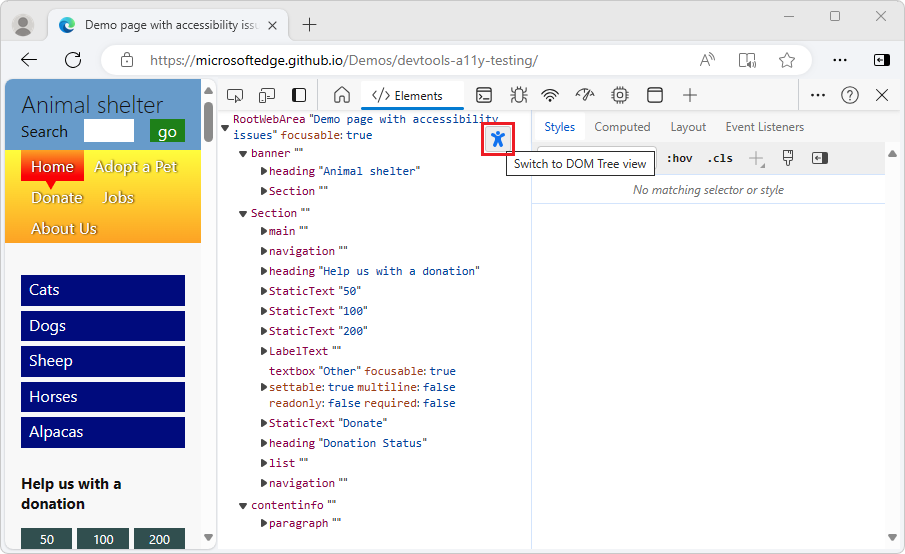
Adds a Switch to Accessibility Tree view button in the Elements tool that toggles between the DOM tree and the accessibility tree. The button label toggles to Switch to DOM Tree view.
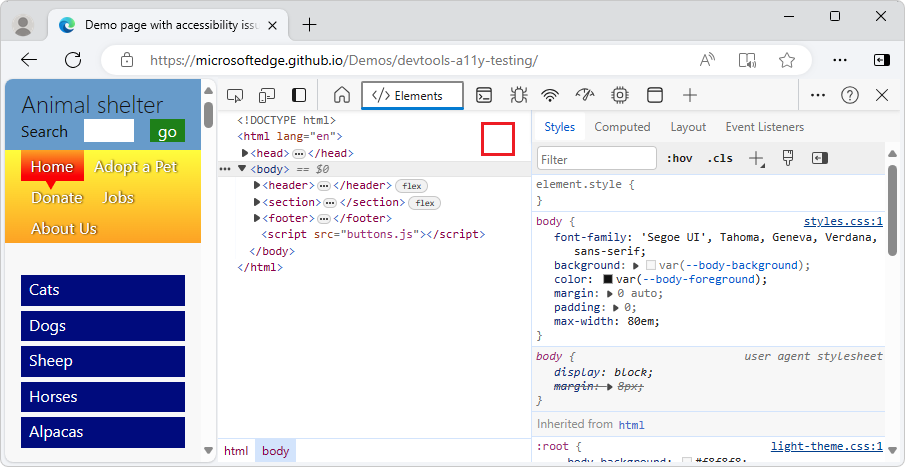
If this Experiment checkbox is cleared, the Elements tool lacks the button:
If this Experiment checkbox is selected, the Elements tool has the button:
The Accessibility Tree view in the Elements tool:
See also:
- Test accessibility using the Accessibility tab
- Full accessibility tree view in the Elements tool in What's New in DevTools (Microsoft Edge 90).
Status:
- This checkbox is present in Microsoft Edge Canary 125.
- This checkbox is present in Microsoft Edge Stable 123.
Enable new Font Editor tool within the Styles Pane.
See Enable the Font Editor tool within the Styles pane below.
Enable the Font Editor tool within the Styles pane
You can use the visual Font Editor to edit fonts. Use it define fonts and font characteristics. The visual Font Editor helps you do the following:
- Switch between units for different font properties
- Switch between keywords for different font properties
- Convert units
- Generate accurate CSS code
To use the visual Font Editor:
To open DevTools, right-click the webpage, and then select Inspect. Or, press Ctrl+Shift+I (Windows, Linux) or Command+Option+I (macOS). DevTools opens.
In DevTools, on the main toolbar, select the Elements tab. If the Elements tab isn't visible, click the More tabs (
 ) button, or else the More Tools (
 ) button.
In the Styles tab, select the Font Editor icon.
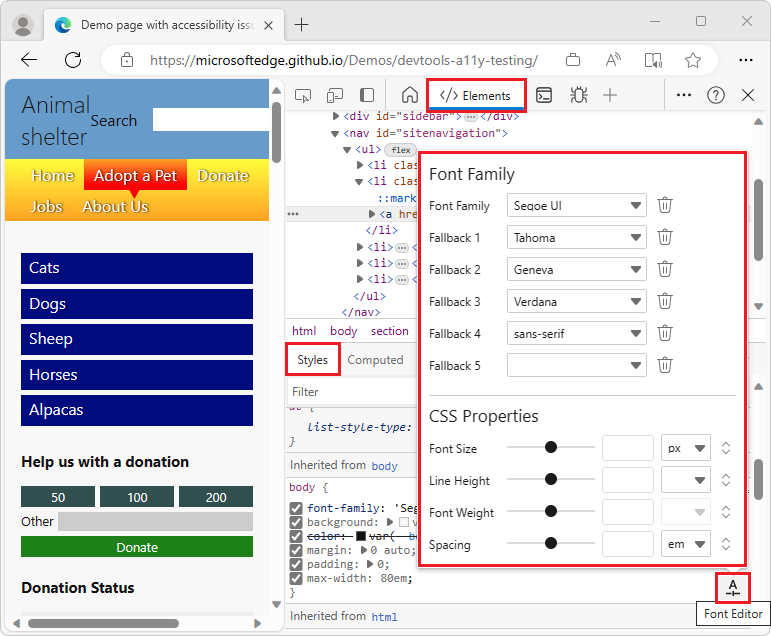
Some browser channels have the checkbox label Enable new Font Editor tool within the Styles pane.
See also:
Status:
- This checkbox is present in Microsoft Edge Canary 125.
- This checkbox is present in Microsoft Edge Stable 123.
Enable automatic contrast issue reporting via the Issues panel
Enables automatic contrast issue reporting in the Issues tool.
See also:
Status:
- This checkbox is present in Microsoft Edge Canary 125.
- This checkbox is present in Microsoft Edge Stable 123.
Enable experimental cookie features
Enables experimental cookie features.
See also:
Status:
- This checkbox is present in Microsoft Edge Canary 125.
- This checkbox is present in Microsoft Edge Stable 123.
Sync CSS changes in the Styles pane
Whether to sync CSS changes in the Styles tab in the Elements tool.
See also:
Status:
- This checkbox is present in Microsoft Edge Canary 125.
- This checkbox is present in Microsoft Edge Stable 123.
Highlights a violating node or attribute in the Elements panel DOM tree
new as of Microsoft Edge 106
Highlights a violating node or attribute in the Elements tool's DOM tree.
See also:
Status:
- This checkbox is present in Microsoft Edge Canary 125.
- This checkbox is present in Microsoft Edge Stable 123.
Group sources into Authored and Deployed trees
new as of Microsoft Edge 104
Controls whether to group resources into separate Authored and Deployed trees in the Page tab of the Sources tool. This feature in the Sources tool allows you to group source files in two folders depending on whether these are:
- Original source files (authored, that is, files with your local edits).
- Production files (deployed files that are on the web server after compiling and bundling the source files).
See also:
- Using the Page tab to explore resources that construct the current webpage in Sources tool overview.
Status:
- This checkbox is present in Microsoft Edge Canary 125.
- This checkbox is present in Microsoft Edge Stable 123.
Hide ignore-listed code in sources tree view
new as of Microsoft Edge 106
In the Sources tool's tree view, omits code that's included in the Ignore list.
See also:
Status:
- This checkbox is present in Microsoft Edge Canary 125.
- This checkbox is present in Microsoft Edge Stable 123.
Highlight important DOM properties in the Object Properties viewer
new as of Microsoft Edge 105
Selecting this checkbox causes important DOM properties to be highlighted in the Properties tab in tools such as the Elements tool, for the DOM tree element that's currently selected. This new experiment makes major properties easier to see. Some properties appear in bold, and others appear in bold and have a star icon next to them.
This highlighting is useful because in JavaScript, objects inherit from parent objects, which themselves inherit from other ancestors, sometimes amounting to hundreds of properties. This experiment helps you find the main properties.
The Object Properties viewer is in several tools, including Elements, Sources, Console, and Network. It provides a tree view of properties of objects.
In the Elements tool
To see the Object Properties viewer in the Elements tool:
Right-click an item in a webpage and then select Inspect. DevTools opens, with the page element selected in the DOM tree of the Elements tool.
In the Elements tool, select the Properties tab, which is grouped with the Styles tab.
The Properties tab contains the list of properties for the selected element.
See also:
In the Sources tool
To see the Object Properties viewer in the Sources tool:
Open a
.jsfile.Set a breakpoint on a line of code in the
.jsfile.Pause the debugger at that line by running the code on the webpage.
Object properties are displayed in the Scope section in the right-hand sidebar. See View and edit properties and variables in JavaScript debugging features.
See also:
Status:
- This checkbox is present in Microsoft Edge Canary 125.
- This checkbox is present in Microsoft Edge Stable 123.
Enable background page selector (e.g. for prerendering debugging)
new as of Microsoft Edge 114
Enables the background page selector, such as for prerendering debugging.
See also:
- Overview and timelines for migrating to Manifest V3 - service workers instead of background pages, for Microsoft Edge extensions.
- chrome.runtime - retrieves the background page.
Status:
- This checkbox is present in Microsoft Edge Canary 125.
- This checkbox is present in Microsoft Edge Stable 123.
Show warning about Self-XSS when pasting code
new as of Microsoft Edge 117
Displays a warning about self cross-site scripting when code is pasted into the Console. If this checkbox is enabled, when you initially try to paste code into the Console tool, a warning message is displayed:
"Warning: Do not paste code you do not understand or have not checked yourself into the DevTools console. This could allow attackers to steal your identity or take control of your computer. Please type 'allow pasting' below to allow pasting."
After you enter allow pasting in the Console, you can paste code, in the current DevTools session and in future sessions.
See also:
- Self-XSS at Wikipedia.
Status:
- This checkbox is not present in Microsoft Edge Canary 125.
- This checkbox is present in Microsoft Edge Stable 123.
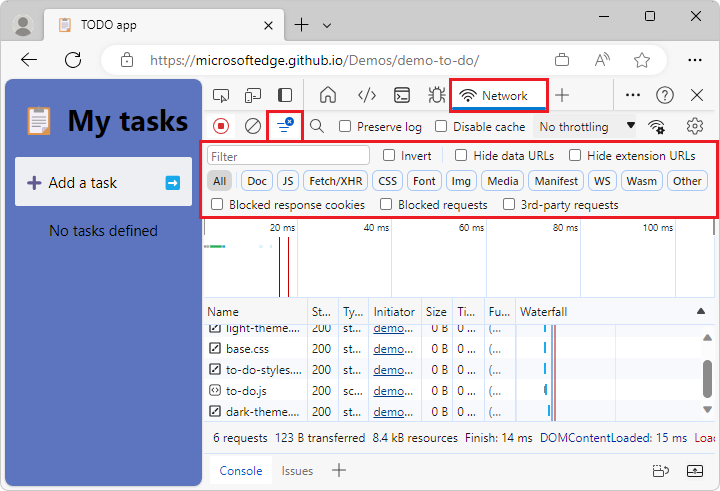
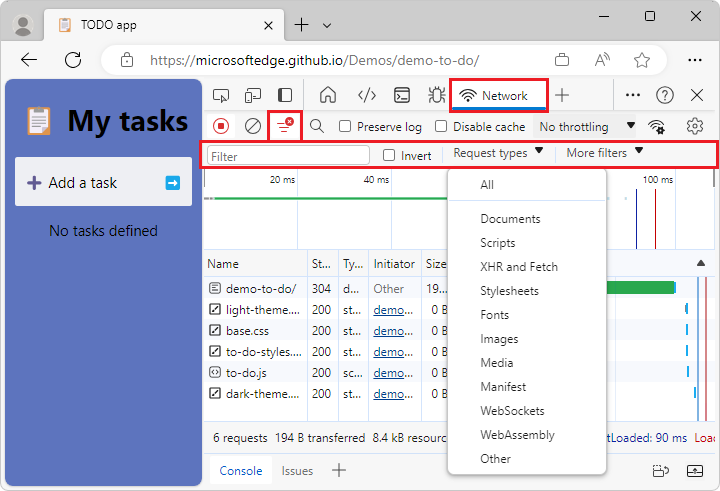
Redesign of the filter bar in the Network Panel
new as of Microsoft Edge 120
In the Network tool, the filter bar has been redesigned:
- The buttons are replaced by a Request types dropdown list.
- The checkboxes are replaced by a More filters dropdown list.
Filter bar with this checkbox cleared:
Filter bar with this checkbox selected:
See also:
- Filter resources in Inspect network activity.
- Filter requests in Network features reference.
Status:
- This checkbox is present in Microsoft Edge Canary 125.
- This checkbox is present in Microsoft Edge Stable 123.
Enable Autofill view
new as of Microsoft Edge 121
This checkbox label has been changed from Enable Autofill view to Autofill panel. See Autofill panel, below.
Status:
- This checkbox is not present in Microsoft Edge Canary 125.
- This checkbox is present in Microsoft Edge Stable 123.
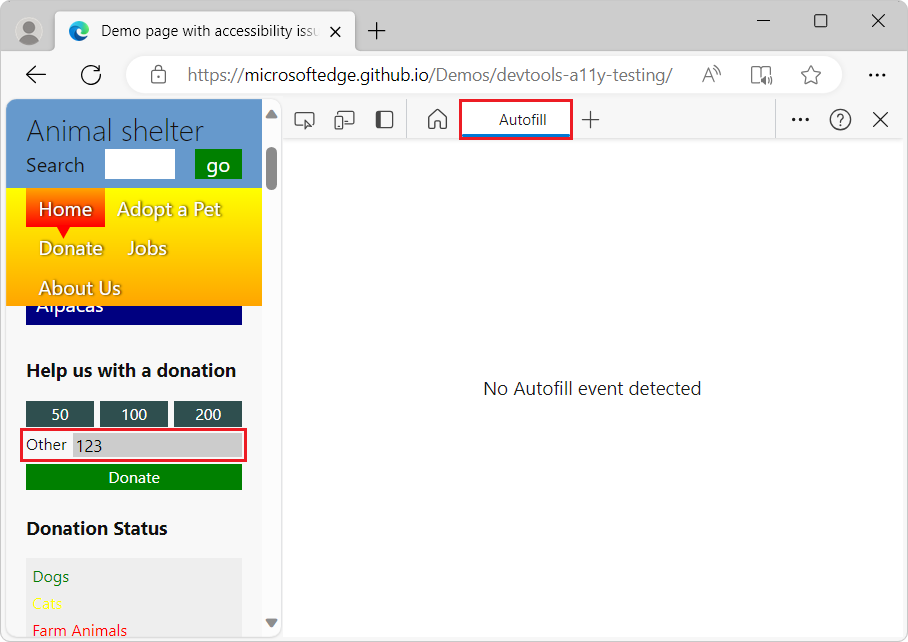
Autofill panel
new as of Microsoft Edge 125
Adds an Autofill tool to DevTools, to record various events that the browser triggers when a user is filling in a form by using the browser's autofill feature. For example, when the browser remembers your address and autofills it in an address field.
See also:
Status:
- This checkbox is present in Microsoft Edge Canary 125.
- This checkbox is present in Microsoft Edge Stable 123, as Enable Autofill view.
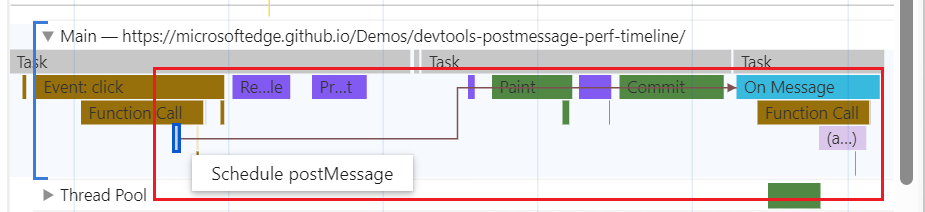
Timeline: Show postMessage dispatch and handling flows
new as of Microsoft Edge 124
This experiment improves the Performance tool's Main section to help you quickly identify postMessage events and handlers, by distinguishing events that are triggered by the postMessage method from other events that are displayed in the Performance tool. This experiment helps you investigate performance issues that are related to posting messages across various threads of an application, to view messages between windows, iframes, and dedicated workers.
Without this experiment, events that are triggered by dispatching and handling messages between threads of an application appear as generic scripting function-call events. With this experiment enabled:
postMessagedispatch events appear as Schedule postMessage.postMessagehandler events appear as On Message:
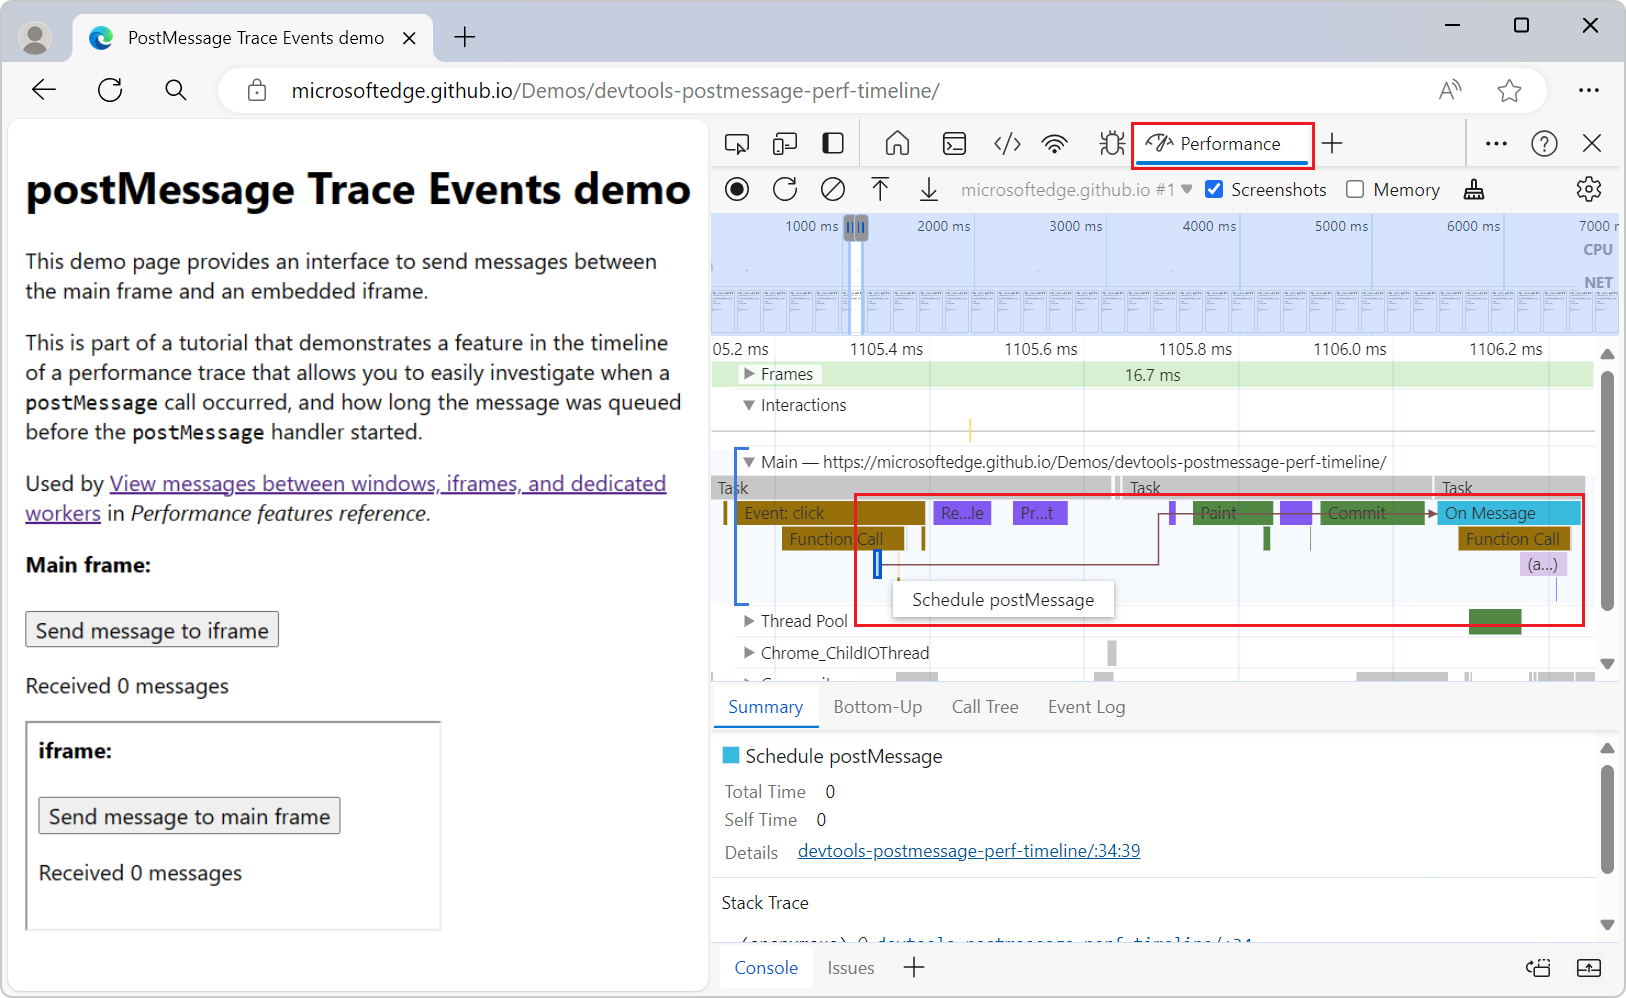
This experiment helps you investigate when a postMessage call occurred, and how long the message was queued before the postMessage handler starts. The dispatch events are linked to handler events by initiator arrows that appear when you click on either type of event:
See also:
- Performance features reference
- Performance recording event reference
- postMessage Trace Events demo (rendered)
- postMessage Trace Events demo (source code)
Status:
- This checkbox is present in Microsoft Edge Canary 125.
- This checkbox is not present in Microsoft Edge Stable 123.
Enable save and load trace with annotations in Performance Panel
new as of Microsoft Edge 125
Adds the ability to persist the following changes made to trace files in the Performance tool, and reapply them when importing traces:
Changes made by using the breadcrumbs. This feature enables you to crop into and focus on the more relevant parts of a trace. See Breadcrumbs in the Timeline in What's new in DevTools (Chrome 122).
Changes made by right-clicking a track. This feature enables you to merge and hide superfluous or irrelevant entries of a trace, cleaning up the flame charts and trees. See Hide functions and their children in the flame chart in What's new in DevTools (Chrome 124).
See also:
Status:
- This checkbox is present in Microsoft Edge Canary 125.
- This checkbox is not present in Microsoft Edge Stable 123.
Log DevTools uncaught exceptions to Console
Controls whether to log DevTools uncaught exceptions in the Console tool.
See also:
Status:
- This checkbox is present in Microsoft Edge Canary 125.
- This checkbox is present in Microsoft Edge Stable 123.
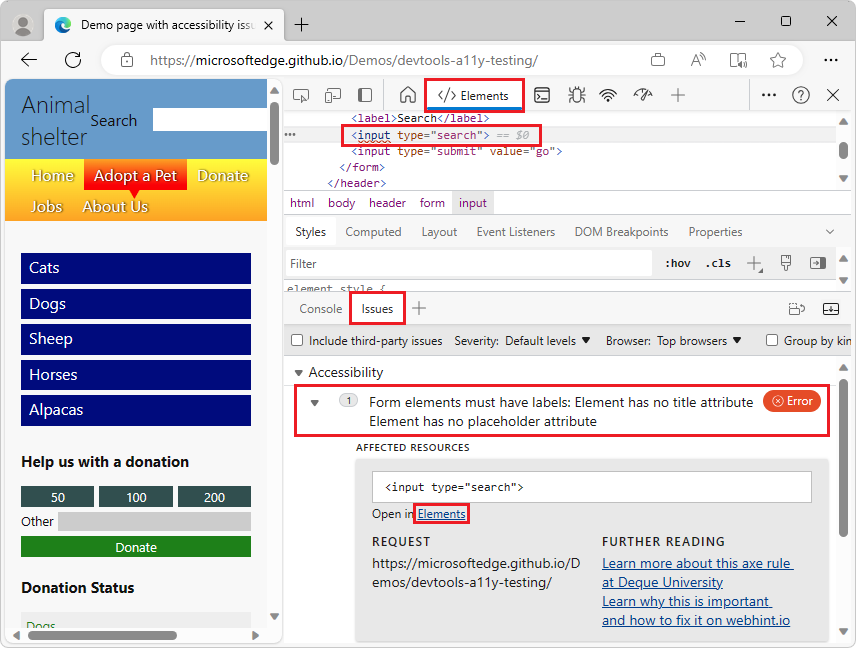
Enable webhint
webhint is an open-source tool that provides real-time feedback for websites and local webpages. The type of feedback provided by webhint includes:
- Accessibility
- Cross-browser compatibility
- Security
- Performance
- Progressive Web Apps (PWAs)
- Other common web development issues
The webhint experiment displays webhint feedback in the Issues tool. Select an issue to display documentation about the solution and a list of the affected resources on your website. Select a resource link to open the relevant tool, such as Network, Sources, or Elements:
See also:
Status:
- This checkbox is present in Microsoft Edge Canary 125.
- This checkbox is present in Microsoft Edge Stable 123.
Show issues in Elements
Displays syntax errors as wavy underlines under DOM nodes in the Elements tool.
See also:
- Wavy underlines highlight code issues and improvements in Elements tool in What's New in DevTools (Microsoft Edge 91).
Status:
- This checkbox is present in Microsoft Edge Canary 125.
- This checkbox is present in Microsoft Edge Stable 123.
Open source files in Visual Studio Code
The Open source files in Visual Studio Code experiment replaces the code editor of the Sources tool with Visual Studio Code, for editing local files. When you turn on this experiment, Developer Tools detects when you edit a local file, and prompts you to select a folder to use as your Workspace.
When you select a folder to use as your Workspace, selecting any link to a file in DevTools opens the file in Visual Studio Code. In previous versions of Microsoft Edge, this action opened the file in the code editor of the Sources tool in DevTools.
Any edits that you make in DevTools now change the file on the hard drive and sync live with Visual Studio Code.
See also:
- Opening source files in Visual Studio Code - setting up your workspace.
Status:
- This checkbox is present in Microsoft Edge Canary 125.
- This checkbox is present in Microsoft Edge Stable 123.
Enable Adaptive CPU throttling
new as of Microsoft Edge 114
Enables Adaptive CPU throttling.
See also:
- Throttle the CPU while recording in Performance features reference.
Status:
- This checkbox is present in Microsoft Edge Canary 125.
- This checkbox is present in Microsoft Edge Stable 123.
Ignore List for JavaScript frames on Timeline
Whether to include code that's in the Ignore list in JavaScript frames, in the Performance tool.
See also:
- Introduction to the Performance tool
- Add content scripts to the Ignore List
- Enhanced ignore listing
- Improved Ignore list setting
Status:
- This checkbox is present in Microsoft Edge Canary 125.
- This checkbox is present in Microsoft Edge Stable 123.
Live heap profile
Controls whether to live-update the heap profile.
See also:
Status:
- This checkbox is present in Microsoft Edge Canary 125.
- This checkbox is present in Microsoft Edge Stable 123.
Sampling heap profiler timeline
Controls whether to show the sampling heap profiler timeline in the Performance tool.
See also:
Status:
- This checkbox is present in Microsoft Edge Canary 125.
- This checkbox is present in Microsoft Edge Stable 123.
Timeline: invalidation tracking
Controls whether to show invalidation tracking in the Performance tool.
See also:
Status:
- This checkbox is present in Microsoft Edge Canary 125.
- This checkbox is present in Microsoft Edge Stable 123.
Timeline: show all events
Controls whether to show all events in the Performance tool.
See also:
Status:
- This checkbox is present in Microsoft Edge Canary 125.
- This checkbox is present in Microsoft Edge Stable 123.
Timeline: V8 Runtime Call Stats on Timeline
Controls whether to show V8 runtime call statistics in the Performance tool. V8 is the JavaScript engine that's used by Microsoft Edge.
See also:
Status:
- This checkbox is present in Microsoft Edge Canary 125.
- This checkbox is present in Microsoft Edge Stable 123.
View console.profile() results in the Performance panel for Node.js
new as of Microsoft Edge 109
Displays console.profile() results in the Performance tool for Node.js.
console.profile() can be used in the DevTools Console (or in your code) to start a JavaScript profile, and then you can use console.profileEnd() to terminate it. Once done, you can see your profile recording in the JavaScript Profiler tool.
This is a programmatic way to record JavaScript execution, which can be useful in certain performance debugging situations.
When DevTools is used to debug processes that are running in Node.js, this experiment makes whatever console.profile generates available to the Performance Tool.
See also:
Status:
- This checkbox is not present in Microsoft Edge Canary 125.
- This checkbox is present in Microsoft Edge Stable 123.
Timeline: Enable track configuration feature that can reorder or hide a track in the flame chart
new as of Microsoft Edge 125
Enables the track configuration feature, which lets you choose which tracks are visible in the Performance tool, and the order in which they appear:
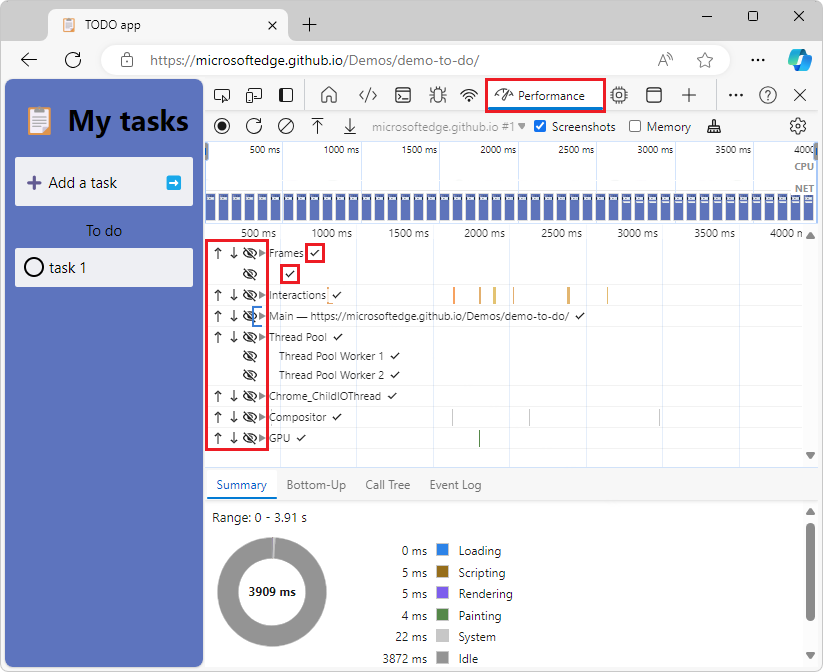
To configure tracks:
- Enable this experiment.
- Go to a webpage in a new window or tab, such as https://microsoftedge.github.io/Demos/demo-to-do/.
- In the Performance tool, click the Record button in the upper left to start a new performance recording.
- Interact with the webpage; for example, add a new task in the Todo demo.
- Stop the recording.
- In the Performance tool, hover over a track, such as Network, Interactions, or Main. The Track configuration (pen icon) button appears on the left of the hovered track.
- Click the Track configuration (pen icon) button. The track configuration screen opens.
- On the track configuration screen, to change the order of the tracks, click an up arrow icon or down arrow icon. Or, to show or hide a track, click the eye icon on a track to toggle it.
- To confirm the new track configuration, click the checkmark icon to the right of a track. The performance recording is displayed, with the new track configuration.
See also:
Status:
- This checkbox is present in Microsoft Edge Canary 125.
- This checkbox is not present in Microsoft Edge Stable 123.
Timeline: Enable User Timings based extensions
new as of Microsoft Edge 125
Enables extensions that customize the appearance of user timing events in the Performance tool.
See also:
Status:
- This checkbox is present in Microsoft Edge Canary 125.
- This checkbox is not present in Microsoft Edge Stable 123.
Enable instrumentation breakpoints
Whether to halt at test breakpoints. This experiment makes breakpoints more reliable.
See also:
- Enable synchronization on instrumentation breakpoints
- The first time source files are loaded, breakpoints might not trigger
Status:
- This checkbox is present in Microsoft Edge Canary 125.
- This checkbox is present in Microsoft Edge Stable 123.
Use scope information from source maps
new as of Microsoft Edge 118
Whether to use scope information from source maps.
See also:
- Map the processed code to your original source code, for debugging
- Mapping minified code to your source code to show readable code in Sources tool overview.
Status:
- This checkbox is present in Microsoft Edge Canary 125.
- This checkbox is present in Microsoft Edge Stable 123.
Enable Speculative Loads Panel in Application panel
new as of Microsoft Edge 121
Adds a Speculative loads page within the Background services section of the Application tool, including a Rules page and a Speculations page:
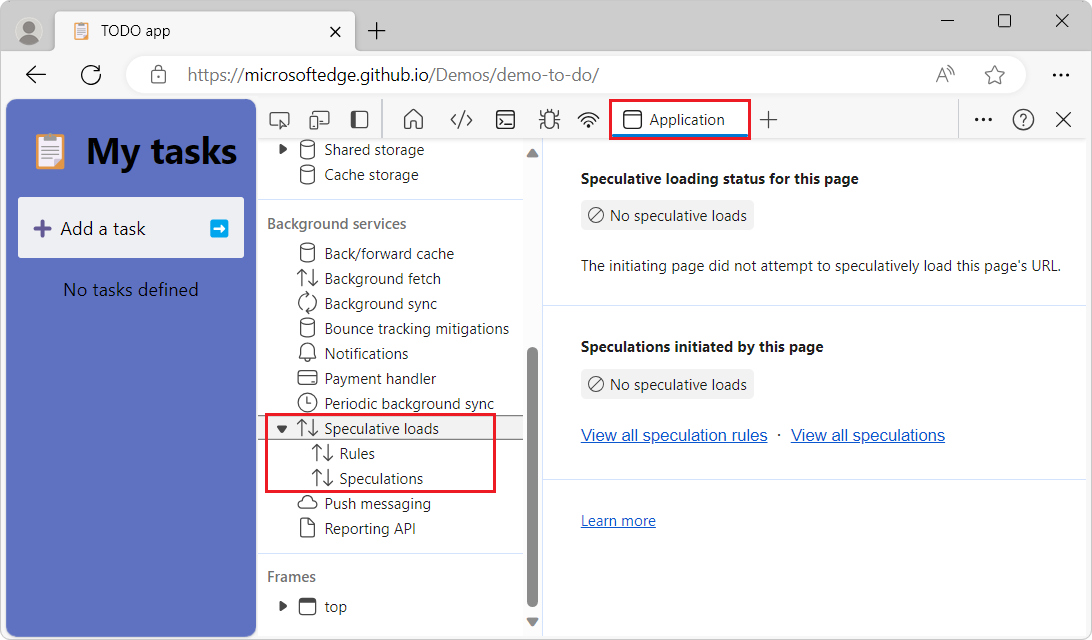
The Speculation Rules API can be used to programmatically tell Microsoft Edge to pre-render certain pages. This is useful because pre-rendered pages are almost instantaneous to navigate to. The browser pre-renders, in a hidden way, the next pages that a user is likely to navigate to, while the user is still on the current page.
The Speculative loads page lists the speculation rules that the web author has defined in the webpage. The page provides debugging information that shows whether a rule was actually used, showing whether a particular page was pre-rendered.
The Rules page has columns:
- Rule set
- Status
The Speculations page has columns:
- URL
- Action
- Rule set
- Status
See also:
Status:
- This checkbox is present in Microsoft Edge Canary 125.
- This checkbox is present in Microsoft Edge Stable 123.
Enable Storage Buckets Tree in Application panel
new as of Microsoft Edge 118
Whether to enable the Storage Buckets Tree in the Application tool.
See also:
Status:
- This checkbox is present in Microsoft Edge Canary 125.
- This checkbox is present in Microsoft Edge Stable 123.
Enable context menu that allows to modify trees in the Flame Chart
new as of Microsoft Edge 121
Adds a right-click menu that allows modifying trees in the flame chart in the Performance tool. With this experiment enabled, you can right-click events in the flame chart of the Performance tool, and modify the chart at that location:
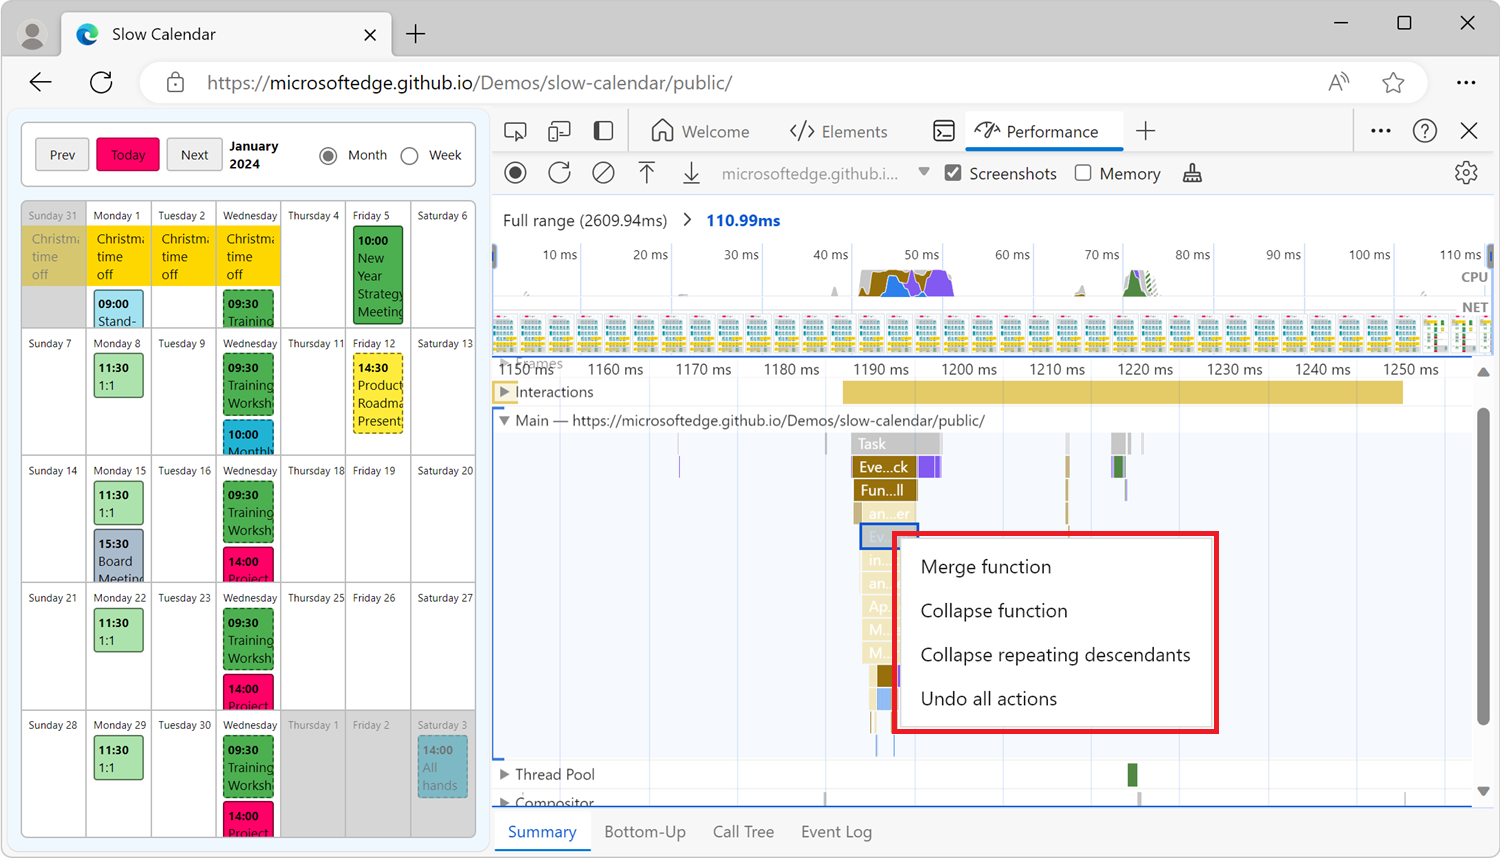
The right-click menu potentially has the following menuitems, depending on context:
- Merge function
- Collapse function
- Collapse repeating descendants
- Undo collapse function
- Undo collapse repeating descendants
- Undo all actions
- Load profile
- Save profile
See also:
- Find the bottleneck in Introduction to the Performance tool.
- View main thread activity in Performance features reference.
Status:
- This checkbox is not present in Microsoft Edge Canary 125.
- This checkbox is present in Microsoft Edge Stable 123.
Feedback
Coming soon: Throughout 2024 we will be phasing out GitHub Issues as the feedback mechanism for content and replacing it with a new feedback system. For more information see: https://aka.ms/ContentUserFeedback.
Submit and view feedback for