Note
Access to this page requires authorization. You can try signing in or changing directories.
Access to this page requires authorization. You can try changing directories.
If your build process compiles and minifies your code and combines it into a single file, the names of the functions displayed in a performance profile might be hard to understand. Source maps map your compiled, minified code to your original source code files. The Performance tool can use source maps to map minified function names after a recording has been made, back to their original names found in your original code.
To learn more about how DevTools uses source maps, see Map the processed code to your original source code, for debugging.
To see your original function names in the flame chart in the Performance tool, use the Unminify (![]() ) button.
) button.
Source mapping is used in DevTools to keep your client-side code readable and debuggable. By clicking the Unminify button in the Performance tool, you can use source maps to create an unminified version of the performance profile you recorded.
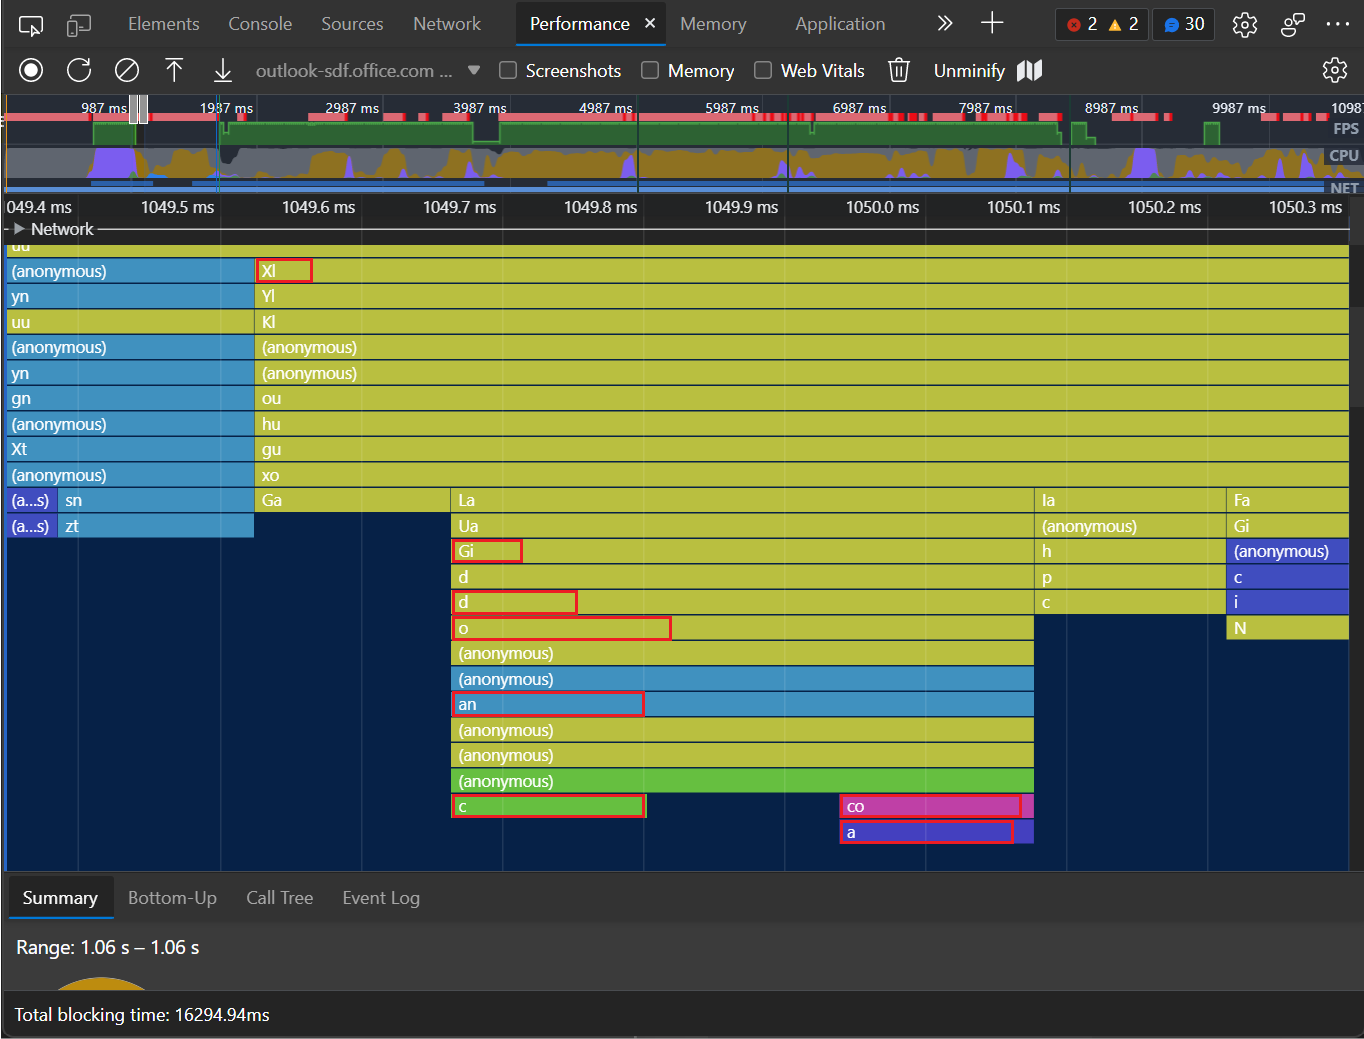
An example of a performance profile flame chart, with hard-to-read function names:
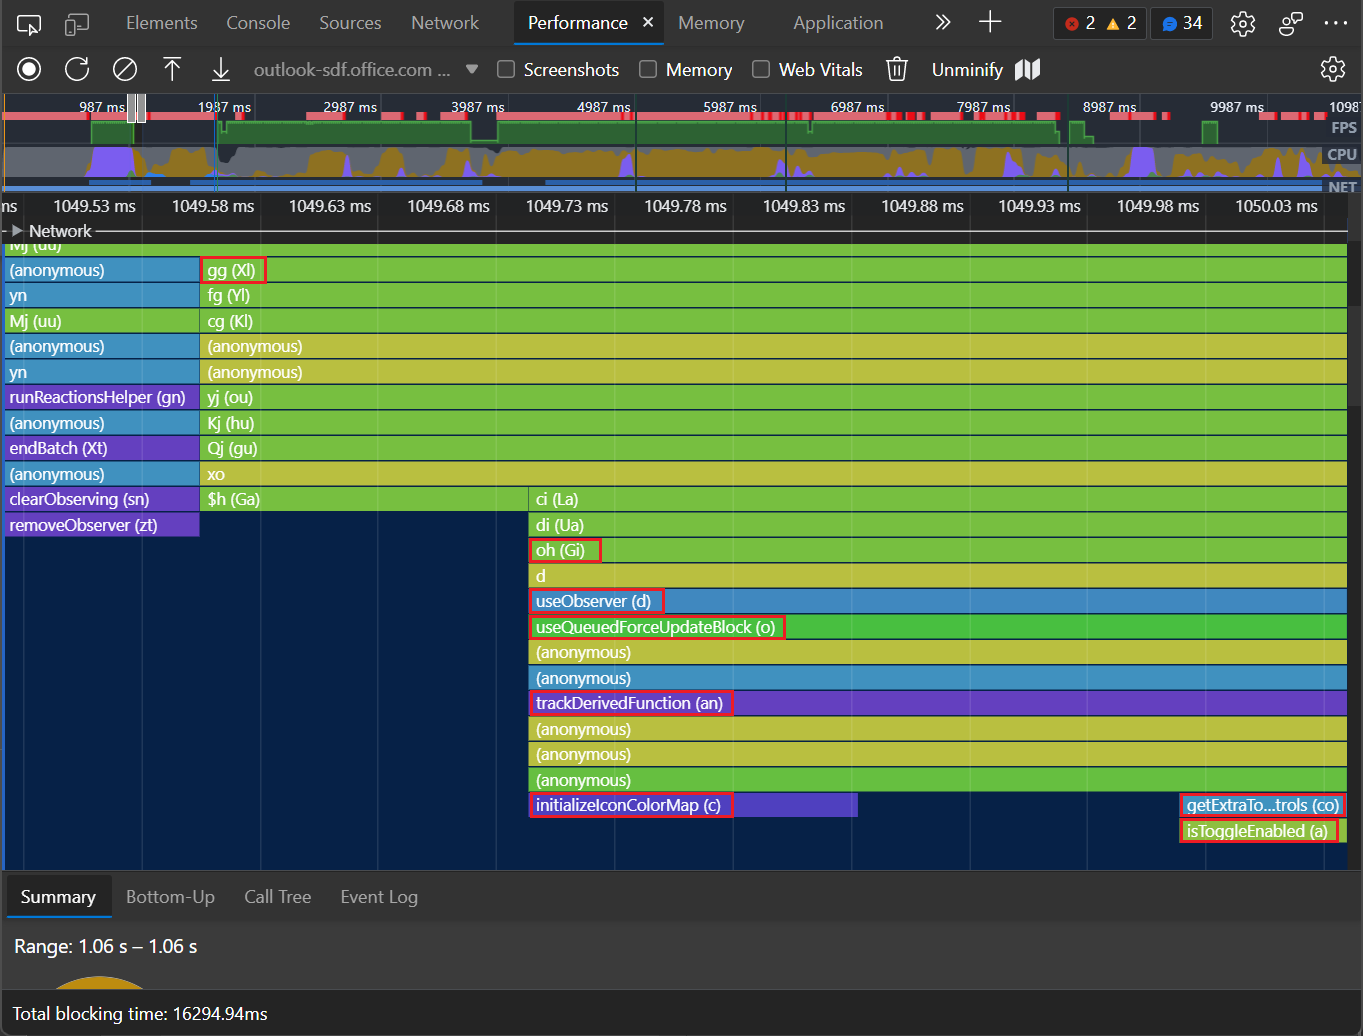
An example of a performance profile flame chart, with some more meaningful function names restored:
When recording a performance profile in the Performance tool, the Main section of the profile displays detailed flame charts of JavaScript functions that were called during the recording.
Ideally, in this flame chart view, you want to see the meaningful function names that are shown in your original source code. However, if your production code is compiled, minified, or bundled, the Performance tool initially displays the function names that are extracted from your transformed, production code. These production function names might be obscure and might not easily map to function names in your original source code.
To unminify a performance profile, so that some more meaningful function names are shown in addition to the minified identifiers, follow the steps below.
Step 1 - Set up source maps
Host your source maps side-by-side with your production code. When unminifying, the Performance tool expects to find your source maps along with your production code.
For details, see Map the processed code to your original source code, for debugging.
Step 2 - Record a performance profile
In the Performance tool, click the Record button, to record a performance profile for the page you want to analyze. For details, see Record runtime performance in Performance features reference.
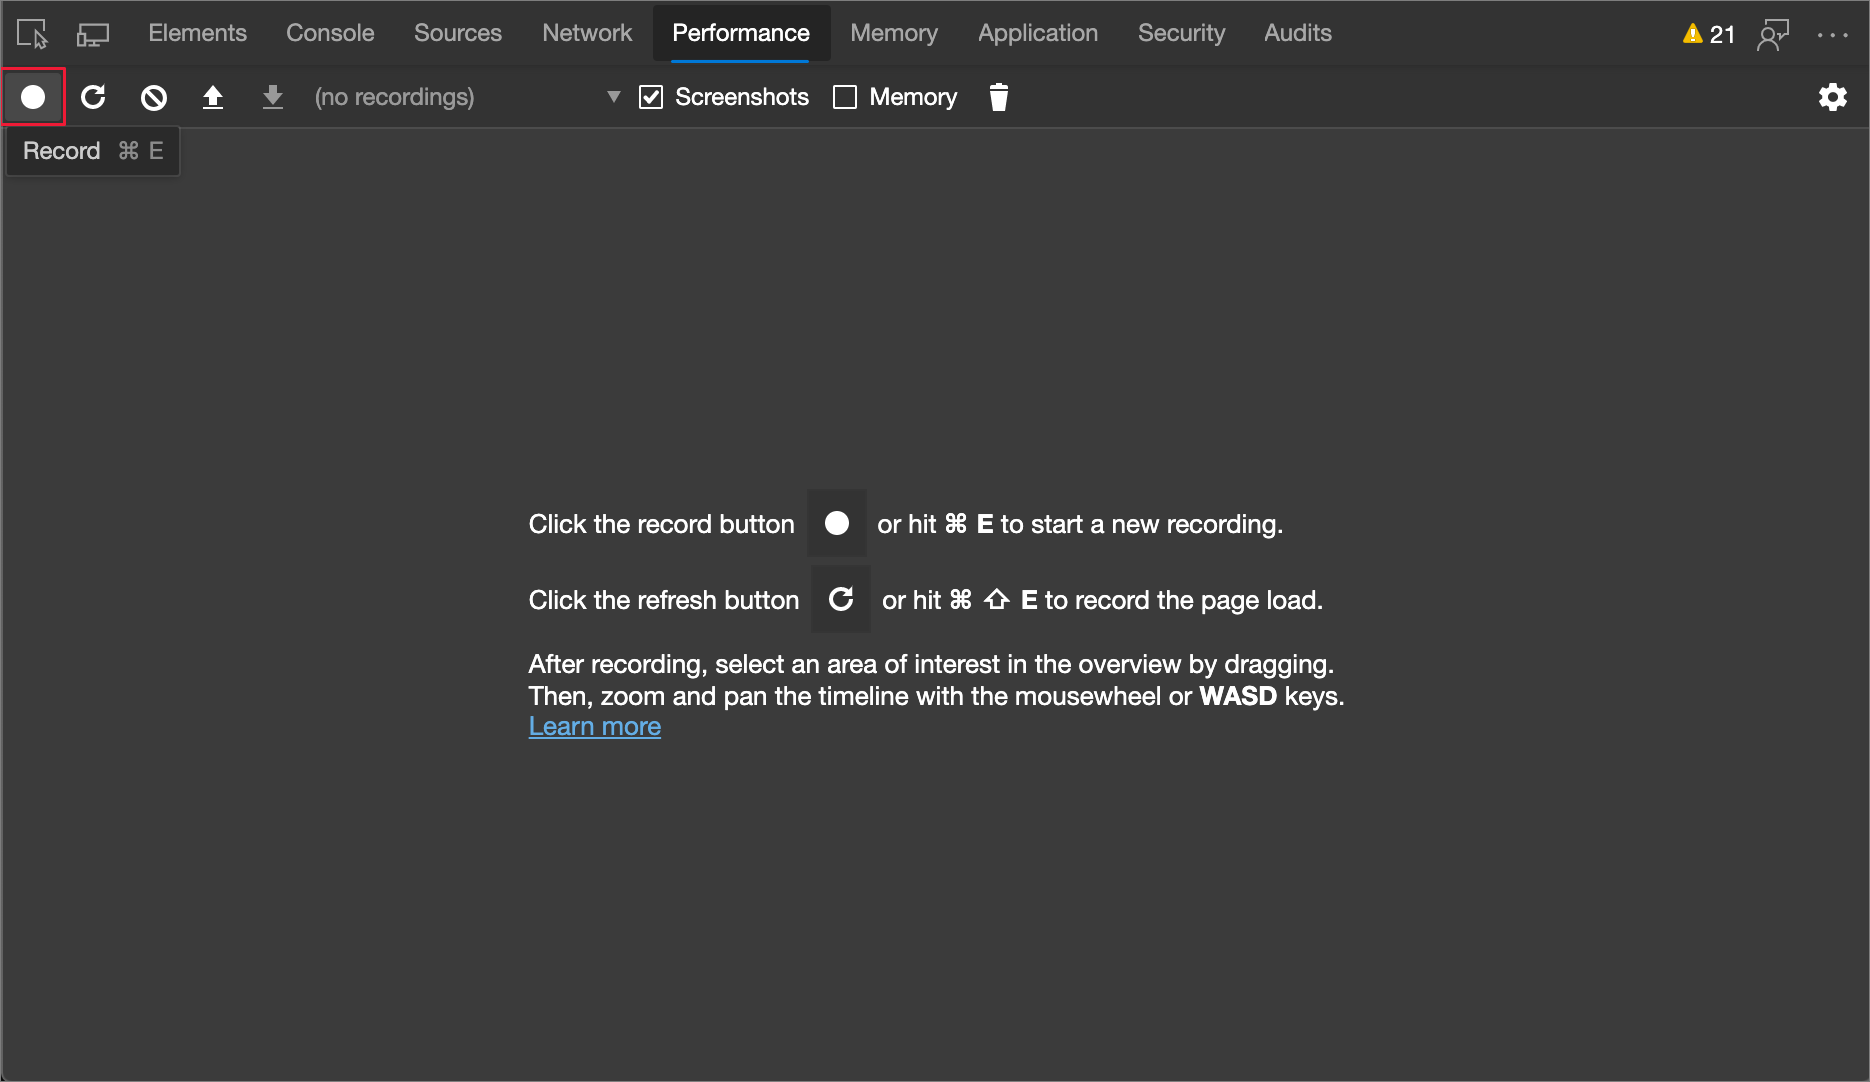
A performance profile is recorded, in the Performance tool.
In the Performance tool, click in the main area (the flame chart), and use the mouse wheel to zoom in. Click and drag left and right. Look at the function names in the flame chart.
The flame chart in the Performance tool shows minified function names, such as XI, Gi, d, o, an, c, co, and a from your production code:
Step 3 - Unminify the code
Click the Unminify (
 ) button:
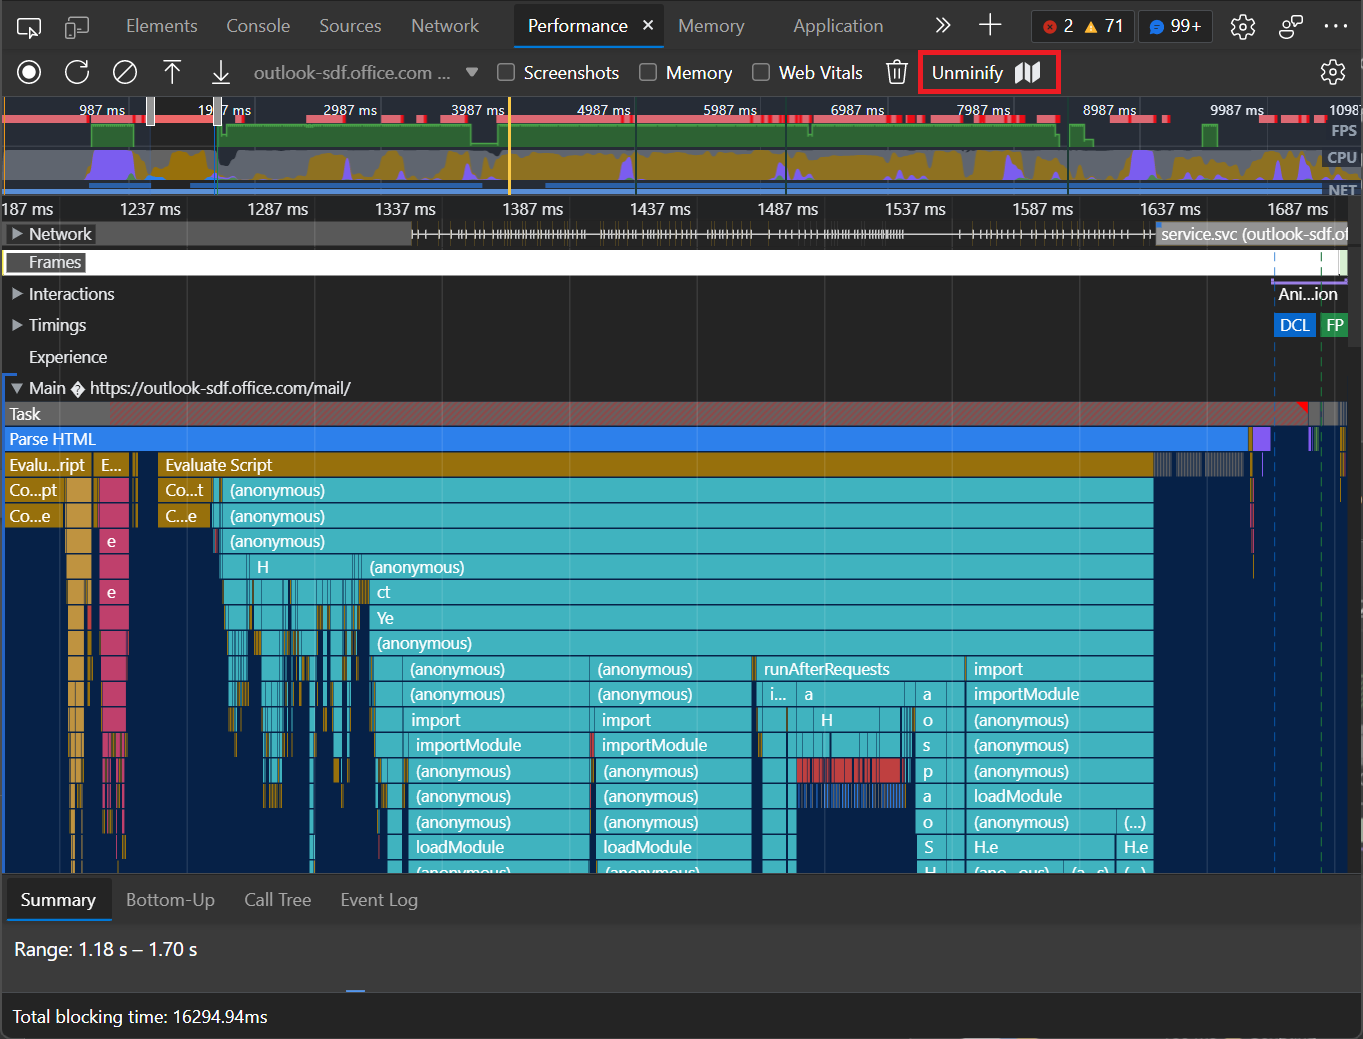
In DevTools, a popup briefly appears, reading: Status: creating unminfied file. Then the Save As dialog opens. The default file name is a pattern starting with date and time like
yymmddThhmmss, such as:Profile-20220307T164948-unminified.json. The default directory is the Downloads directory.Select a file name and directory and then click the Save button.
The Performance tool creates a new version of the recorded performance profile, with some function names from the flame chart replaced by more meaningful function names by using your source maps. Some of the minified production names might still appear, because source maps don't always provide the necessary information for the Performance tool to map all function names.
Step 4 - Load the unminified profile
In the Performance tool, click the Load profile (
 ) icon button. Or, right-click a blank area of the Performance tool, and then select Load profile.
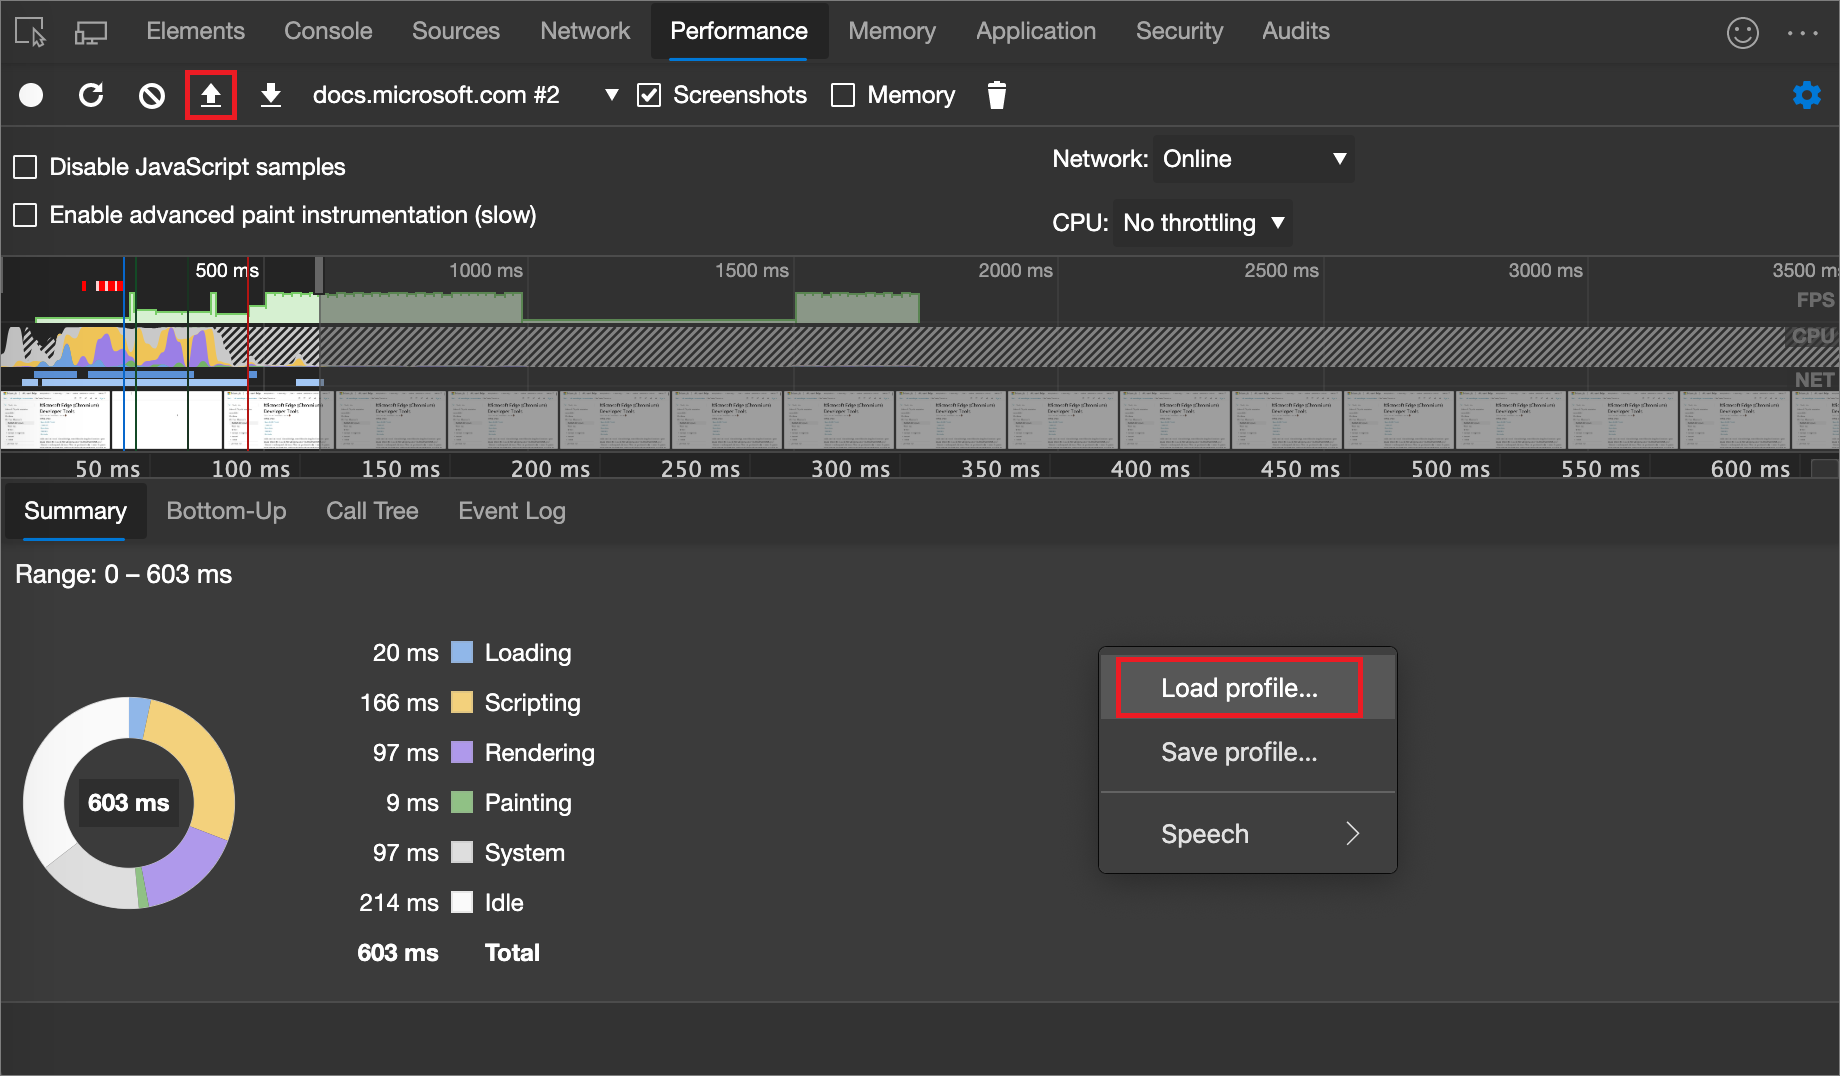
In the Open dialog, select the unminified performance profile
.jsonfile that you just downloaded. If needed, for details, see Load a recording in Performance features reference, and then continue below.Some function names are now unminified. The unminified flame chart in the Performance tool now shows those functions labeled with more meaningful names taken from your source maps, such as useObserver (d), useQueuedForceUpdateBlock (o), trackDerivedFunction (an), initializeIconColorMap (c), getExtraToolControls (co), and isToggleEnabled (a).
See also
- Analyze runtime performance (tutorial) - An introduction to analyzing runtime performance in DevTools.
- Performance features reference, - A reference for many of the features offered in the Performance tool.