Note
Access to this page requires authorization. You can try signing in or changing directories.
Access to this page requires authorization. You can try changing directories.
This tutorial teaches you how to use Lighthouse and other tools in DevTools to find ways to make your websites load faster.
The Lighthouse tool provides links to content that's hosted on third-party websites. Microsoft isn't responsible for and has no control over the content of these sites and any data that may be collected.
Prerequisites
Install Visual Studio Code to edit source code.
Install Node.js to use it as a local web server.
Introduction
In this tutorial, you improve the performance of Margie's travel, a fictitious travel website that contains travel images, text descriptions, a few JavaScript-based user interactions, and an interactive map.
The source files for the website are at MicrosoftEdge / Demos > travel-site.
Step 1: Set up the website locally
First, set up the website locally, so that you can make changes to it later:
Get the website's source code locally: Clone the Edge Demos repo to your drive in Sample code for DevTools.
Open the folder you just downloaded or cloned in Visual Studio Code.
In Visual Studio Code, select View > Terminal. Or, press Ctrl+`.
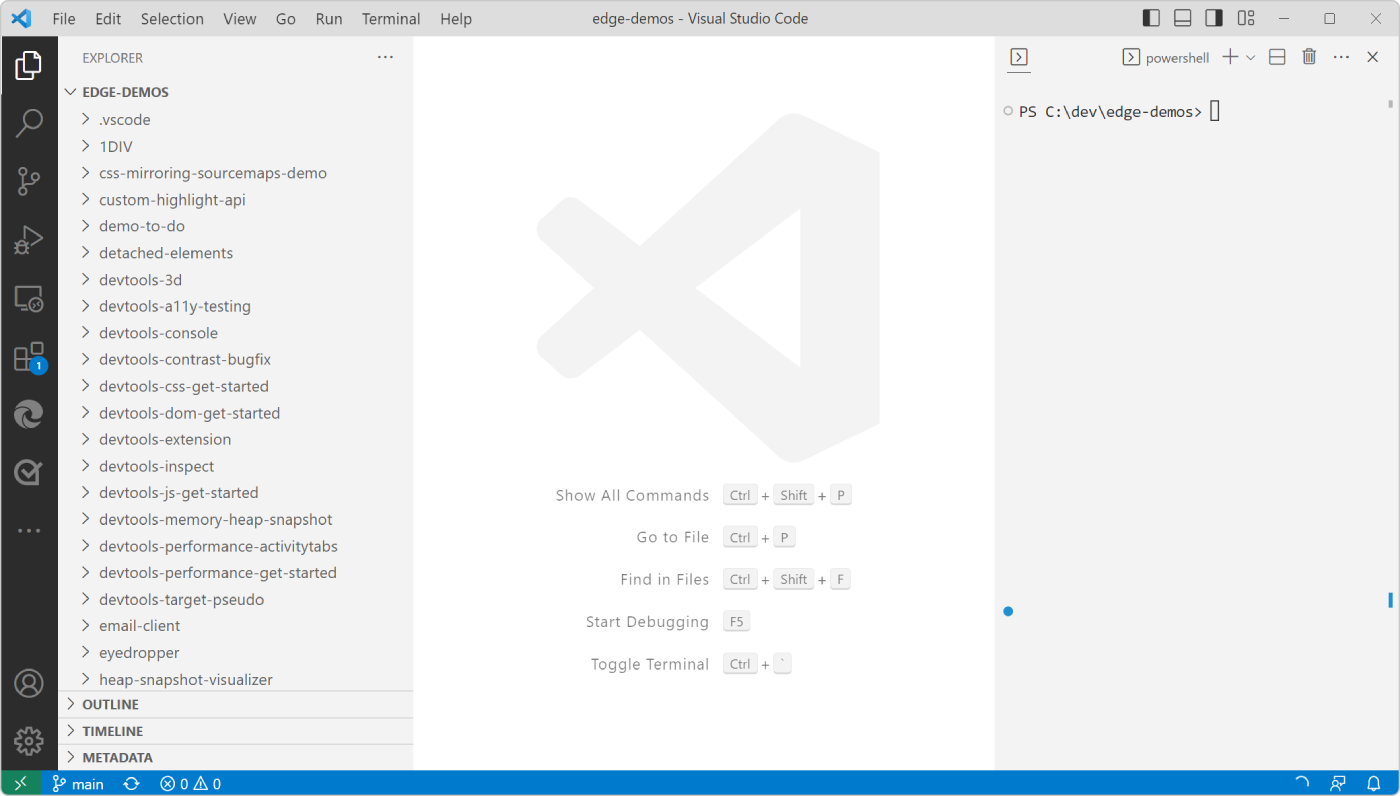
Visual Studio Code displays the source files in the Explorer sidebar, and displays the Terminal:
In the terminal, type
npx http-serverto start a local web server.This local web server will be stopped when you close Visual Studio Code.
In Microsoft Edge, go to
http://localhost:8080/travel-siteto open the website: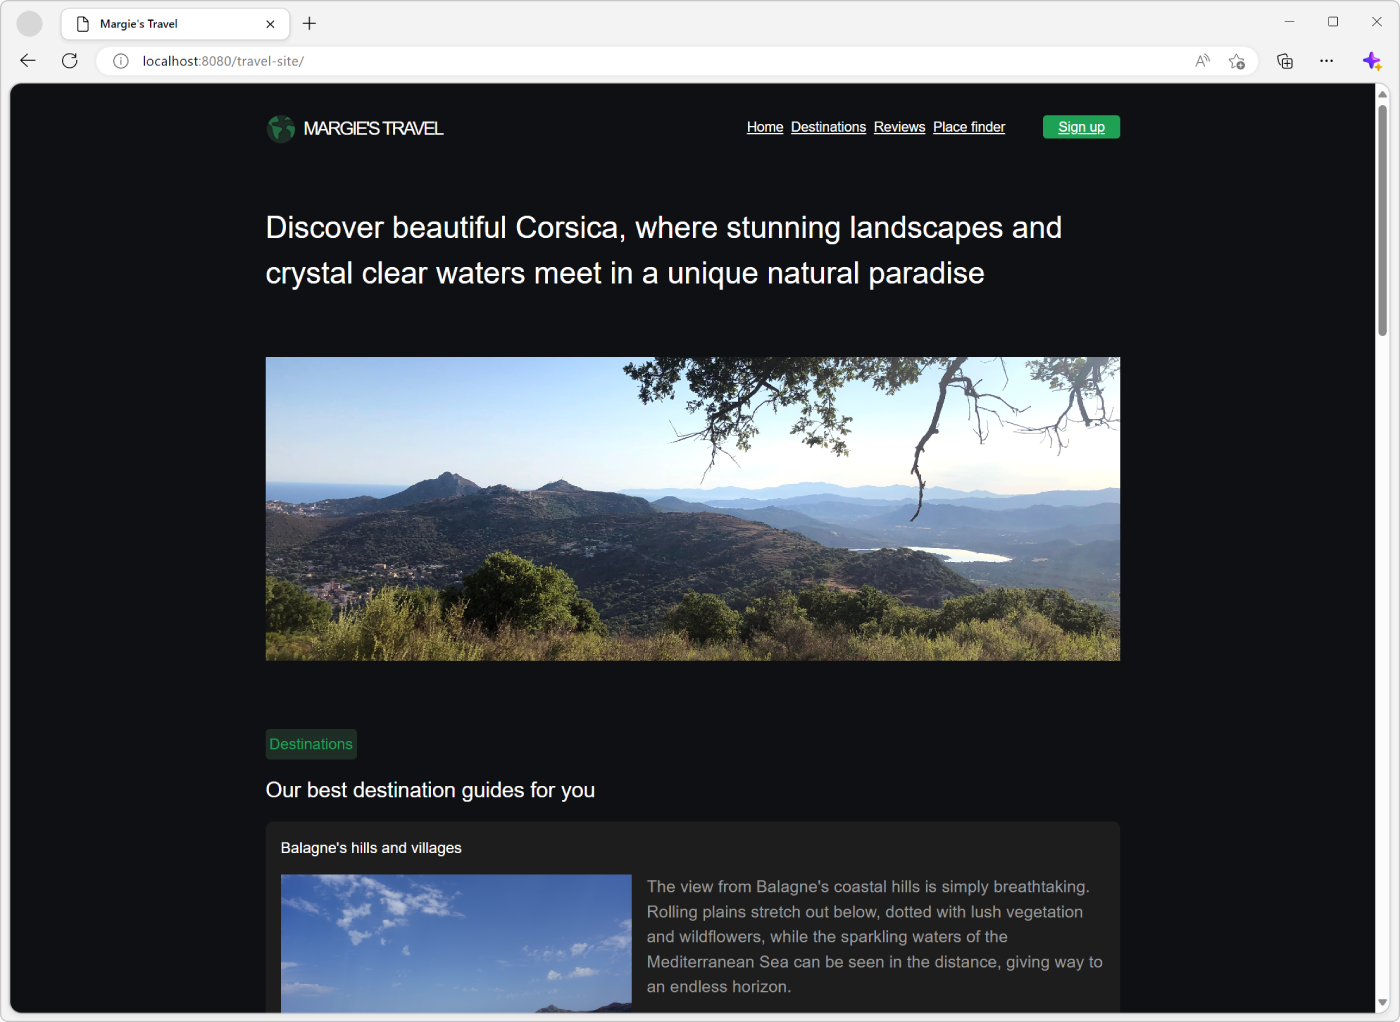
Step 2: Audit the site
Whenever you set out to improve the load performance of a site, always start with an audit.
The audit has two important functions:
It creates a baseline for you to measure subsequent changes against.
It gives you actionable tips on what changes improve performance the most.
Establish a baseline
The baseline is a record of how the site performed before you made any performance improvements.
In Microsoft Edge, open DevTools by right-clicking the webpage, and then selecting Inspect. Or, press Ctrl+Shift+I (Windows, Linux) or Command+Option+I (macOS).
In DevTools, on the main toolbar, select the Lighthouse tab. If that tab isn't visible, click the More tabs (
 ) button, or else the More Tools (
 ) button.
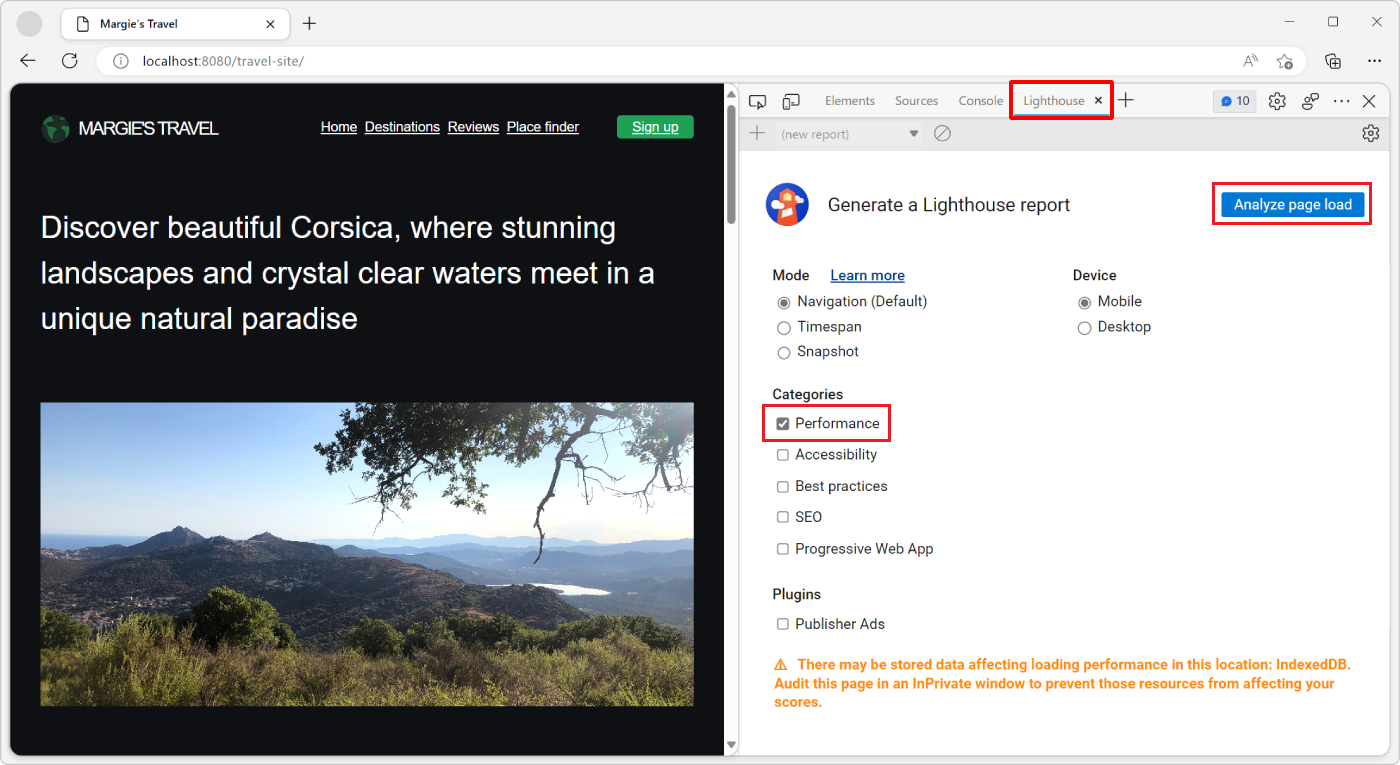
Select the Performance category, and clear all the other categories. For now, keep the other default options. The options are:
Mode: To run tests during the load of the webpage, set this option to Navigation (default). To run tests during a period of time, set the option to Timespan. To run tests on the webpage as it appears now, set the option to Snapshot.
Device: To simulate a mobile user agent string and a mobile viewport, set this option to Mobile. To test the webpage without any simulation, set this option to Desktop.
Categories: this option allows you to run only a subset of the tests available in Lighthouse.
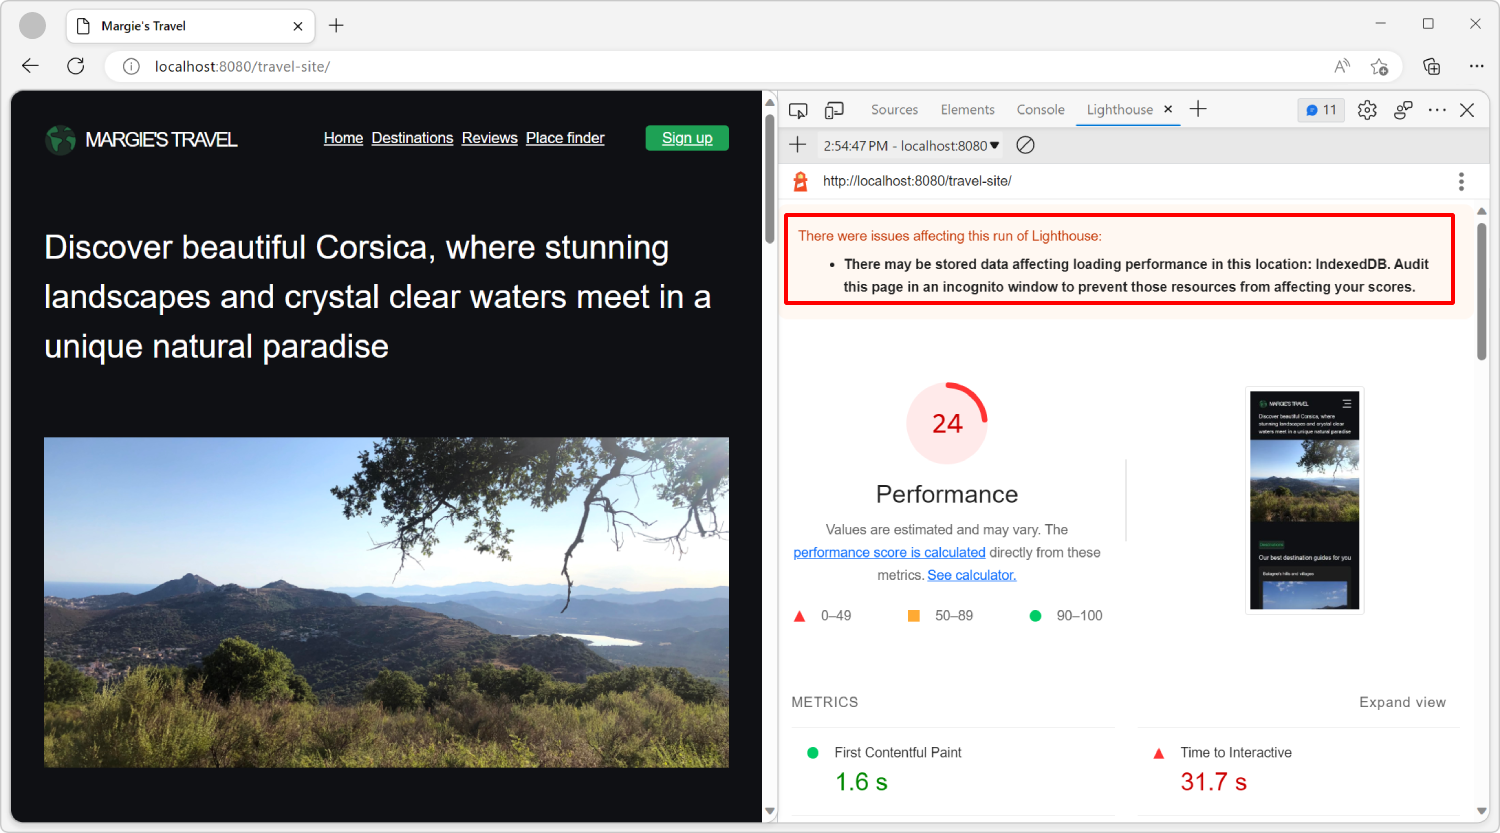
Click Analyze page load:
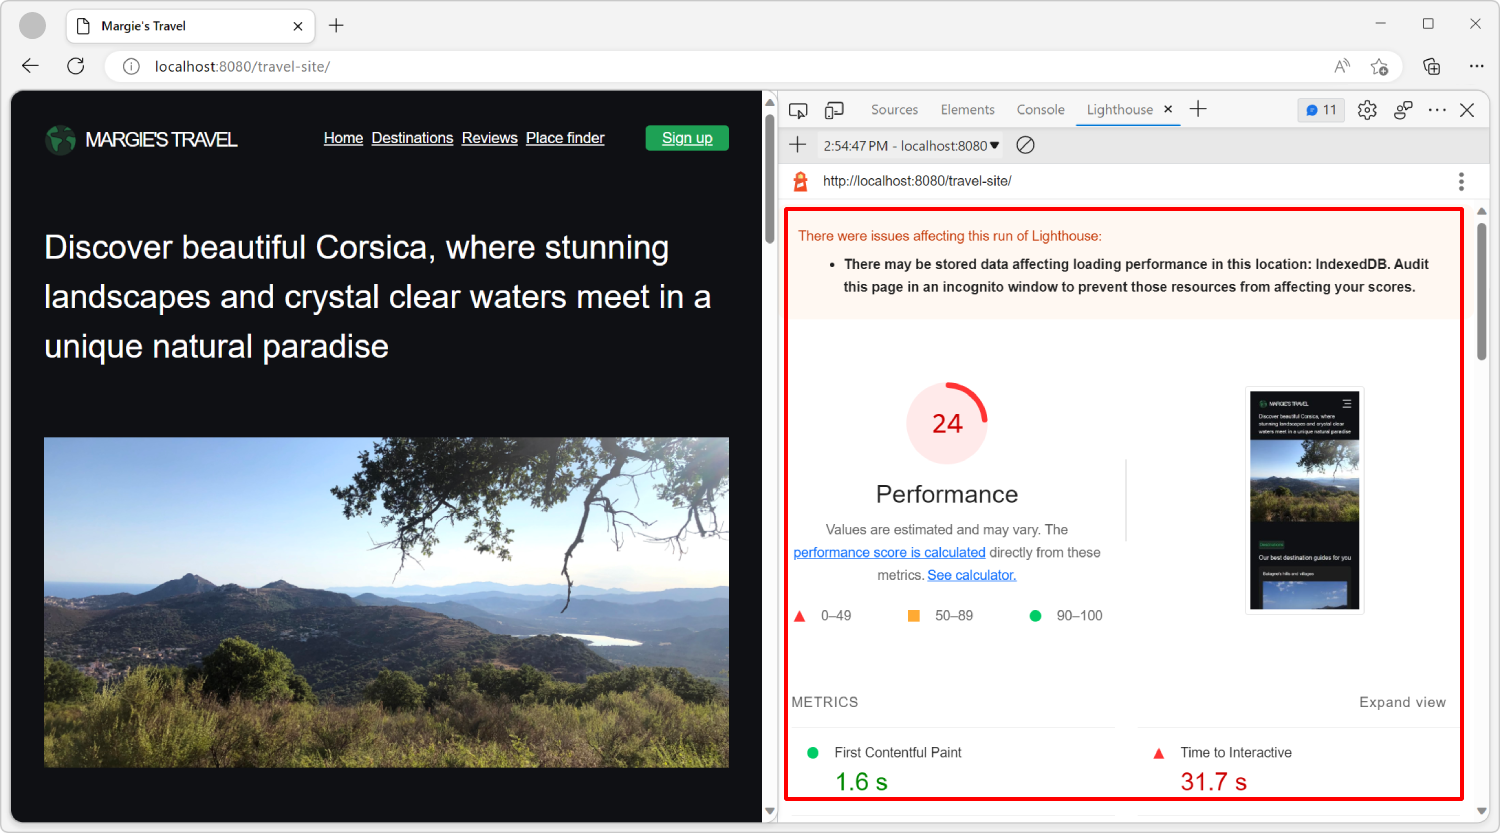
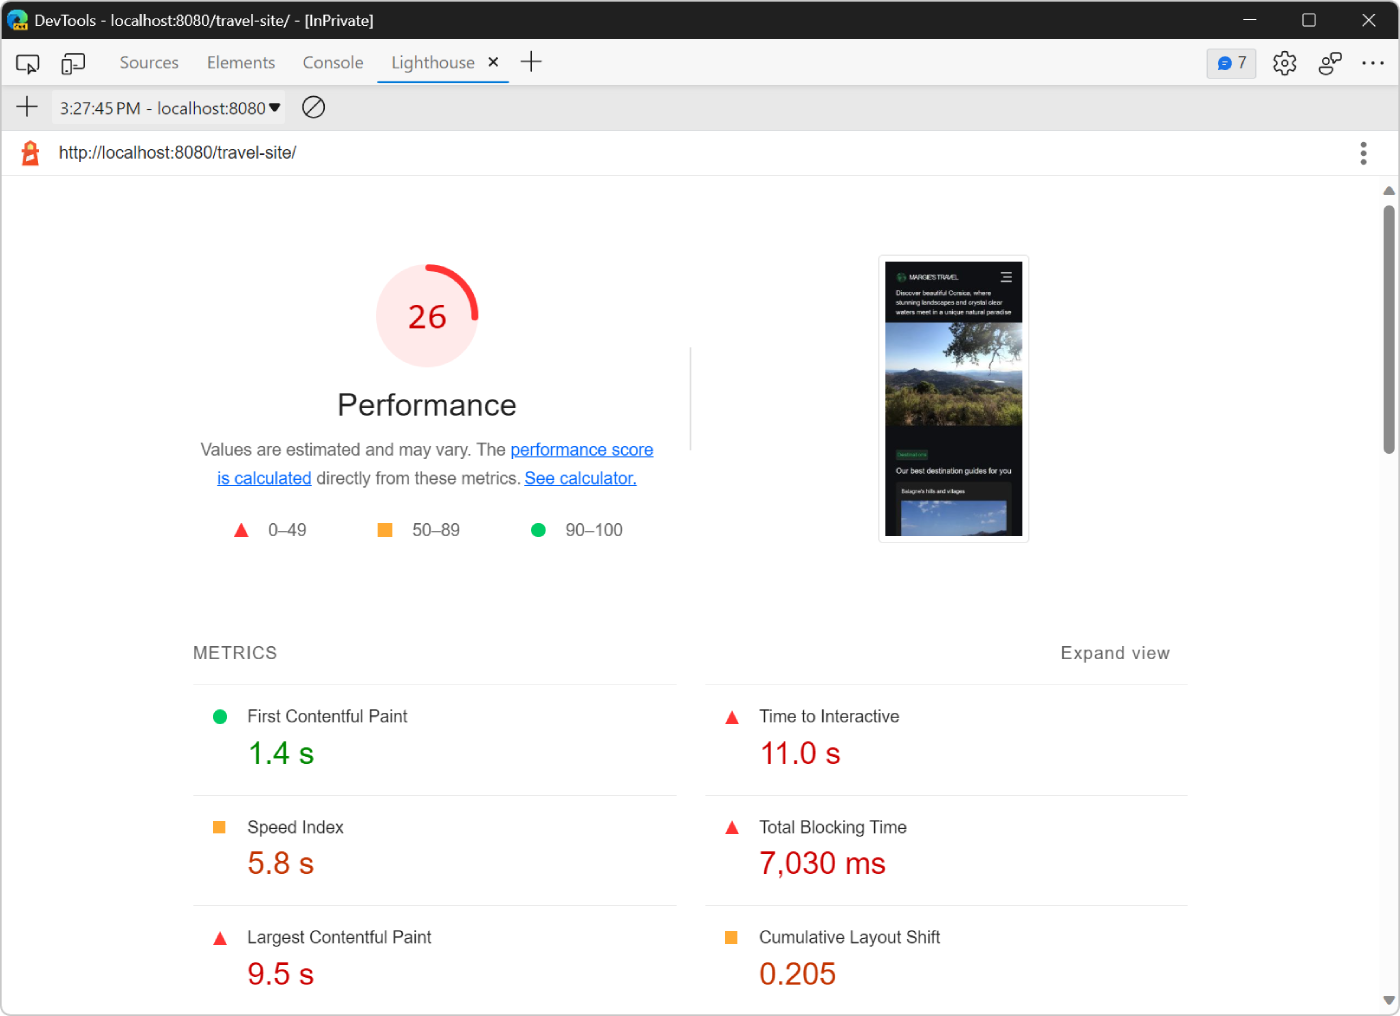
After 10 to 30 seconds, a report of the performance of the site appears:
Handling report errors
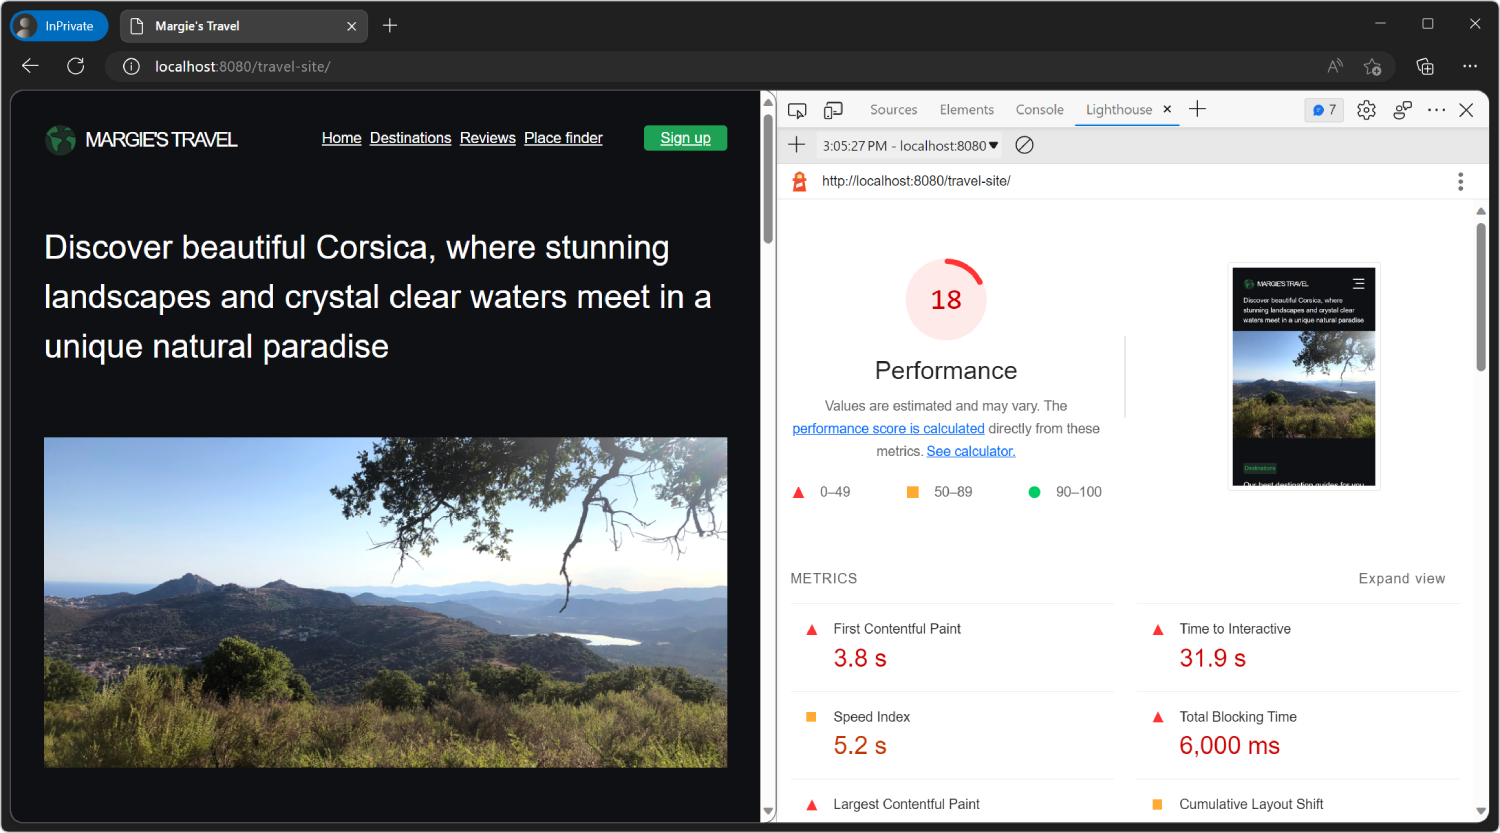
If the Lighthouse report shows errors, try running Lighthouse again from an InPrivate window, with no other tabs open. Running Lighthouse from an InPrivate window ensures that the auditing process runs without interference.
To open an InPrivate window:
Click the Settings and more (...) button in the Microsoft Edge toolbar (above the DevTools toolbar).
Click New InPrivate window.
Establish a new baseline in Lighthouse:
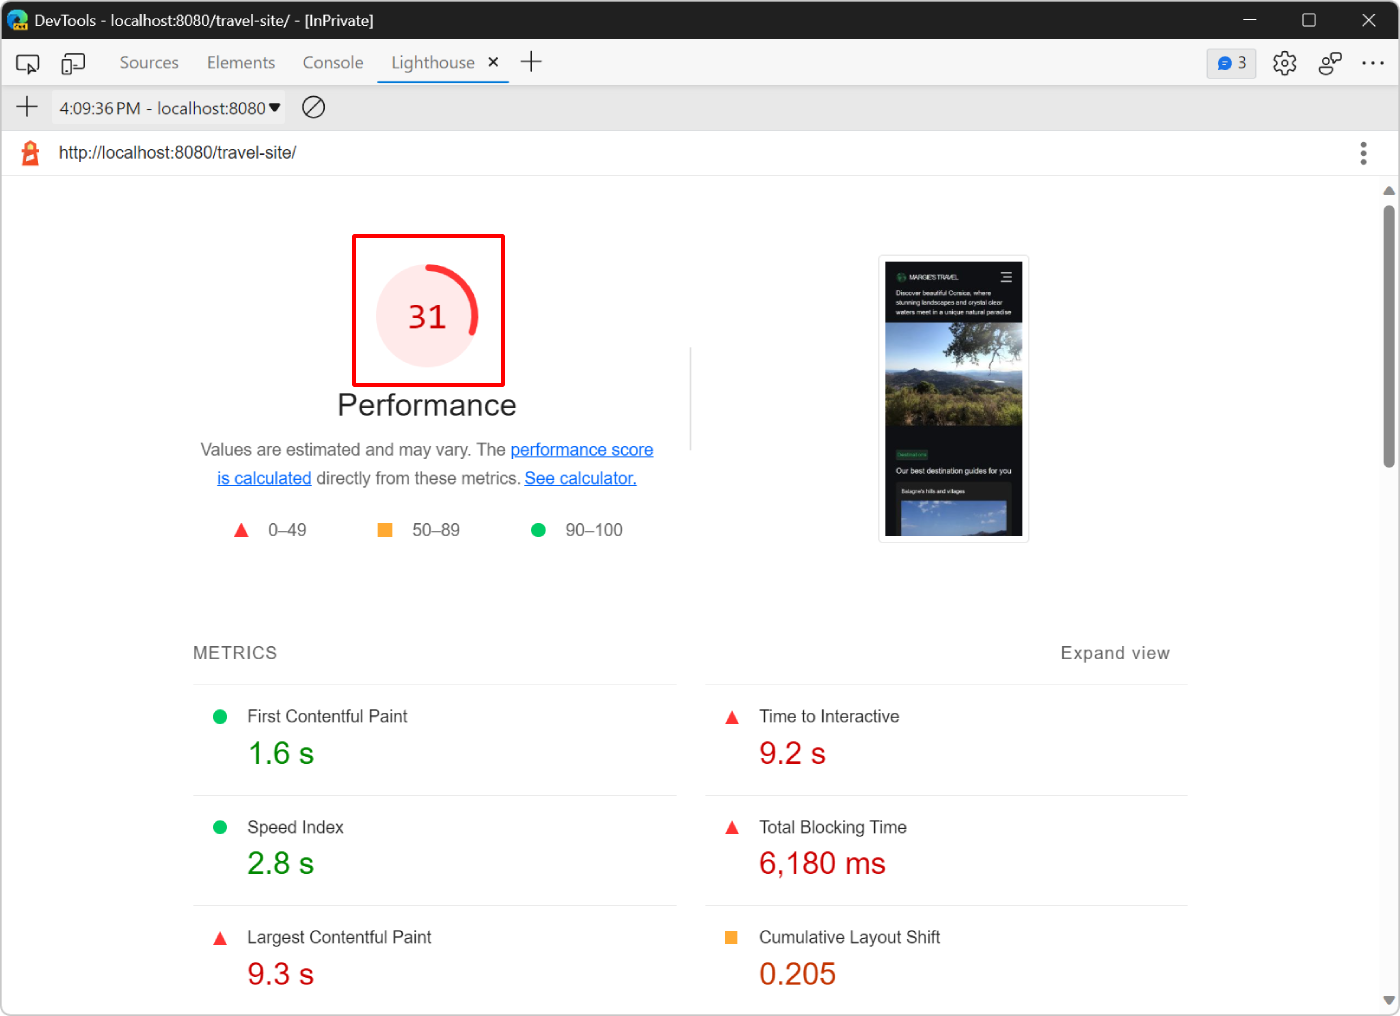
Understand your report
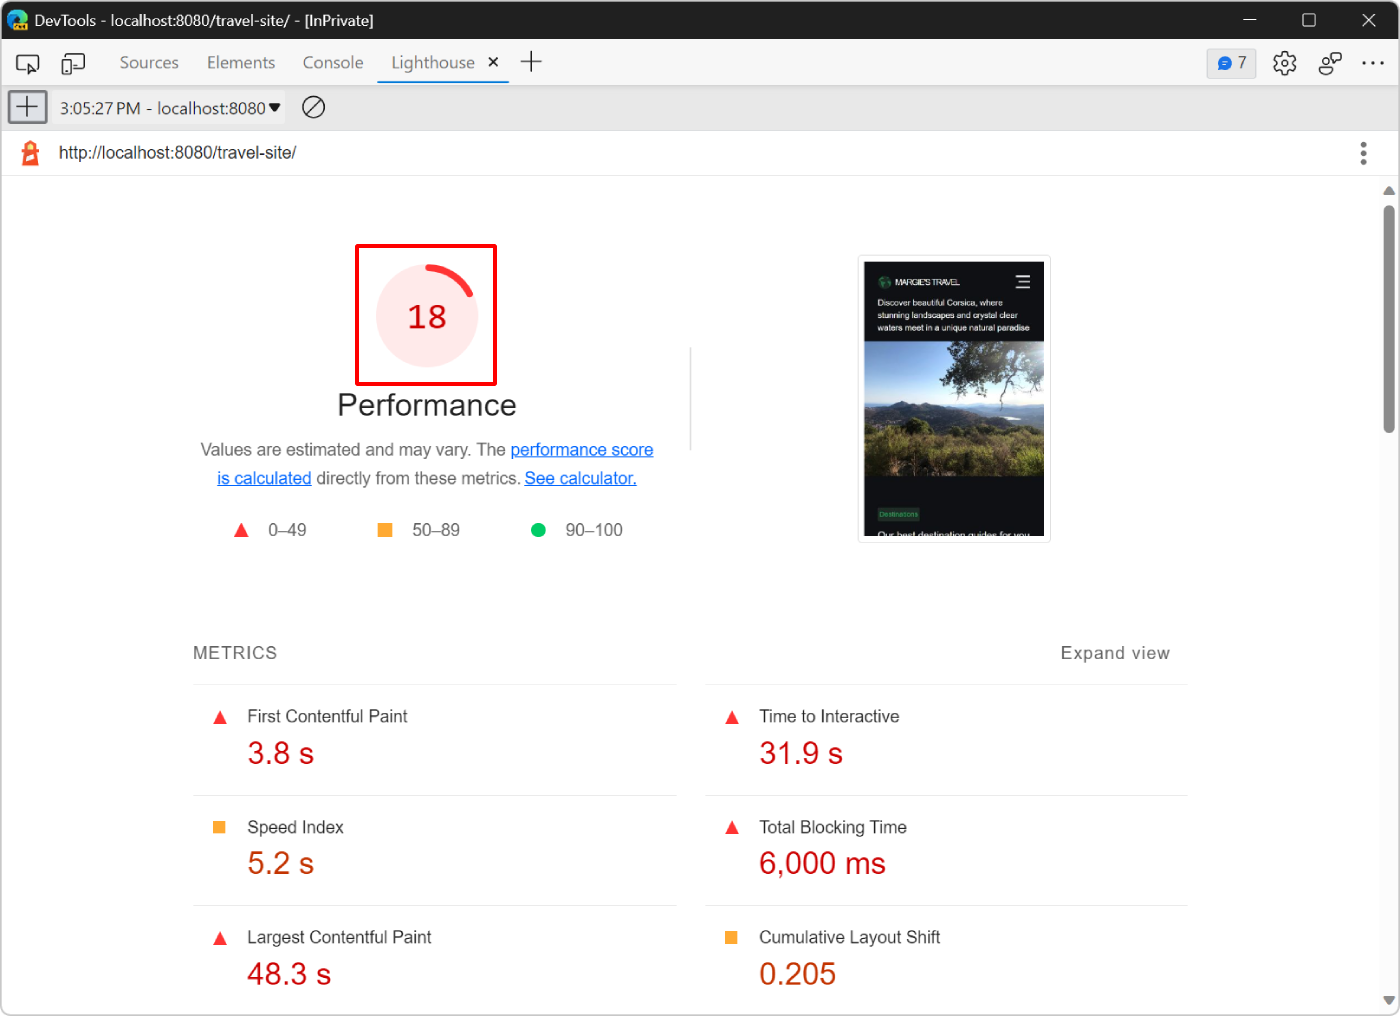
Overall performance score
The number at the top of your report is the overall performance score for the webpage. Later, as you make changes to the code, the number displayed should increase. A higher score means better performance.
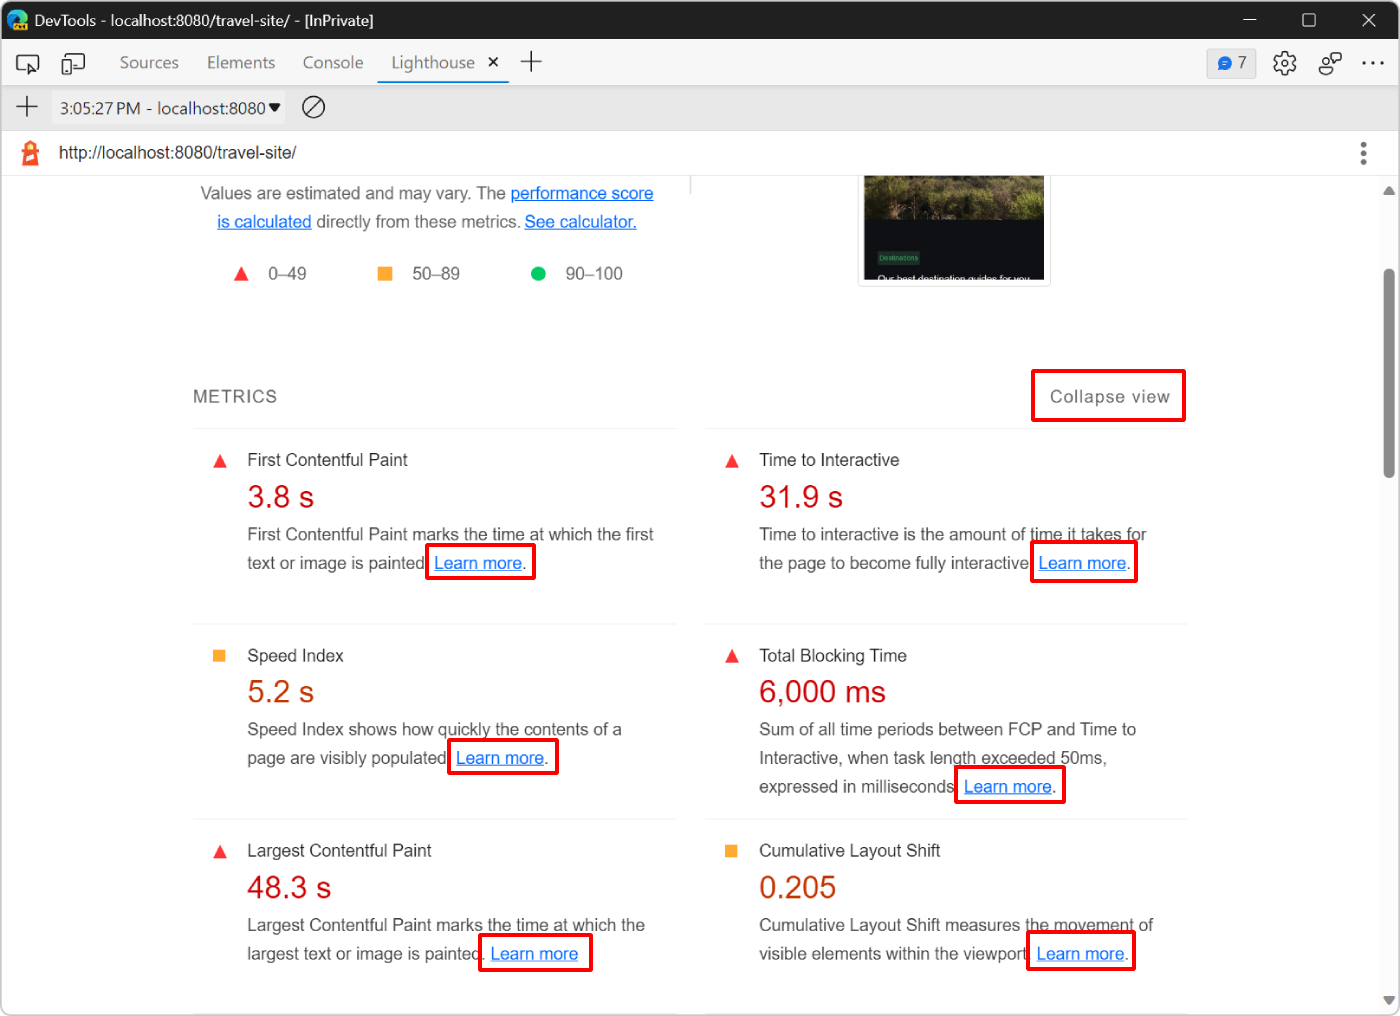
Metrics
The Metrics section provides quantitative measurements of the performance of the webpage:
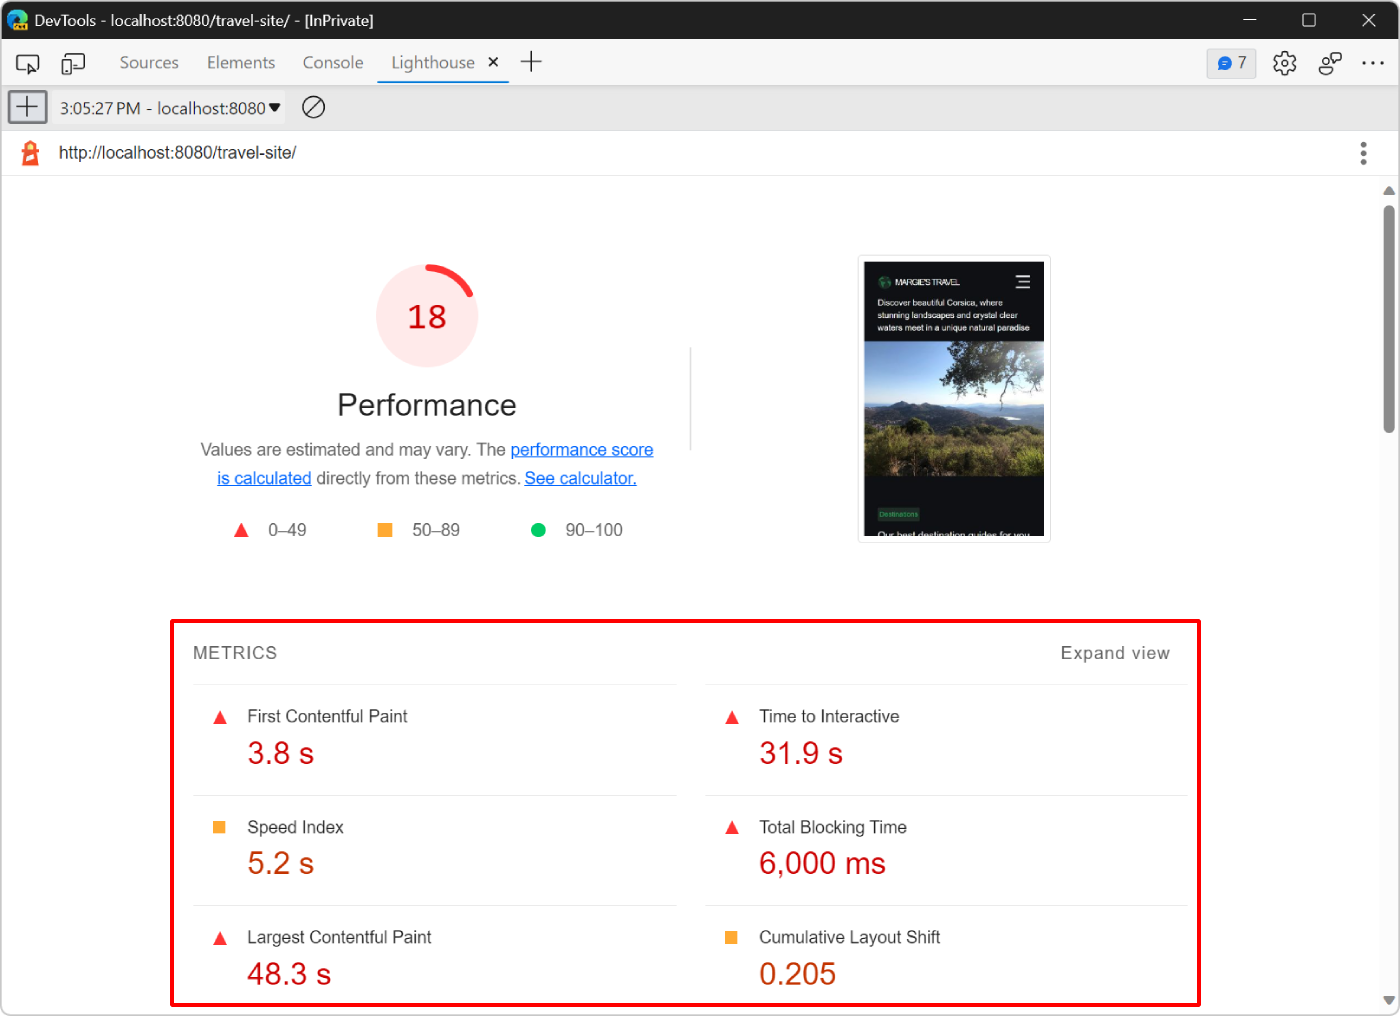
Each metric provides insight into a different aspect of the performance. For example:
- First Contentful Paint indicates when content first appears on the screen. This is an important milestone in the user's perception of the page load.
- Time To Interactive marks the point at which the rendered page is ready to handle user interactions.
Click Expand view to display a description for each metric. Then click Learn More to read documentation about it:
Screenshots
Below the Metrics section is a collection of screenshots that show you how the page looked while it was loading:
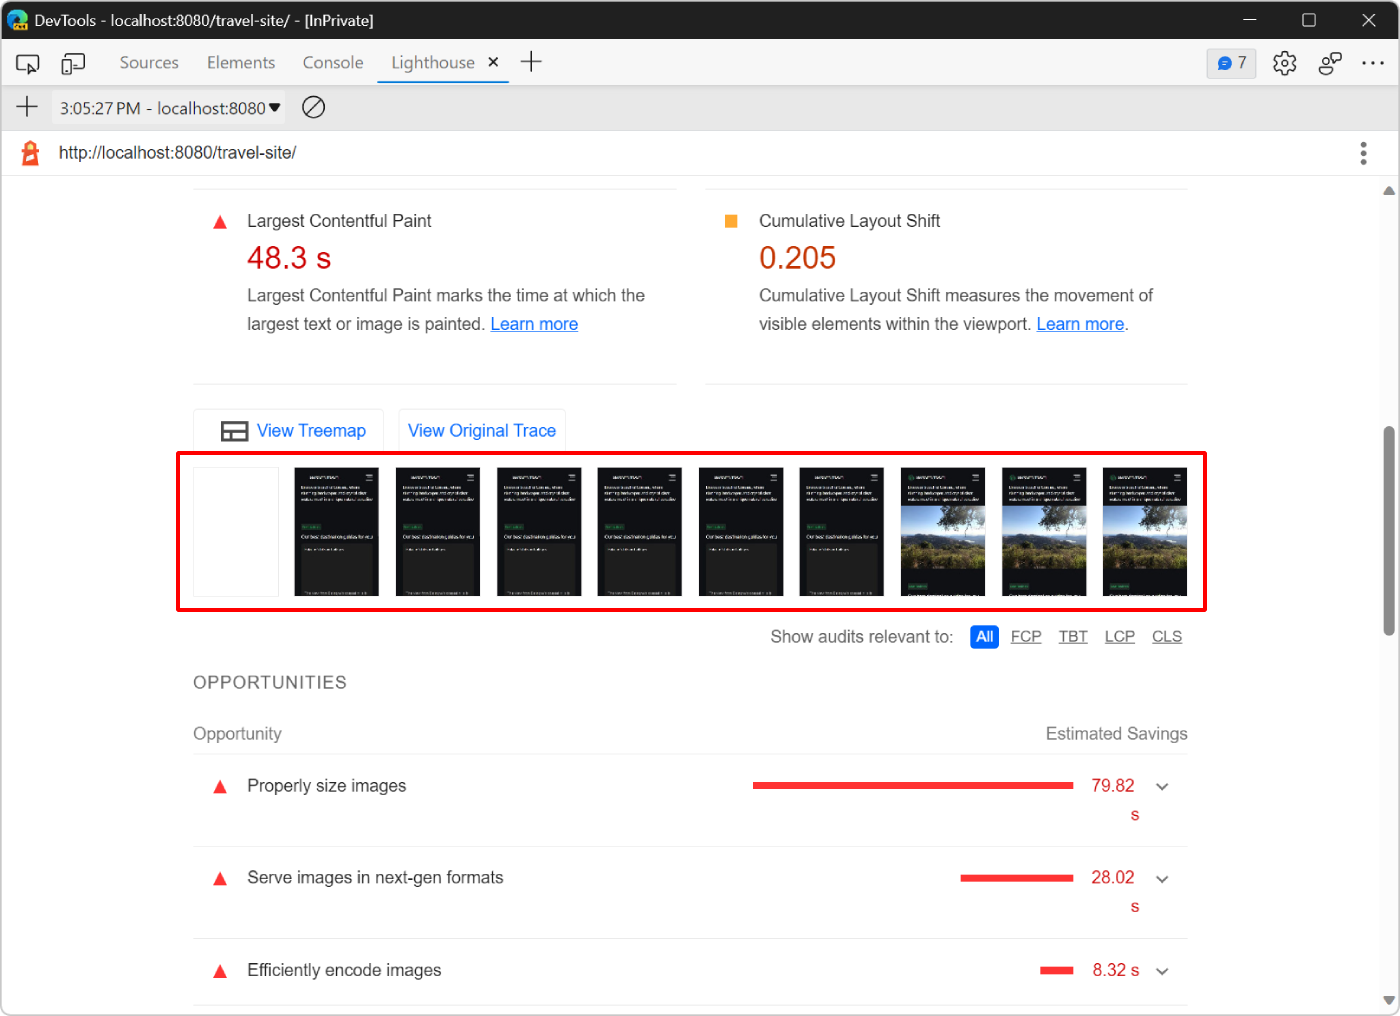
Opportunities
The Opportunities section provides specific tips on how to improve the load performance of this particular webpage:
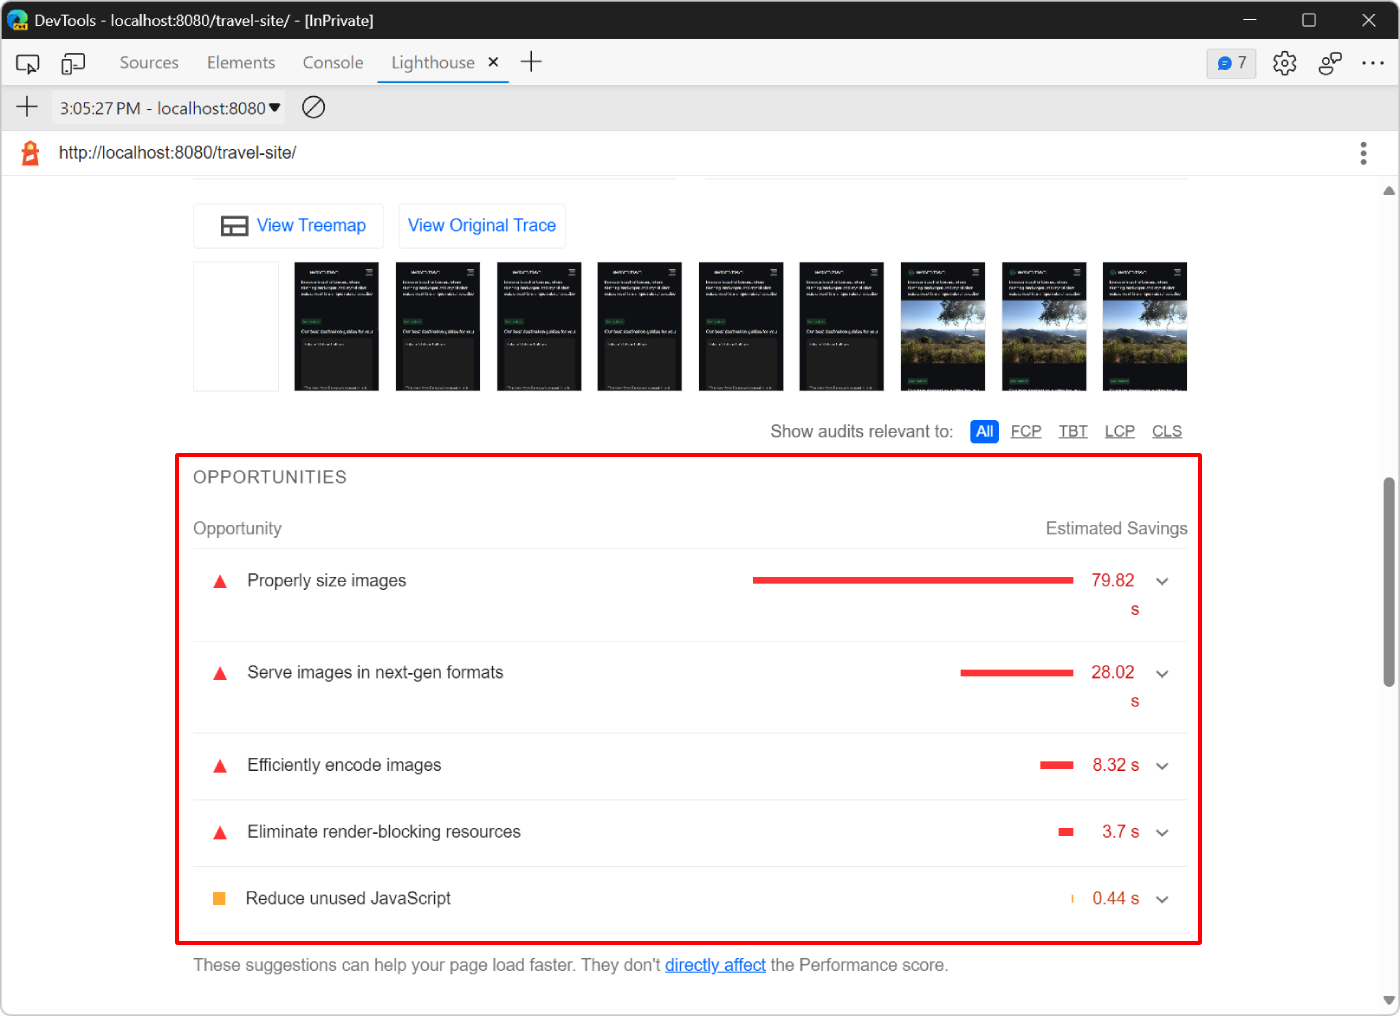
Click an opportunity to display more information about it, and then click Learn more to read about why an opportunity is important, and specific recommendations on how to fix it:
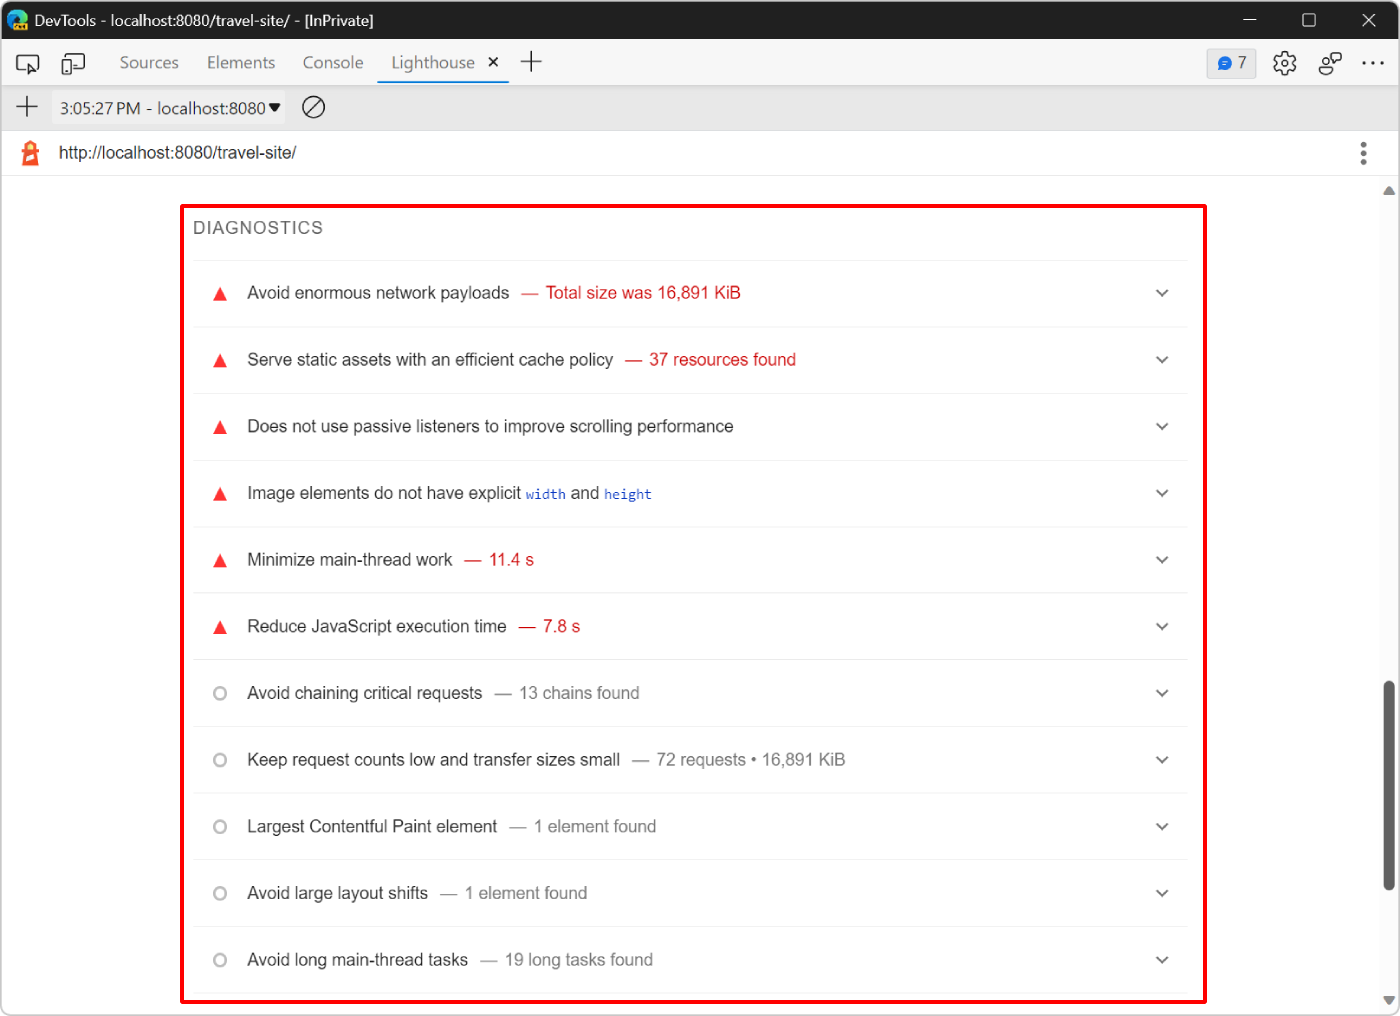
Diagnostics
The Diagnostics section provides more information about factors that contribute to the load time of the page:
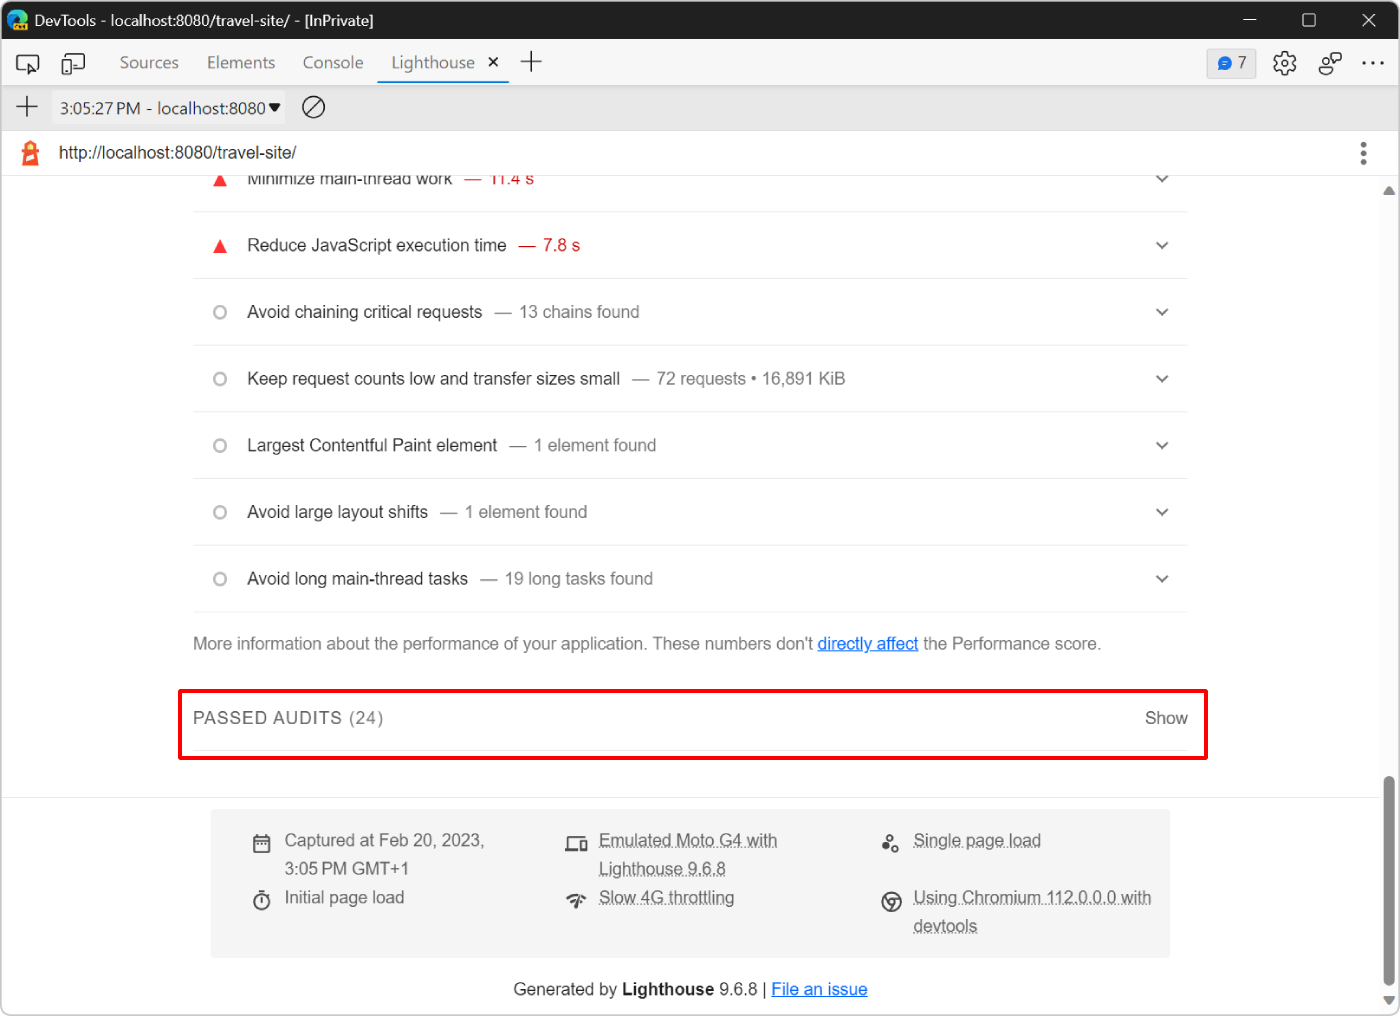
Passed audits
The Passed audits section shows you what the site is doing correctly. Click Show to expand the section:
Step 3: Experiment
The Opportunities section of your report gives you tips on how to improve the performance of the webpage. In this section, you implement the recommended changes to the code base, auditing the site again after each change to measure how that change affects site speed.
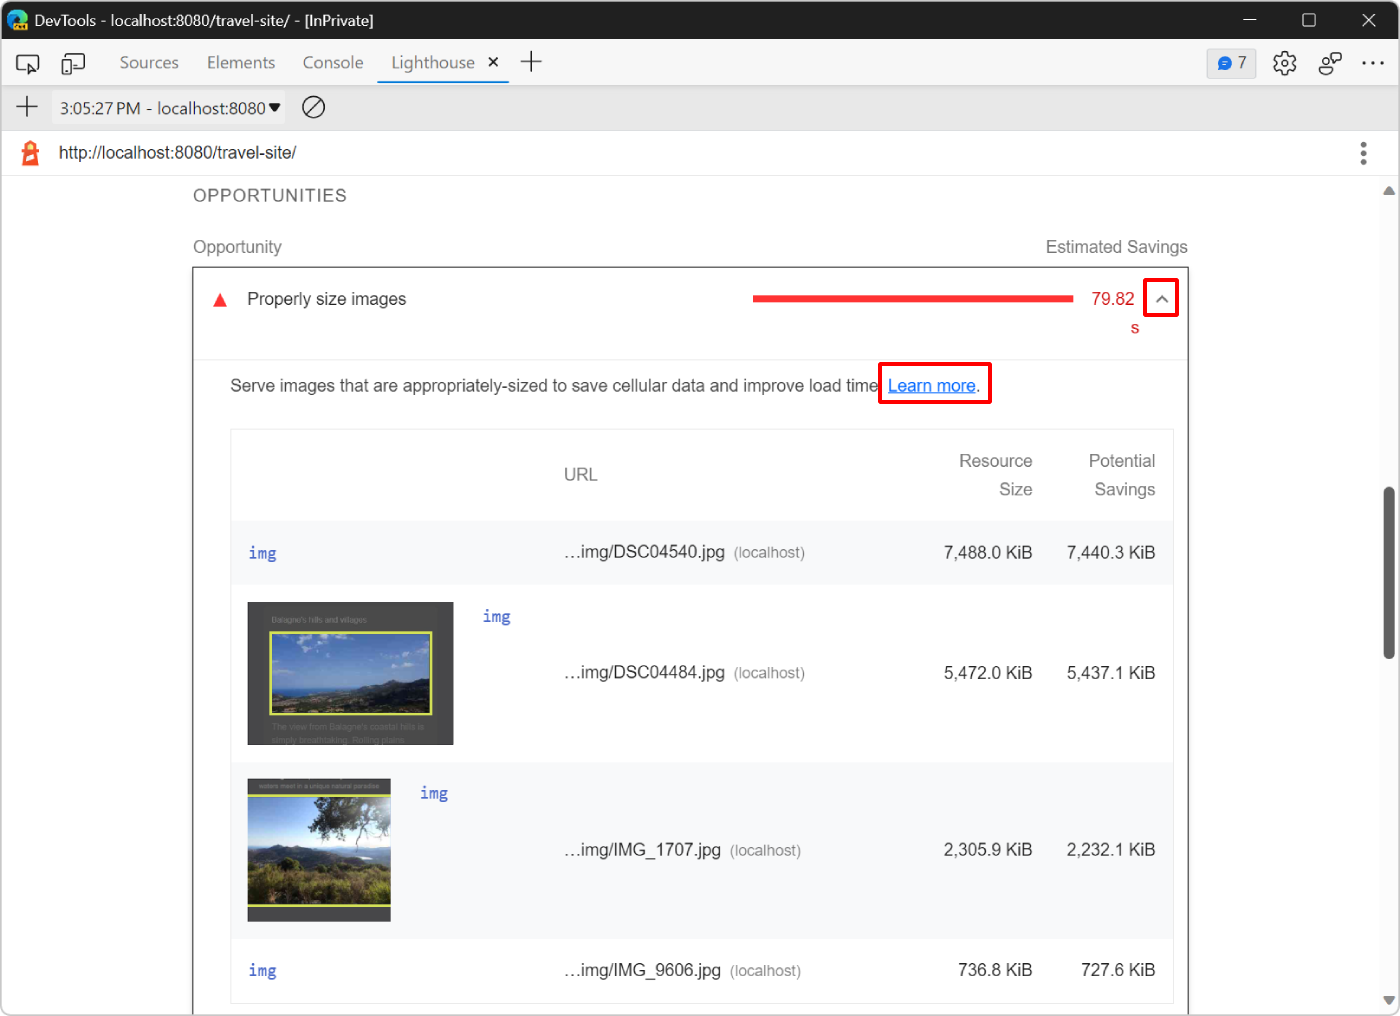
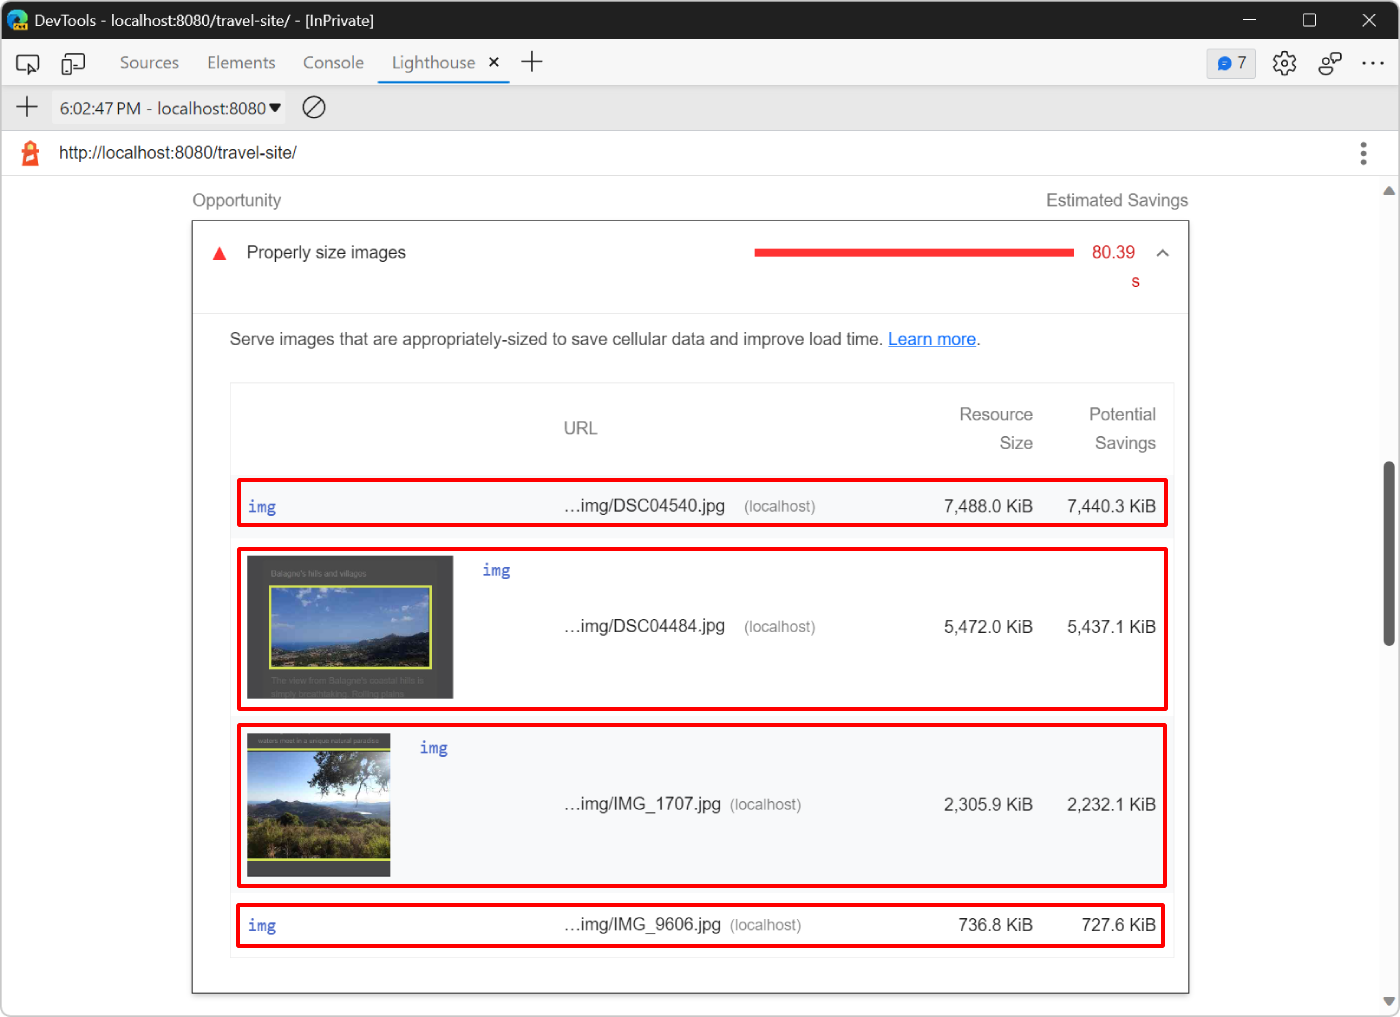
Resize images
Your report indicates that serving appropriately sized images is one of the top opportunities for improving the performance of the page. Resizing images helps reduce the size of the network payload. If your user is viewing your images on a mobile device screen that is 500 pixels wide, there's really no point in sending a 1500-pixel-wide image. Ideally, you send a 500-pixel-wide image, at most.
In the Opportunities section of your report, click Properly size images to display which images to resize. Lighthouse lists four .jpg files that you can resize to improve load time:
Before resizing these images, verify the amount of data the server must send to the browser to display these images:
Open the Network tool.
If the tool is empty, refresh the page.
In the Filter text box, type
.jpgto filter the list of requests and only show the four images.To learn more about filtering requests in the Network tool, see Filter requests in Network features reference.
Check the bottom toolbar in the Network tool to verify the amount of data transferred because of the images:
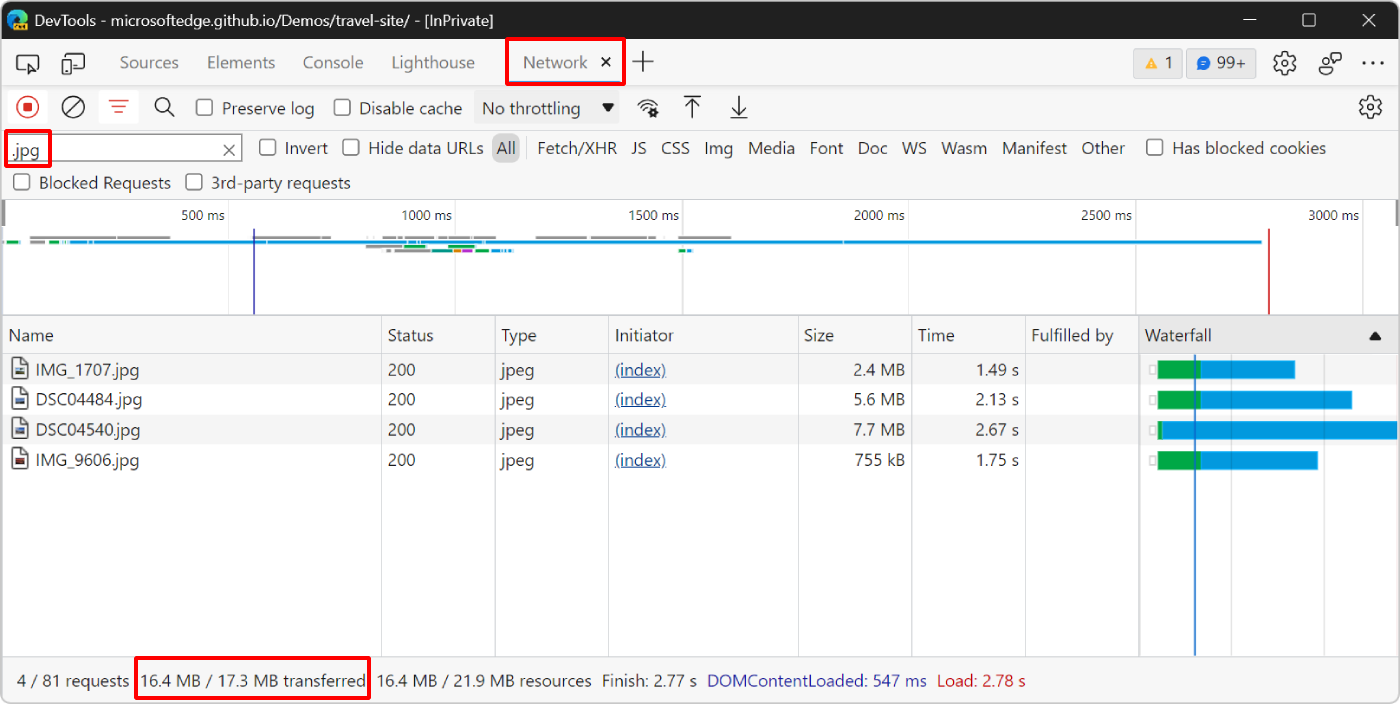
The bottom toolbar shows that the four images contribute 16.4 MB of the total 17.3 MB of data transferred for this webpage.
Next, resize the images and run a new audit:
In Visual Studio Code, open the
/travel-site/assets/img/optimized/folder in the Explorer, which contains a copy of the four images that are displayed on the webpage, but already optimized for you. These images are 1000 pixels wide, and they use the more optimized.webpformat.Resizing images depends on your operating system. For example, to resize images on Windows, you can use PowerToys. To learn more, see Image Resizer utility.
Open the
/travel-site/index.htmlfile and replace the four image paths as follows:Replace the four instances of
assets/img/in the file withassets/img/optimized.Replace the four instances of
.jpgin the file with.webp.
In Lighthouse, click Run an audit (
 ) to go back to the main Lighthouse page without losing your baseline report.
Click Analyze page load again to see how the change affects load performance:
Your score increased from 18 to 26. To verify how much data you saved, use the Network tool like you did before:
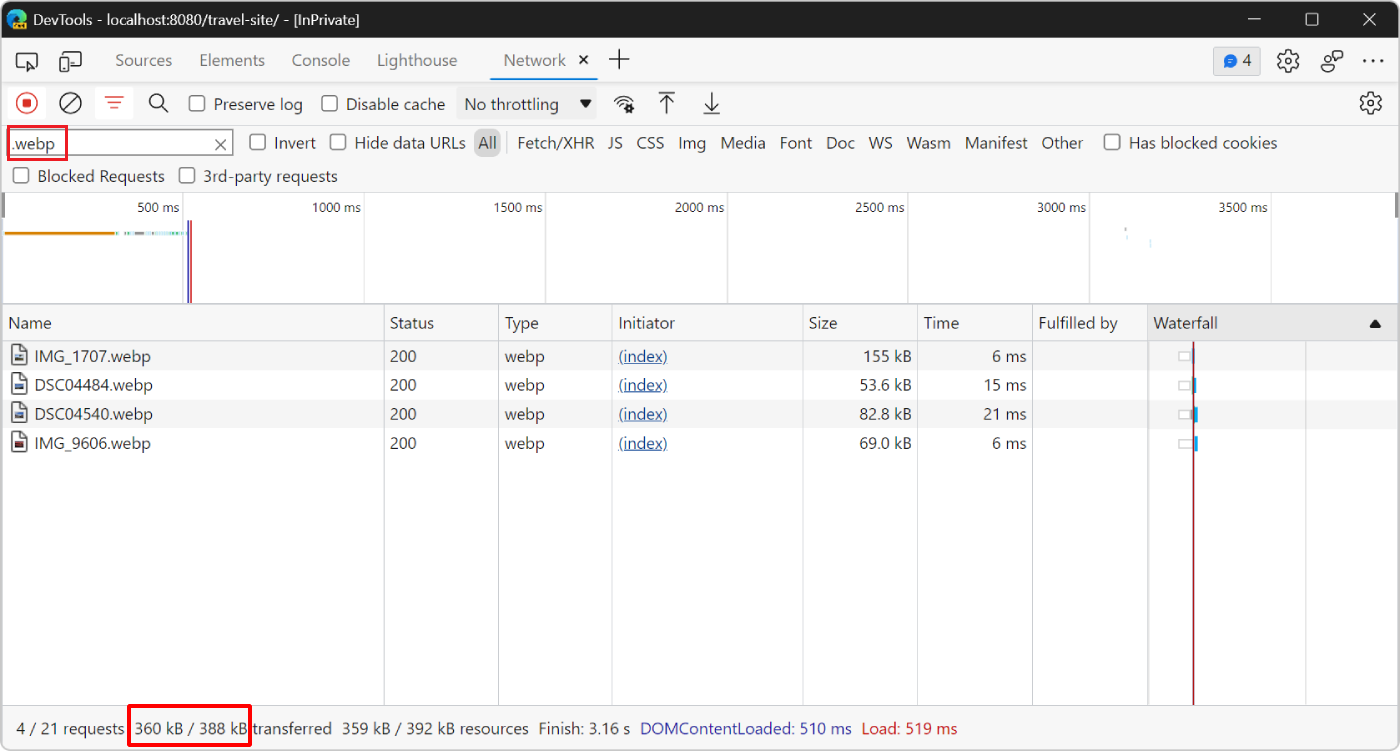
Now, the images on the webpage only require transferring 360 KB of data, instead of 16.4 MB.
Automatically resize images
For a small app, doing a one-off resize like this might be good enough. But for a large app, consider these strategies for managing images:
Automatically resize images during your build process.
Create multiple sizes of each image during the build process and then use
srcsetin your code. At runtime, the browser takes care of choosing which size is best for the device.Use an image CDN that lets you dynamically resize an image when you request it.
At least, optimize each image. This can often create huge savings.
Optimization means running an image through a program that reduces the size of the image file.
See also:
- Using responsive images in HTML at MDN.
- HTMLImageElement: srcset property at MDN.
Reduce unused JavaScript
Your latest Lighthouse report says that the webpage contains unused JavaScript code and that loading this code only when required would decrease the amount of data transferred when the page loads.
Click Reduce unused JavaScript to reveal the JavaScript files that contain the most unused code:
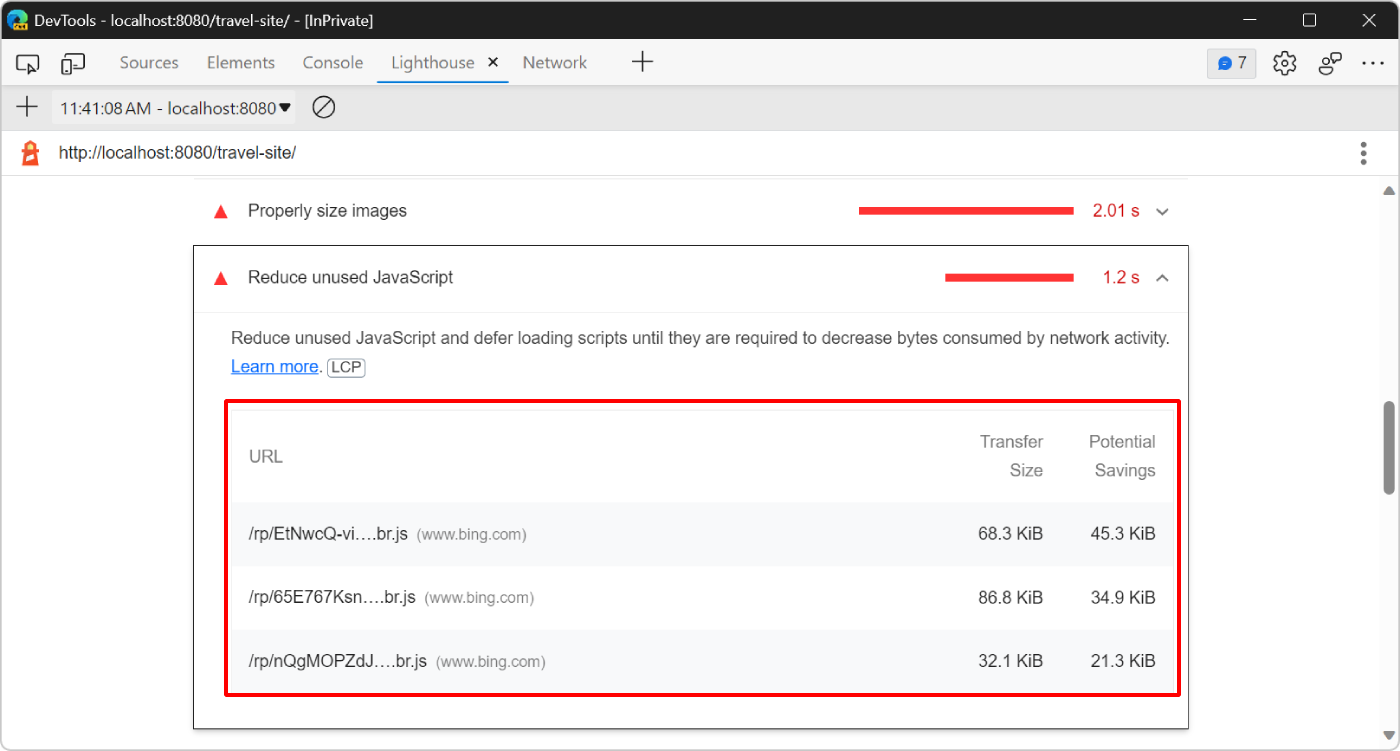
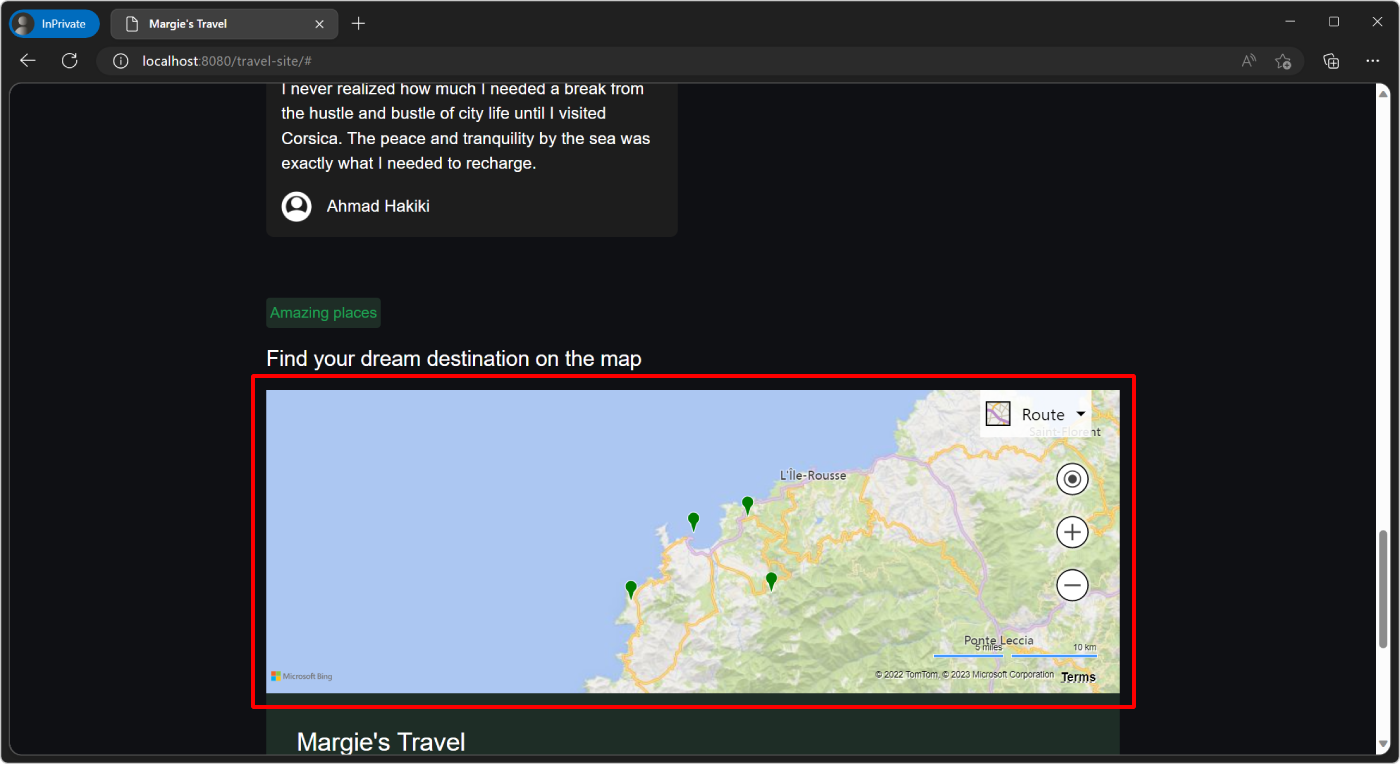
The reported JavaScript files are from the www.bing.com domain, which means the unused code comes from the Bing Map component used on the webpage. Scroll down on the Margie's travel demo website to see the map:
To confirm the amount of unused code and possibly find other resources that are unused, use the Coverage tool:
In DevTools, press Ctrl+Shift+P (Windows, Linux) or Command+Shift+P (macOS) to open the Command Menu, start typing
Coverage, and then select Show Coverage in the list.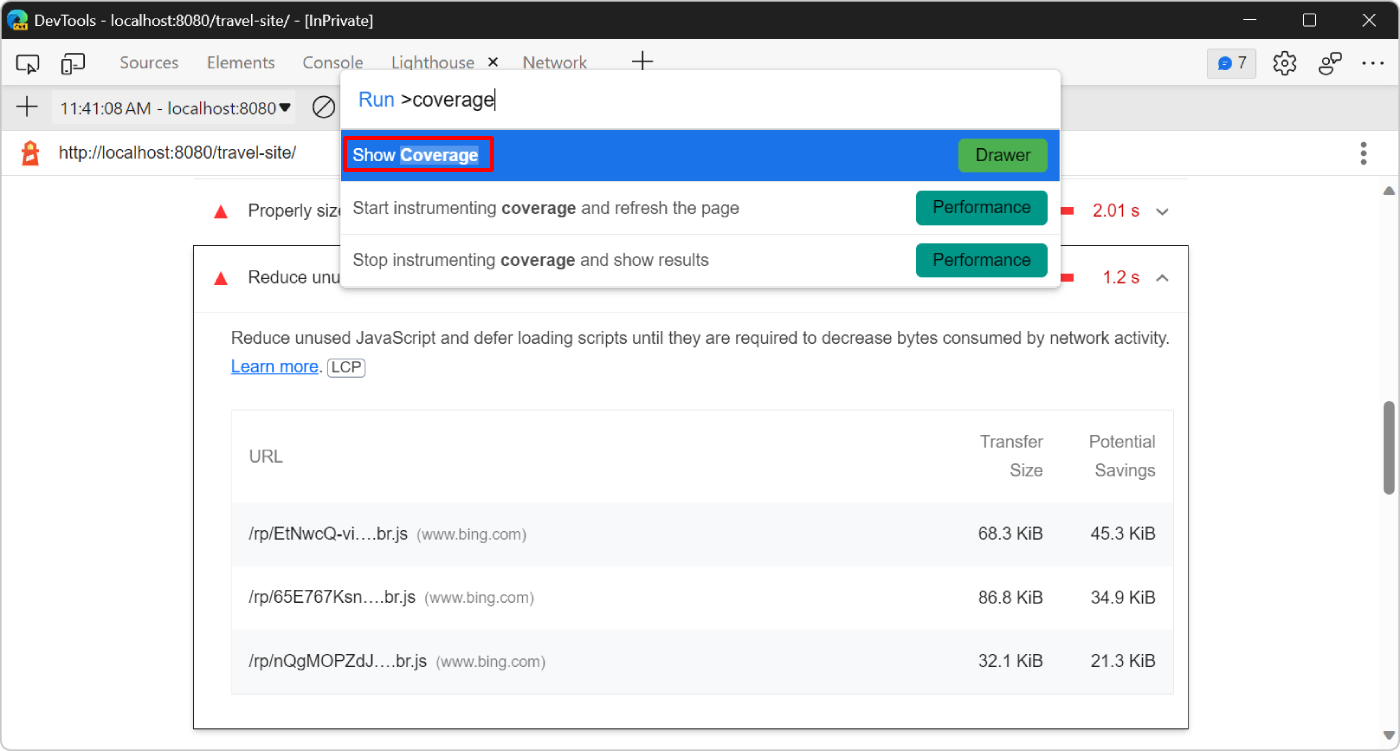
In the Coverage tool, click Start instrumenting coverage and refresh the page (
 ). The Coverage tool provides an overview of how much of the JavaScript and CSS code that's loaded on the page was actually run.
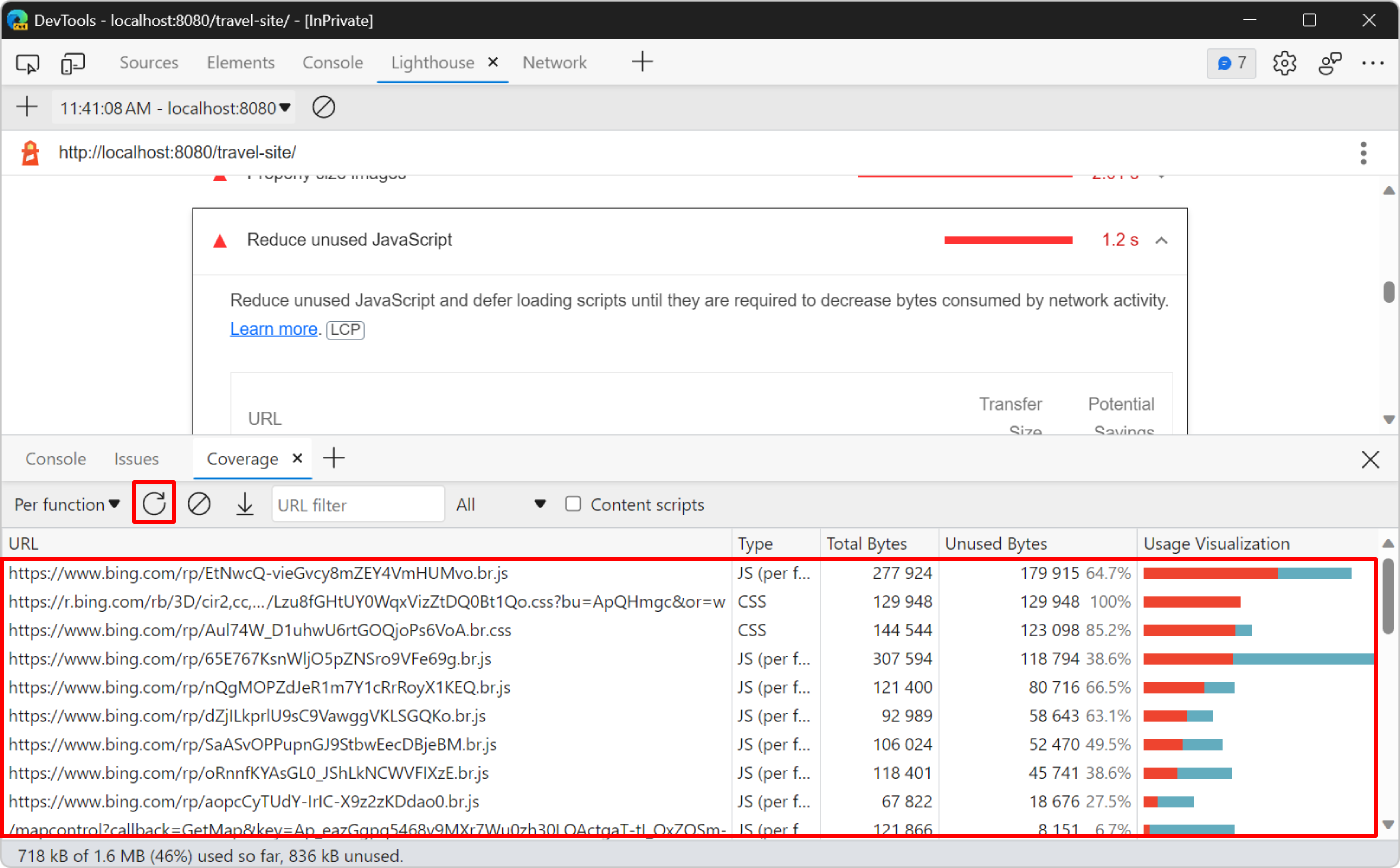
The coverage report confirms that the Bing Map dependencies contain code that's unused when the page loads. The map on the demo website isn't visible when the page first loads. There's a good opportunity to improve performance by loading the Bing Map only when that section of the page becomes visible to users.
Use the Intersection Observer API to detect when the map becomes visible to the user. The Intersection Observer API provides a way to observe changes in the intersection of a target element (the map, in this case) with the webpage's viewport. To learn more, see Intersection Observer API at MDN.
In Visual Studio Code, open the
/travel-site/index.htmlfile and scroll down to the bottom of the file. The Bing Map API is loaded by using a<script>tag: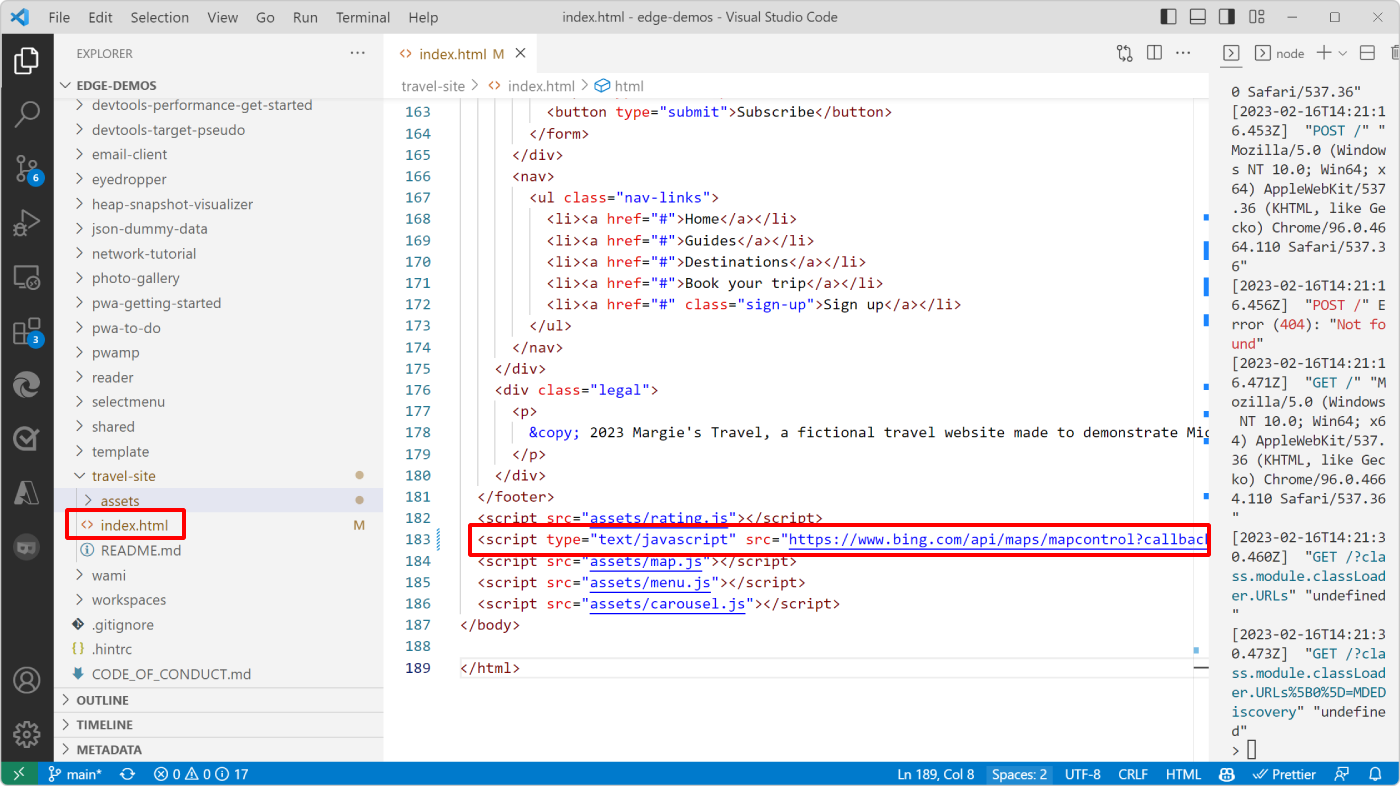
Below this line is another line that's responsible for configuring and loading the map in the right place:
<script src="assets/map.js"></script>Delete these two lines and add this new line instead:
<script src="assets/map-on-demand.js"></script>.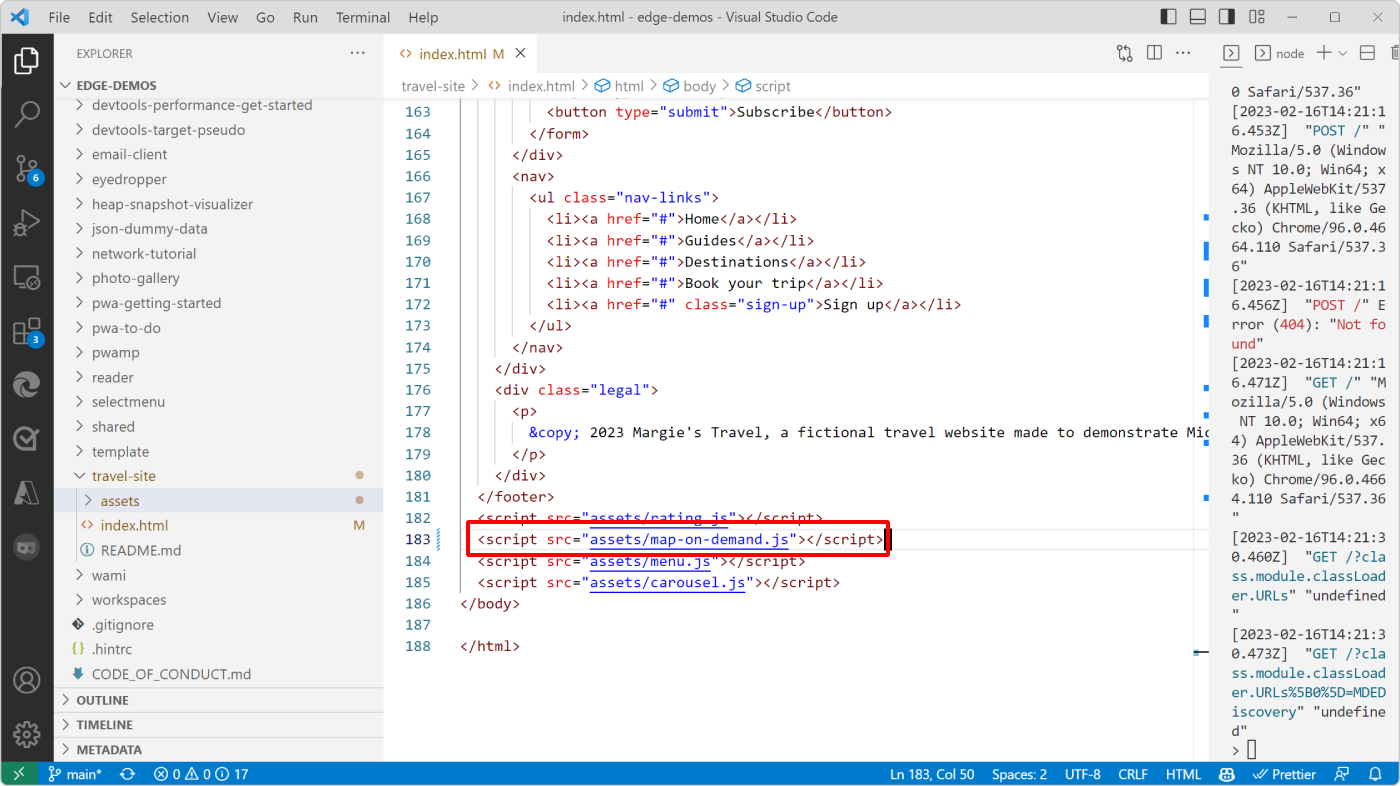
Open the
/travel-site/assets/map-on-demand.jsfile in Visual Studio Code and read through the code to understand how it loads and initializes the Bing Map component. Here is a snippet from that code along with a description of how it works:const MAP_CONTAINER_EL = document.querySelector('.place-discover-map'); const mapElIntersectionObserver = new IntersectionObserver(loadMapOnDemand); mapElIntersectionObserver.observe(MAP_CONTAINER_EL); let map = null; function loadMapOnDemand(entries) { if (map) { return; } if (!entries.some(entry => entry.isIntersecting)) { return; } const script = document.createElement('script'); script.type = 'text/javascript'; script.src = 'https://www.bing.com/api/maps/mapcontrol?callback=GetMap&key=Ap_eazGgpq5468v9MXr7Wu0zh30LQActgaT-tI_QxZQSm-Bd5qJxVKs_2B7NsqR4'; document.body.appendChild(script); } function GetMap() { /* ... */ }The code initializes the
mapElIntersectionObservervariable to a newIntersectionObserverobject. This observer then starts observing theMAP_CONTAINER_ELelement, which is the element on the page that's meant to contain the map.As the user scrolls, the observer's
loadMapOnDemandcallback function runs. This function doesn't do anything when the map already exists, or if the map container element doesn't intersect the current viewport.If the user scrolls to a point where the map container element becomes visible in the viewport, and if the map isn't initialized yet, the code creates a new
scriptelement, sets itssrcattribute to the Bing Map API, and inserts thescriptinto the page.The rest of the
map-on-demand.jsfile is the same as themap.jsfile. As soon as the Bing Map API loads, theGetMapfunction runs.GetMapconfigures and displays the map in the container element.Save your changes in Visual Studio Code, then refresh the webpage in Microsoft Edge, and run a new audit in the Lighthouse tool to see how your changes affect the load performance:
Your Lighthouse score is now at 31, which is an improvement from before, but there are more things to optimize.
Eliminate render-blocking resources
The next opportunity displayed in the Opportunities section of the Lighthouse tool is related to eliminating render-blocking resources.
A render-blocking resource is an external JavaScript or CSS file that the browser must download, parse, and run before it displays the page. The more render-blocking resources need to be processed when a webpage loads, the longer the webpage needs, to start appearing in the browser. Try to only run the core CSS and JavaScript code that's required to display the initial state of the page properly.
The first task, then, is to find code that you don't need to run on page load.
Click Eliminate render-blocking resources to display the resources that are blocking:
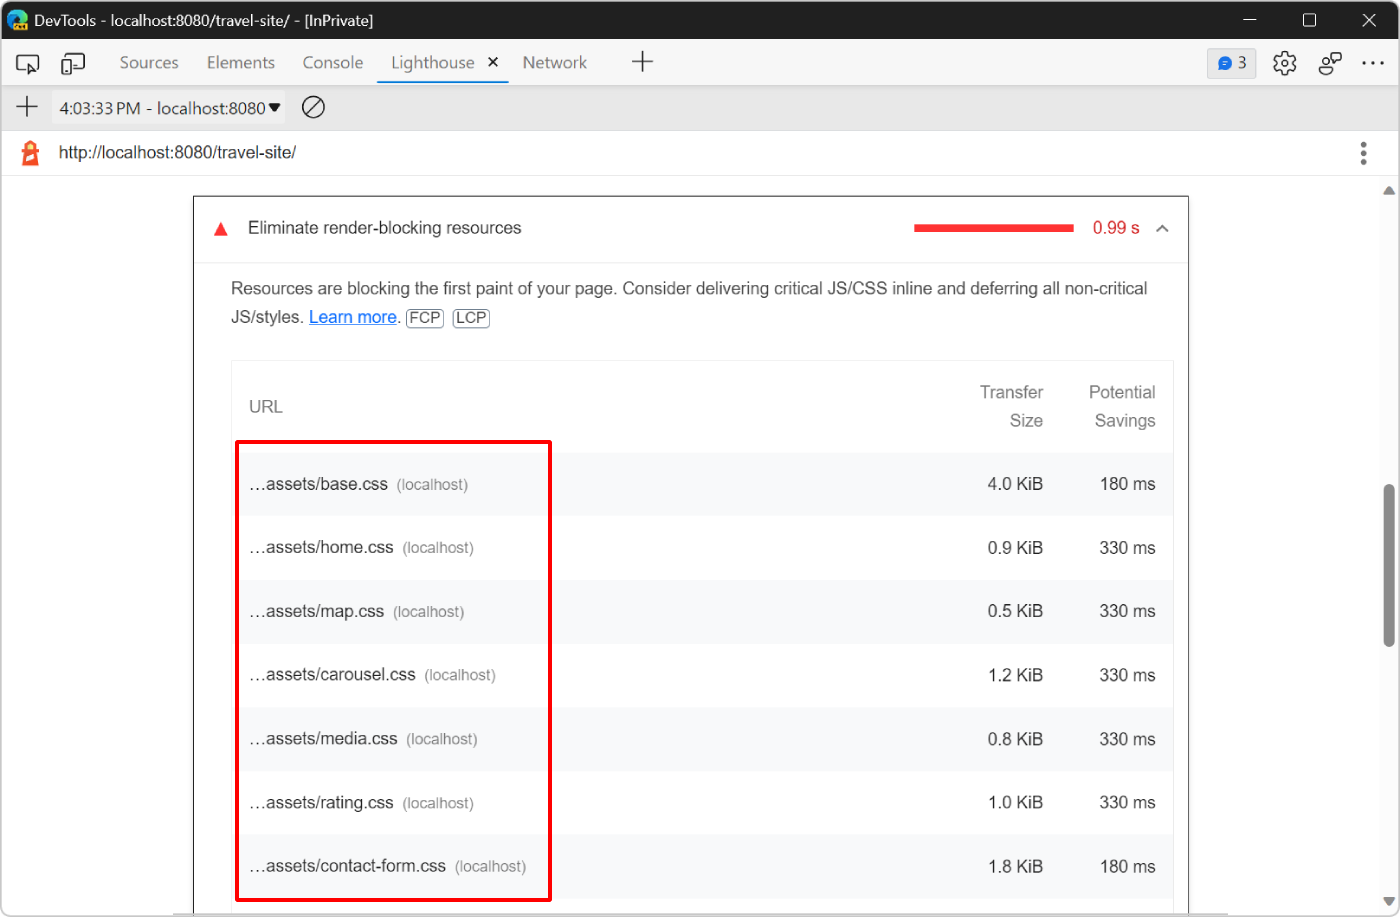
Lighthouse displays a list of the stylesheets that the demo webpage uses, such as:
base.css,home.css, andmap.css.Open the Coverage tool again: press Ctrl+Shift+P (Windows, Linux) or Command+Shift+P (macOS), type Coverage, and then select Show Coverage.
Click Start instrumenting coverage and refresh the page (
) to display the coverage report, and then type cssin the URL filter field to only display the CSS files: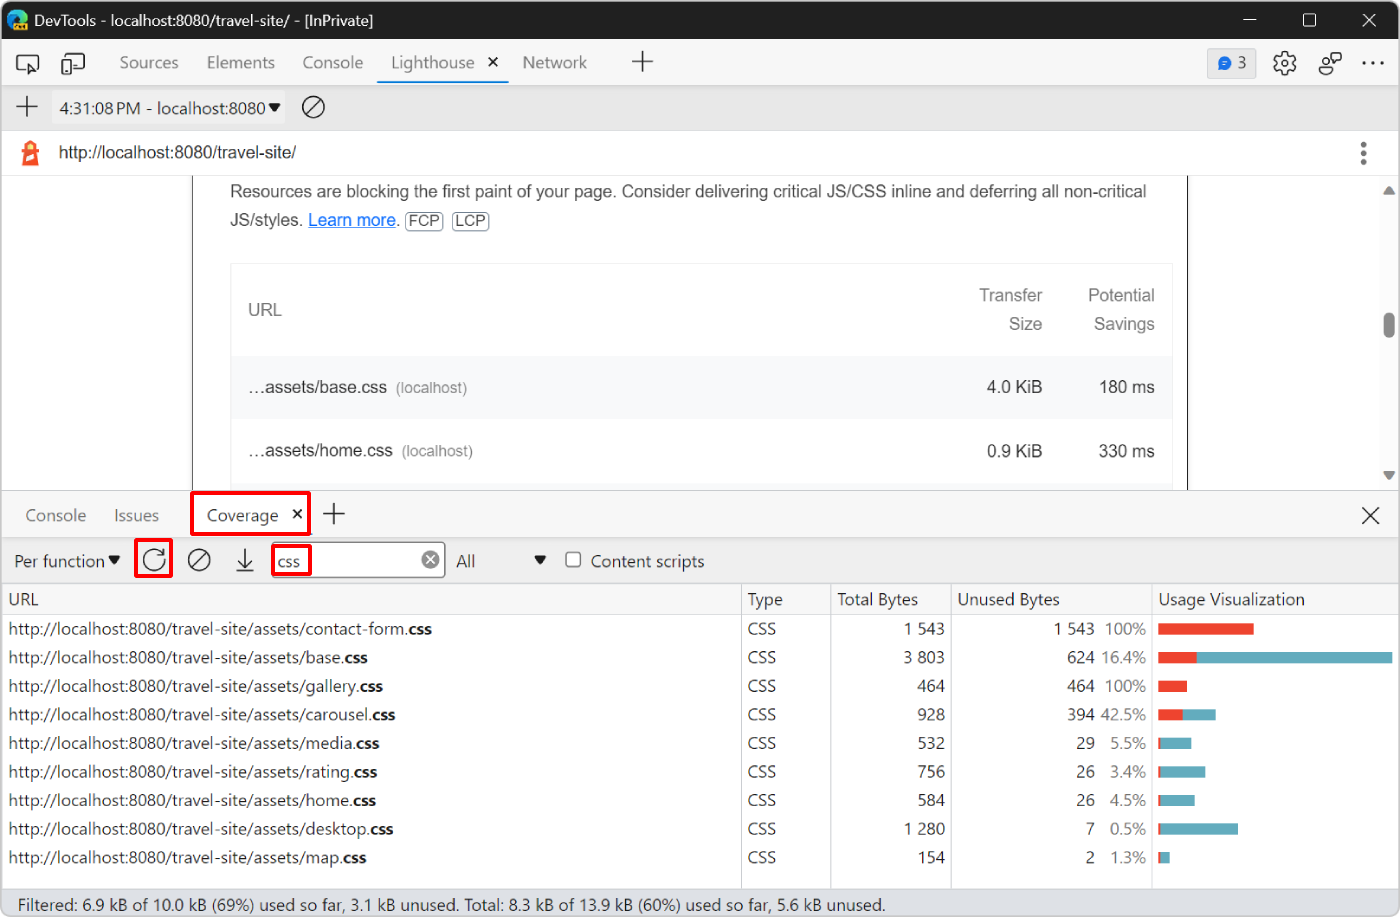
The report shows that the
contact-form.cssandgallery.cssfiles aren't used at all. They both have 100% unused bytes.Click the
contact-form.cssfile in the report. DevTools opens the file in the Sources tool. If a line of code ran, a blue bar appears next to it. A red bar means the line of code didn't run, and is definitely not needed on load of the webpage.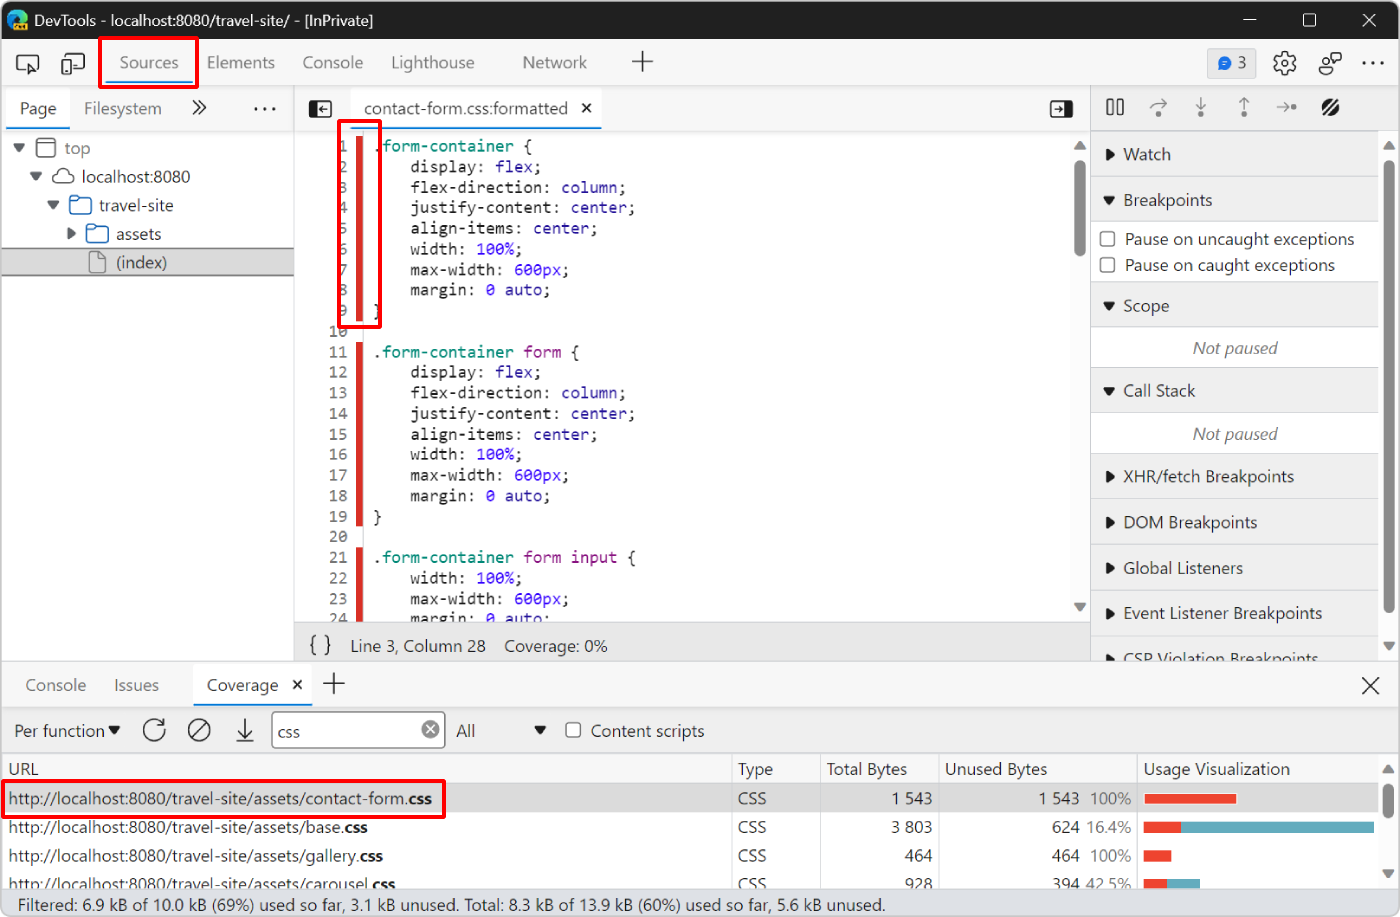
Only red bars are displayed in this source file, which means that the webpage doesn't need this file at all.
Now, remove the references to these files from the code:
In Visual Studio Code, open the
/travel-site/index.htmlfile.Near the top of the file, find the list of
<link>tags that load the stylesheets on the page.Delete the two lines of code that load the
contact-form.cssandgallery.cssfiles: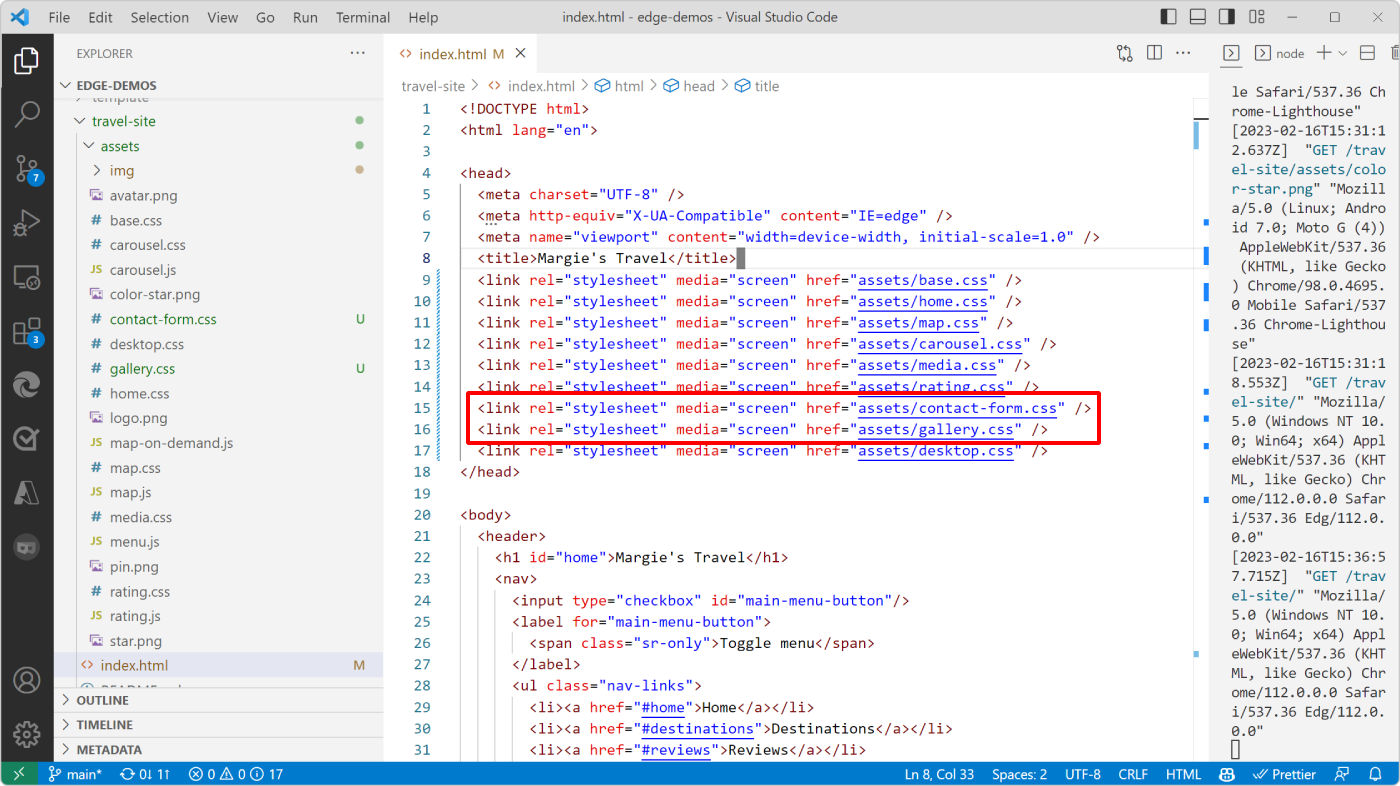
Save your changes in Visual Studio Code, then refresh the webpage in Microsoft Edge, and run a new audit in the Lighthouse tool again to see how your changes affect the load performance.
Automatically remove non-critical CSS
In the previous step, your score improved slightly, but Lighthouse still flags other CSS files as blocking the initial render of the page.
The webpage uses the remaining CSS files so you can't remove them. However, it's possible to split them in two groups:
Critical CSS code that needs to block the rendering of the webpage because it visually impacts the style and layout of the part of the webpage that users see when it loads.
For example, the title on the webpage uses the
header h1CSS rule in the/travel-site/assets/base.cssfile.Non-critical CSS code that's used to render parts of the page that aren't visible when the page loads.
For example, the
/travel-site/assets/desktop.cssfile is only needed when the viewport is larger than665px.
To automatically split your CSS code this way, you can use the Critical tool. To learn more, see the Critical project repo.
You can then load your non-critical CSS code in a way that doesn't block the initial render of the page.
It's also good to minify your CSS code and remove unneeded whitespace characters and comments. See Minify CSS at developer.chrome.com.
See also:
- CSS performance optimization at MDN.
Reduce layout shift by setting explicit width and height on images
In your Lighthouse report, the Diagnostics section suggests defining explicit width and height for image elements. Click on Image elements do not have explicit width and height to display more information:
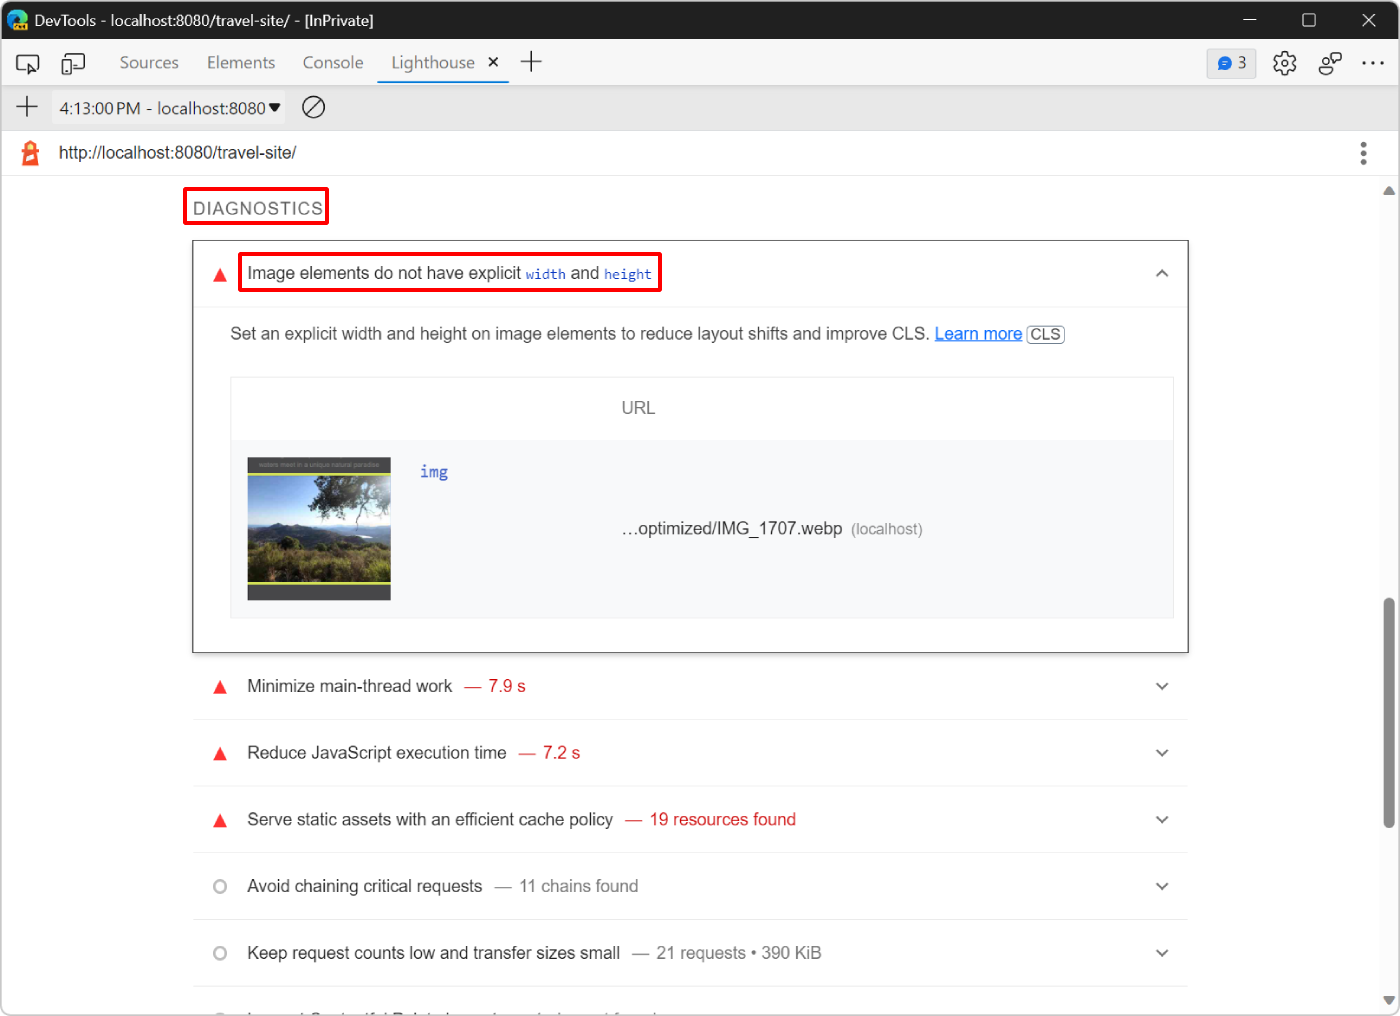
The report says that the image at the top of the webpage doesn't have explicit width and height attributes, which can cause layout shifts.
Layout shifts occur when portions of a webpage initially appear in one place but then move to another position during the load of the page. For example, when an image loads, the browser doesn't know how much space to reserve for it until the image is fully loaded.
To prevent layout shifts caused by loading images on a webpage, do either of the following:
- Define each image's
widthandheightattributes in the HTML code. - Reserve the space in CSS by using the
aspect-ratioCSS property.
See also:
- Rendering strategy: preventing jank when loading images in Multimedia: Images at MDN.
: The Image Embed element at MDN.
In the following steps, you use the aspect-ratio CSS property to avoid layout shifts:
In Visual Studio Code, open the
/travel-site/assets/home.cssfile, and then search for the CSS rule that has the.hero-image imgselector.Modify the CSS rule so it looks like this:
.hero-image img {
  width: calc(100% + 2 * var(--main-margin));
  position: relative;
  left: calc(-1 * var(--main-margin));
  aspect-ratio: 1.5;
  object-fit: cover;
}
Before this change, the CSS rule already contained a
widthproperty, so the browser knew how much horizontal space to reserve for the image. By adding theaspect-ratioproperty, you also tell the browser how much vertical space to reserve. By adding theobject-fitproperty, you avoid distorting the image if its CSS dimensions don't match the actual image file's dimensions.Open the
/travel-site/assets/desktop.cssfile, and then search for the CSS rule that has the same.hero-image imgselector.The
desktop.cssfile is used only when the viewport is larger than665px, for when the webpage is displayed on a large screen, for example when used on a laptop computer.Modify the CSS rule so it looks like this:
.hero-image img {
    width: 100%;
    position: static;
    aspect-ratio: 2.5;
    object-fit: cover;
}
This time, the CSS rule already had a
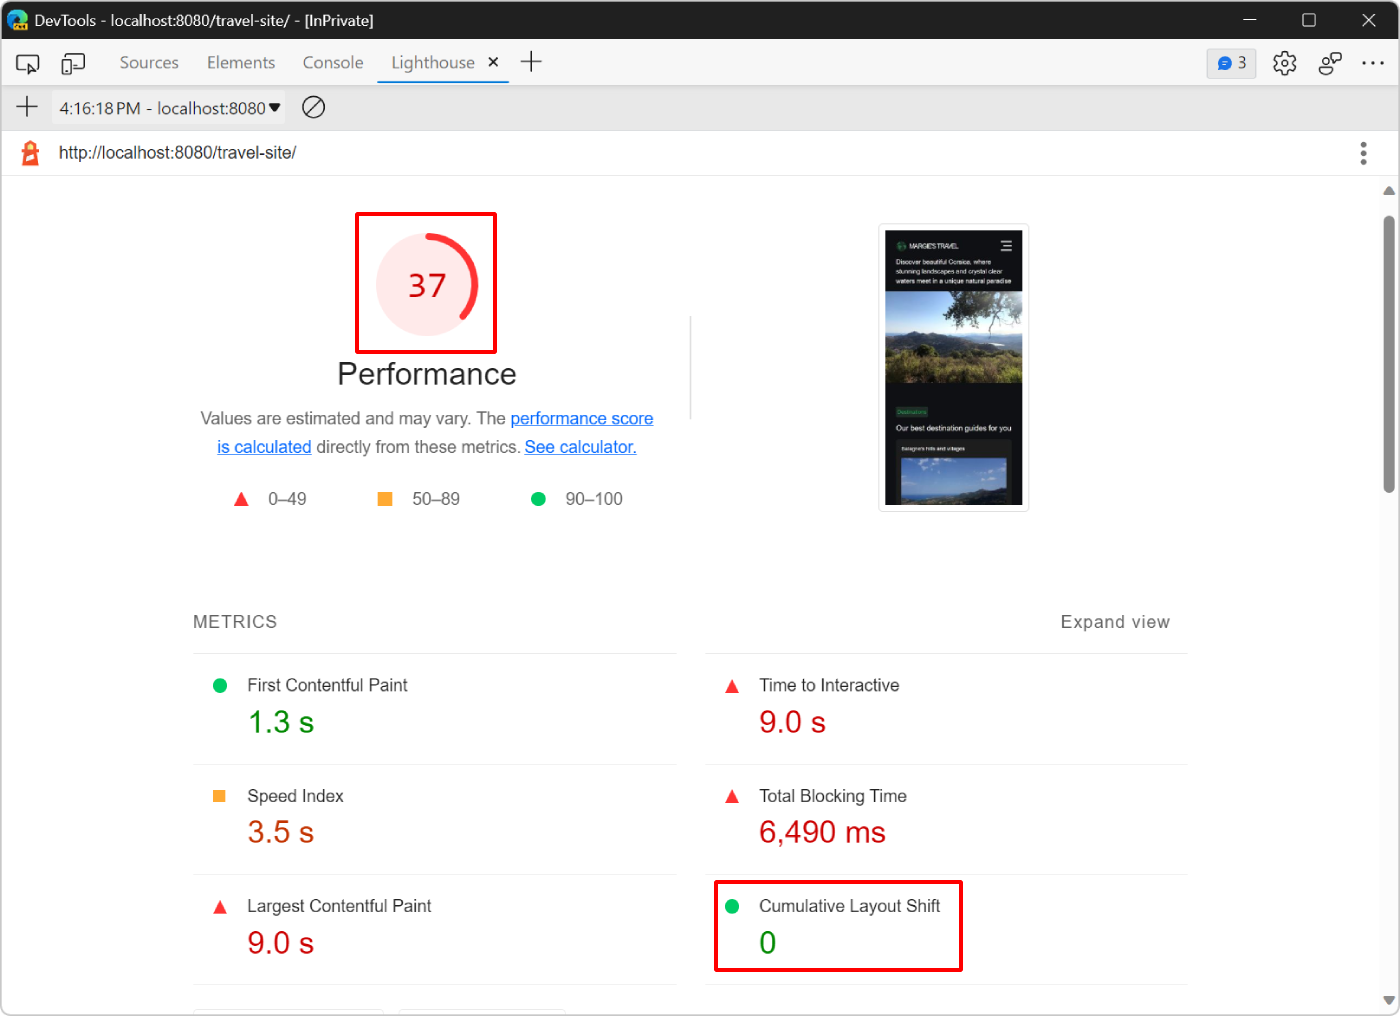
widthandobject-fitdefined. But instead of defining amax-heightfor the image, you use theaspect-ratioproperty to make sure the browser knows exactly how much space to reserve for the image on desktop devices.Save your changes in Visual Studio Code, then refresh the webpage in Microsoft Edge, and run a new audit in the Lighthouse tool to see how your changes affect the load performance:
Your score is now up to 37, but more importantly the Cumulative Layout Shift score is down to 0, indicating that there are no more shifts in the layout as the page loads.
Do less work in the main thread
Your latest report shows high Time to Interactive and Total Blocking Time metric values, which means that there's still something on the webpage that takes a long time to run and prevents the page from being usable for several seconds.
Scroll down to the Diagnostics section which says to Minimize main-thread work and Reduce JavaScript execution time. The main thread is where the browser does most of the work that's needed to display a page, such as:
- Parsing and running HTML.
- Parsing and applying CSS to DOM elements.
- Running JavaScript.
In this case, it looks like the biggest bottleneck is that the page runs too much JavaScript code on page load.
Use the Performance tool to analyze what work the main thread is doing while the page loads, and find ways to defer or remove unnecessary work:
Open the Performance tool.
In the Performance tool, click Start profiling and reload the page (
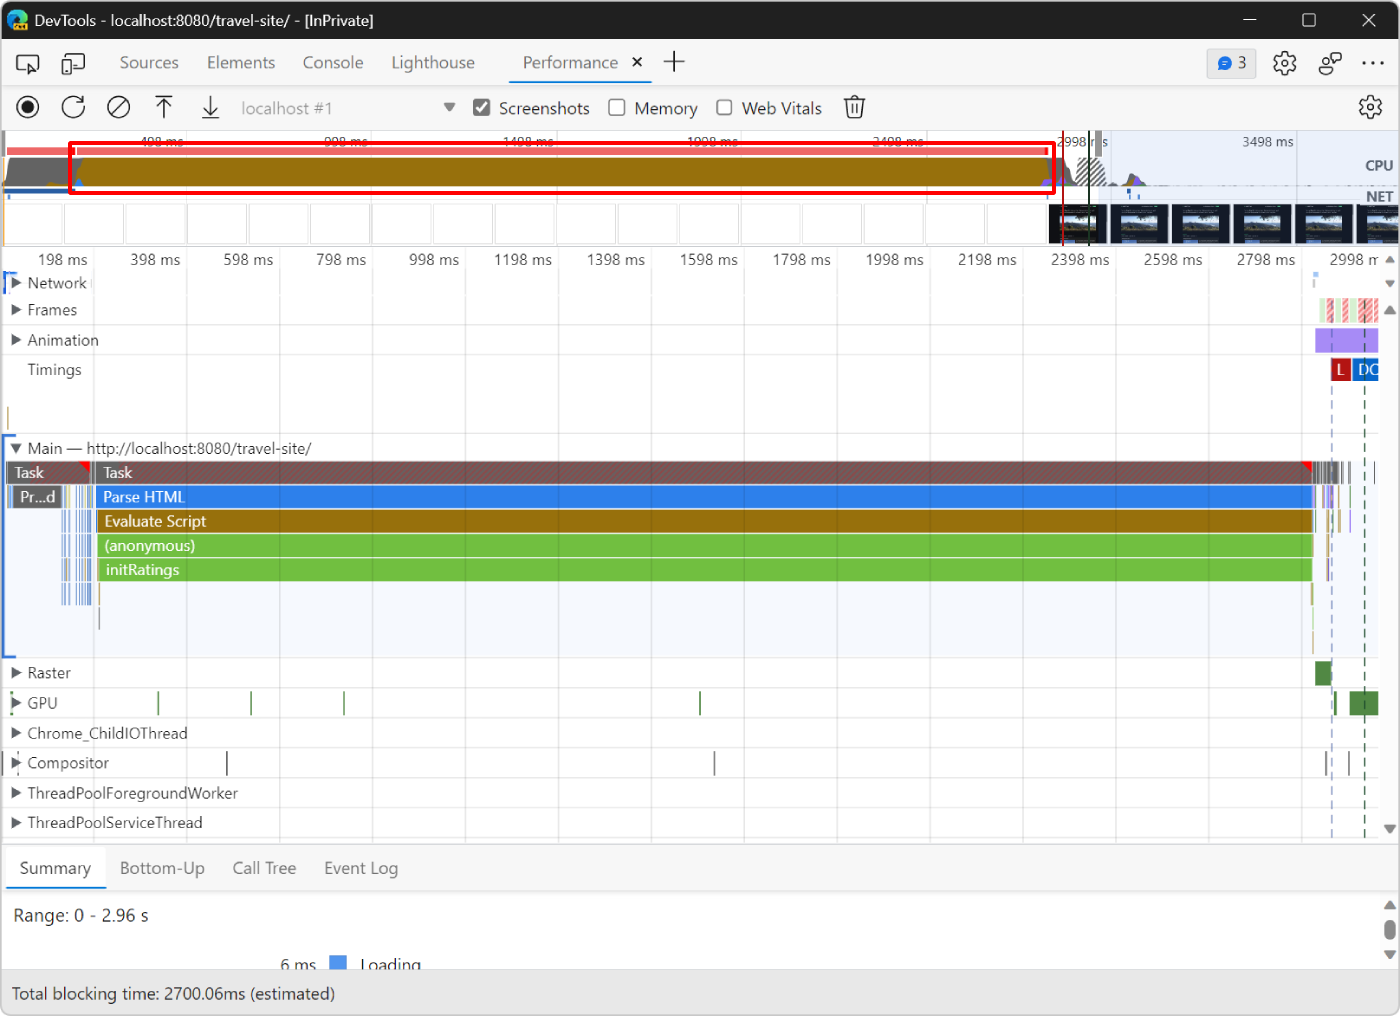
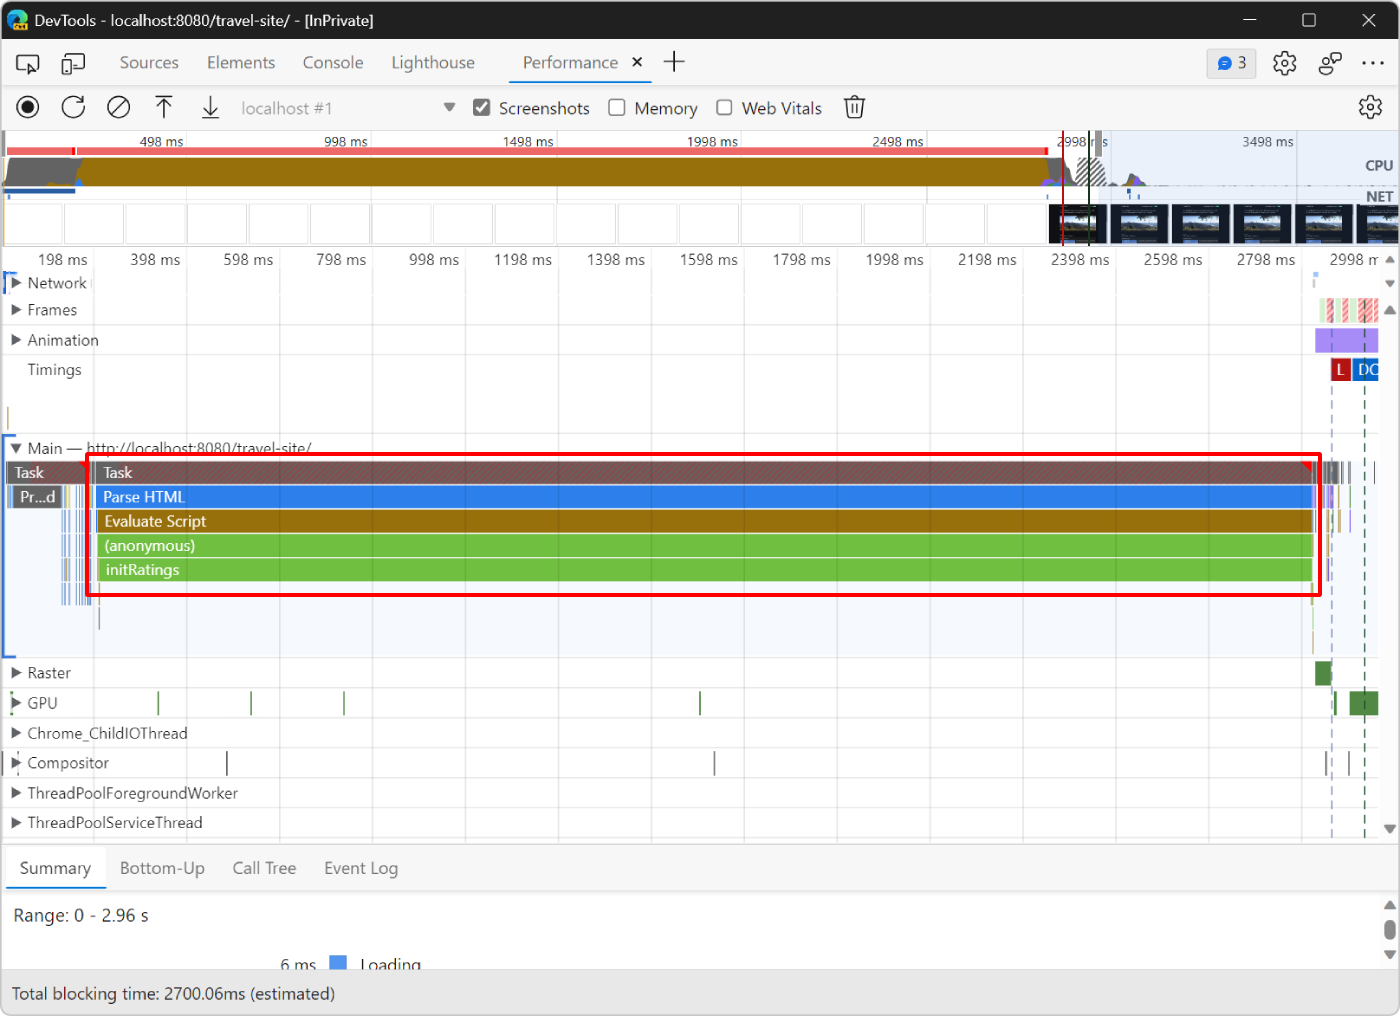
), and then click Stop once the page has fully loaded.DevTools displays a visualization of all the work that the browser performed in order to load the page. This visualization is referred to as the trace:

The trace shows activity chronologically, from left to right. The CPU and NET charts at the top give you an overview of CPU and network activity. The light brown area in the CPU chart corresponds to a period of time when the browser was busy with scripting activity. This area is a clue that you may be able to speed up page load by doing less JavaScript work.
Investigate the trace to find ways to do less JavaScript work.
The Main section shows a chronological log of main thread activity, from left to right. The y-axis (top to bottom) shows why events occurred.
For example, in the following figure, the browser spends most of the time in a Parse HTML event. As long as this event runs, the webpage isn't entirely displayed. This event caused a long Evaluate Script event, which corresponds to when the browser executes JavaScript code. The Evaluate Script event caused an (anonymous) function to run, which caused the initRatings function to run:
Optimize the initRatings function to make the page load faster:
In Visual Studio Code, open the
/travel-site/assets/rating.jsfile and read through the code.The code in this file is responsible for displaying five customer reviews on the webpage. Each review has a rating consisting of several stars, a quote, and an author. These reviews come from a server-side API used in the
getRatingsfunction. TheinitRatingsfunction creates DOM elements in the page for each review.In the
initRatingsfunction, find a way to make the JavaScript code faster.This webpage is just a demo, and a
forloop was introduced to slow down the code. In practice, there are many ways for a JavaScript file like this one to cause slow page loads, such as:- Accessing the DOM too frequently.
- Running heavy computation tasks.
- Using large JavaScript libraries or frameworks.
Delete the
forloop at the beginning of theinitRatingsfunction, save your changes, and reload the page in Microsoft Edge.Run a new audit in the Lighthouse tool to see how your changes affect the load performance:
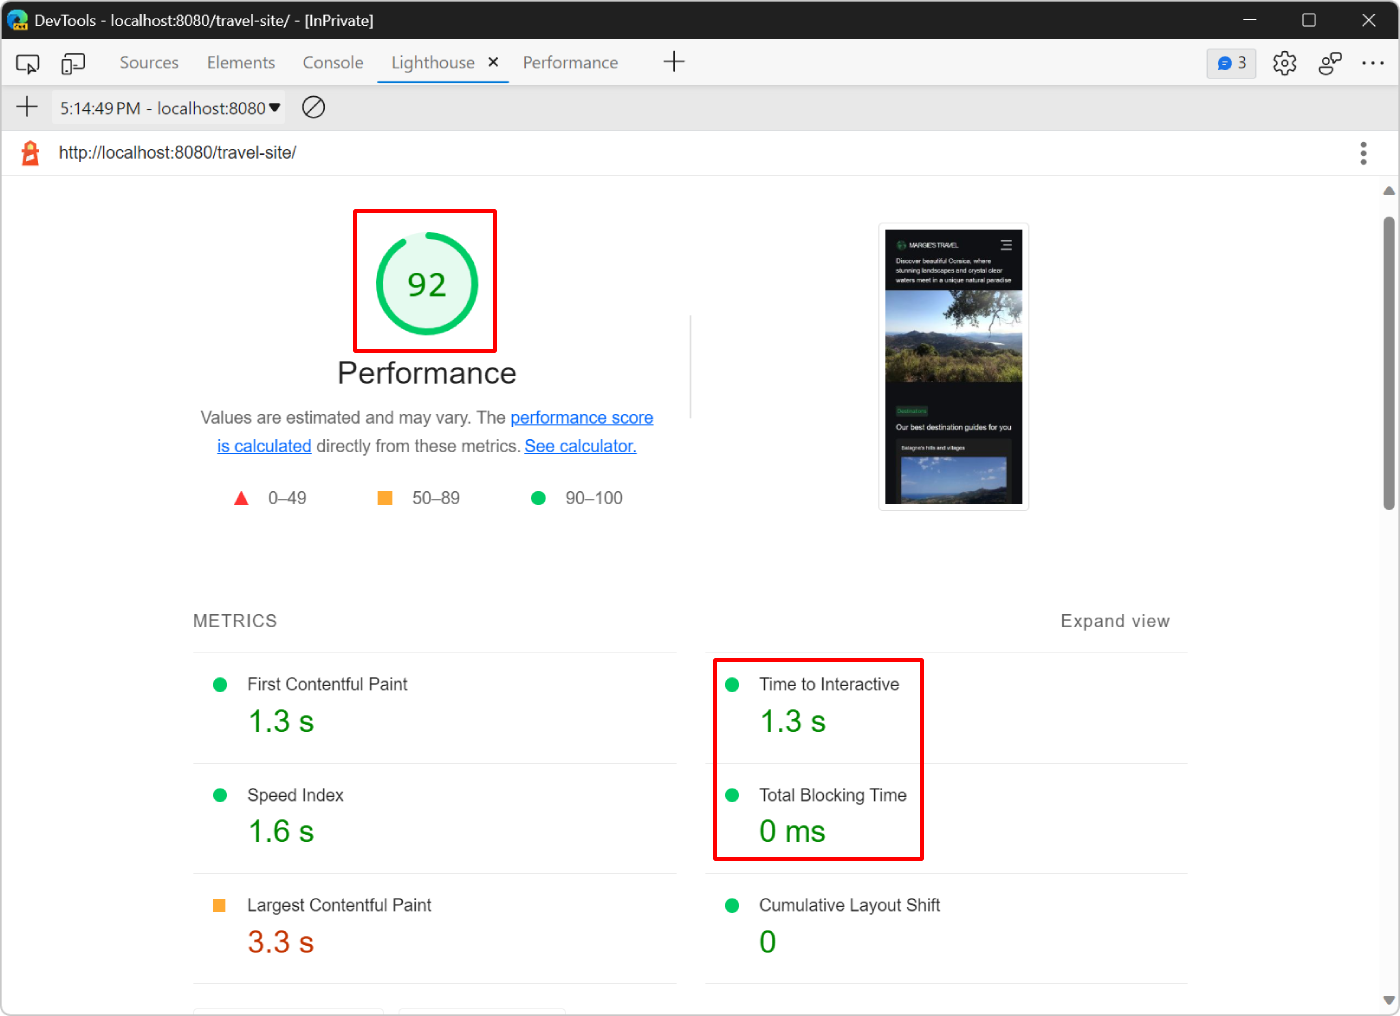
- Your score went up to 92.
- The Time to interactive metric went down to 1.3 seconds.
- The Total Blocking Time metric went down to 0 seconds.
To learn more about how to analyze page performance, see Performance features reference).
Doing less work in the main thread, in the real world
The Performance tool is the most common way to understand what activity your webpage does as it loads, and to find ways to remove unnecessary activity.
If you prefer an approach that feels more like console.log(), the User Timing API enables you to arbitrarily mark up certain phases of your app lifecycle, in order to track how long each of those phases takes.
Webpages often load slowly when they use JavaScript for generating most of their user interfaces. To improve your webpage's performance, consider moving the code that creates your webpage's user interface to the server side, and delivering that code to the browser as HTML and CSS.
Summary
Whenever you set out to optimize the load performance of a site, always start with an audit. The audit establishes a baseline, and gives you tips on how to improve.
Make one change at a time, and audit the webpage after each change in order to display how that isolated change affects performance.
Note
Portions of this page are modifications based on work created and shared by Google and used according to terms described in the Creative Commons Attribution 4.0 International License. The original page is found here and is authored by Kayce Basques.
![]() This work is licensed under a Creative Commons Attribution 4.0 International License.
This work is licensed under a Creative Commons Attribution 4.0 International License.