Note
Access to this page requires authorization. You can try signing in or changing directories.
Access to this page requires authorization. You can try changing directories.
These are the latest features in the Stable release of Microsoft Edge DevTools.
Video: Microsoft Edge | What's New in DevTools 94

Search for Console errors on the web
Search the web for your Console errors, from within DevTools. In the Console, many errors now have a Search for this message on the Web button, shown as a magnifying glass. When you select the Search for this message on the Web button, a new tab opens in the browser and shows search results for the error:
![]()
See Search the web for a Console error message string.
DevTools extension for Visual Studio Code includes the latest tools, theme support, and helpful links
In the latest version of the Microsoft Edge DevTools extension for Visual Studio Code, we released the following updates or new features:
- Shares the same codebase that's used for the browser-based DevTools.
- Supports themes that ship with Visual Studio Code.
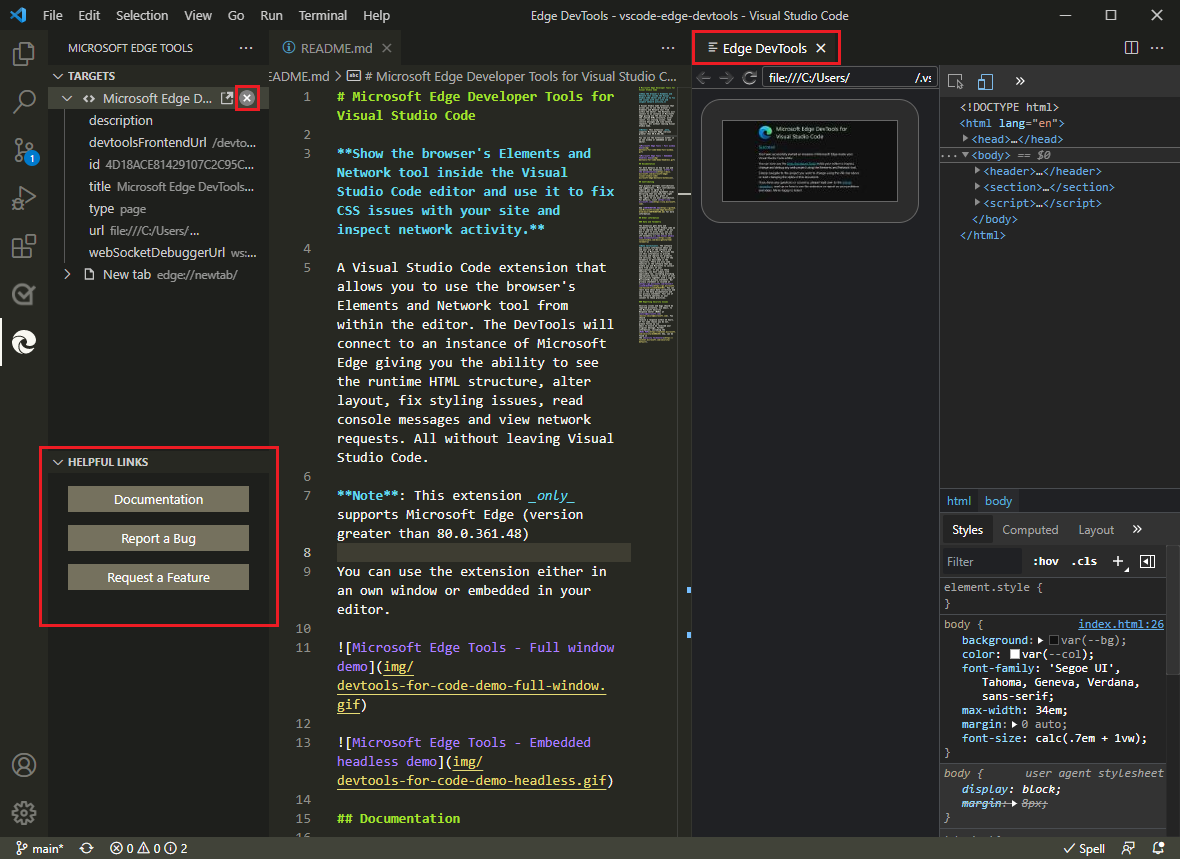
- Adds a Helpful Links section in the Microsoft Edge Tools sidebar, with buttons for Documentation, Report a Bug, and Request a Feature.
- Adds a Close instance (
X) button in the Microsoft Edge Tools > Targets pane, to close the browser that was opened by the extension. - Adds support for JavaScript Debugger connections to remote workspaces.
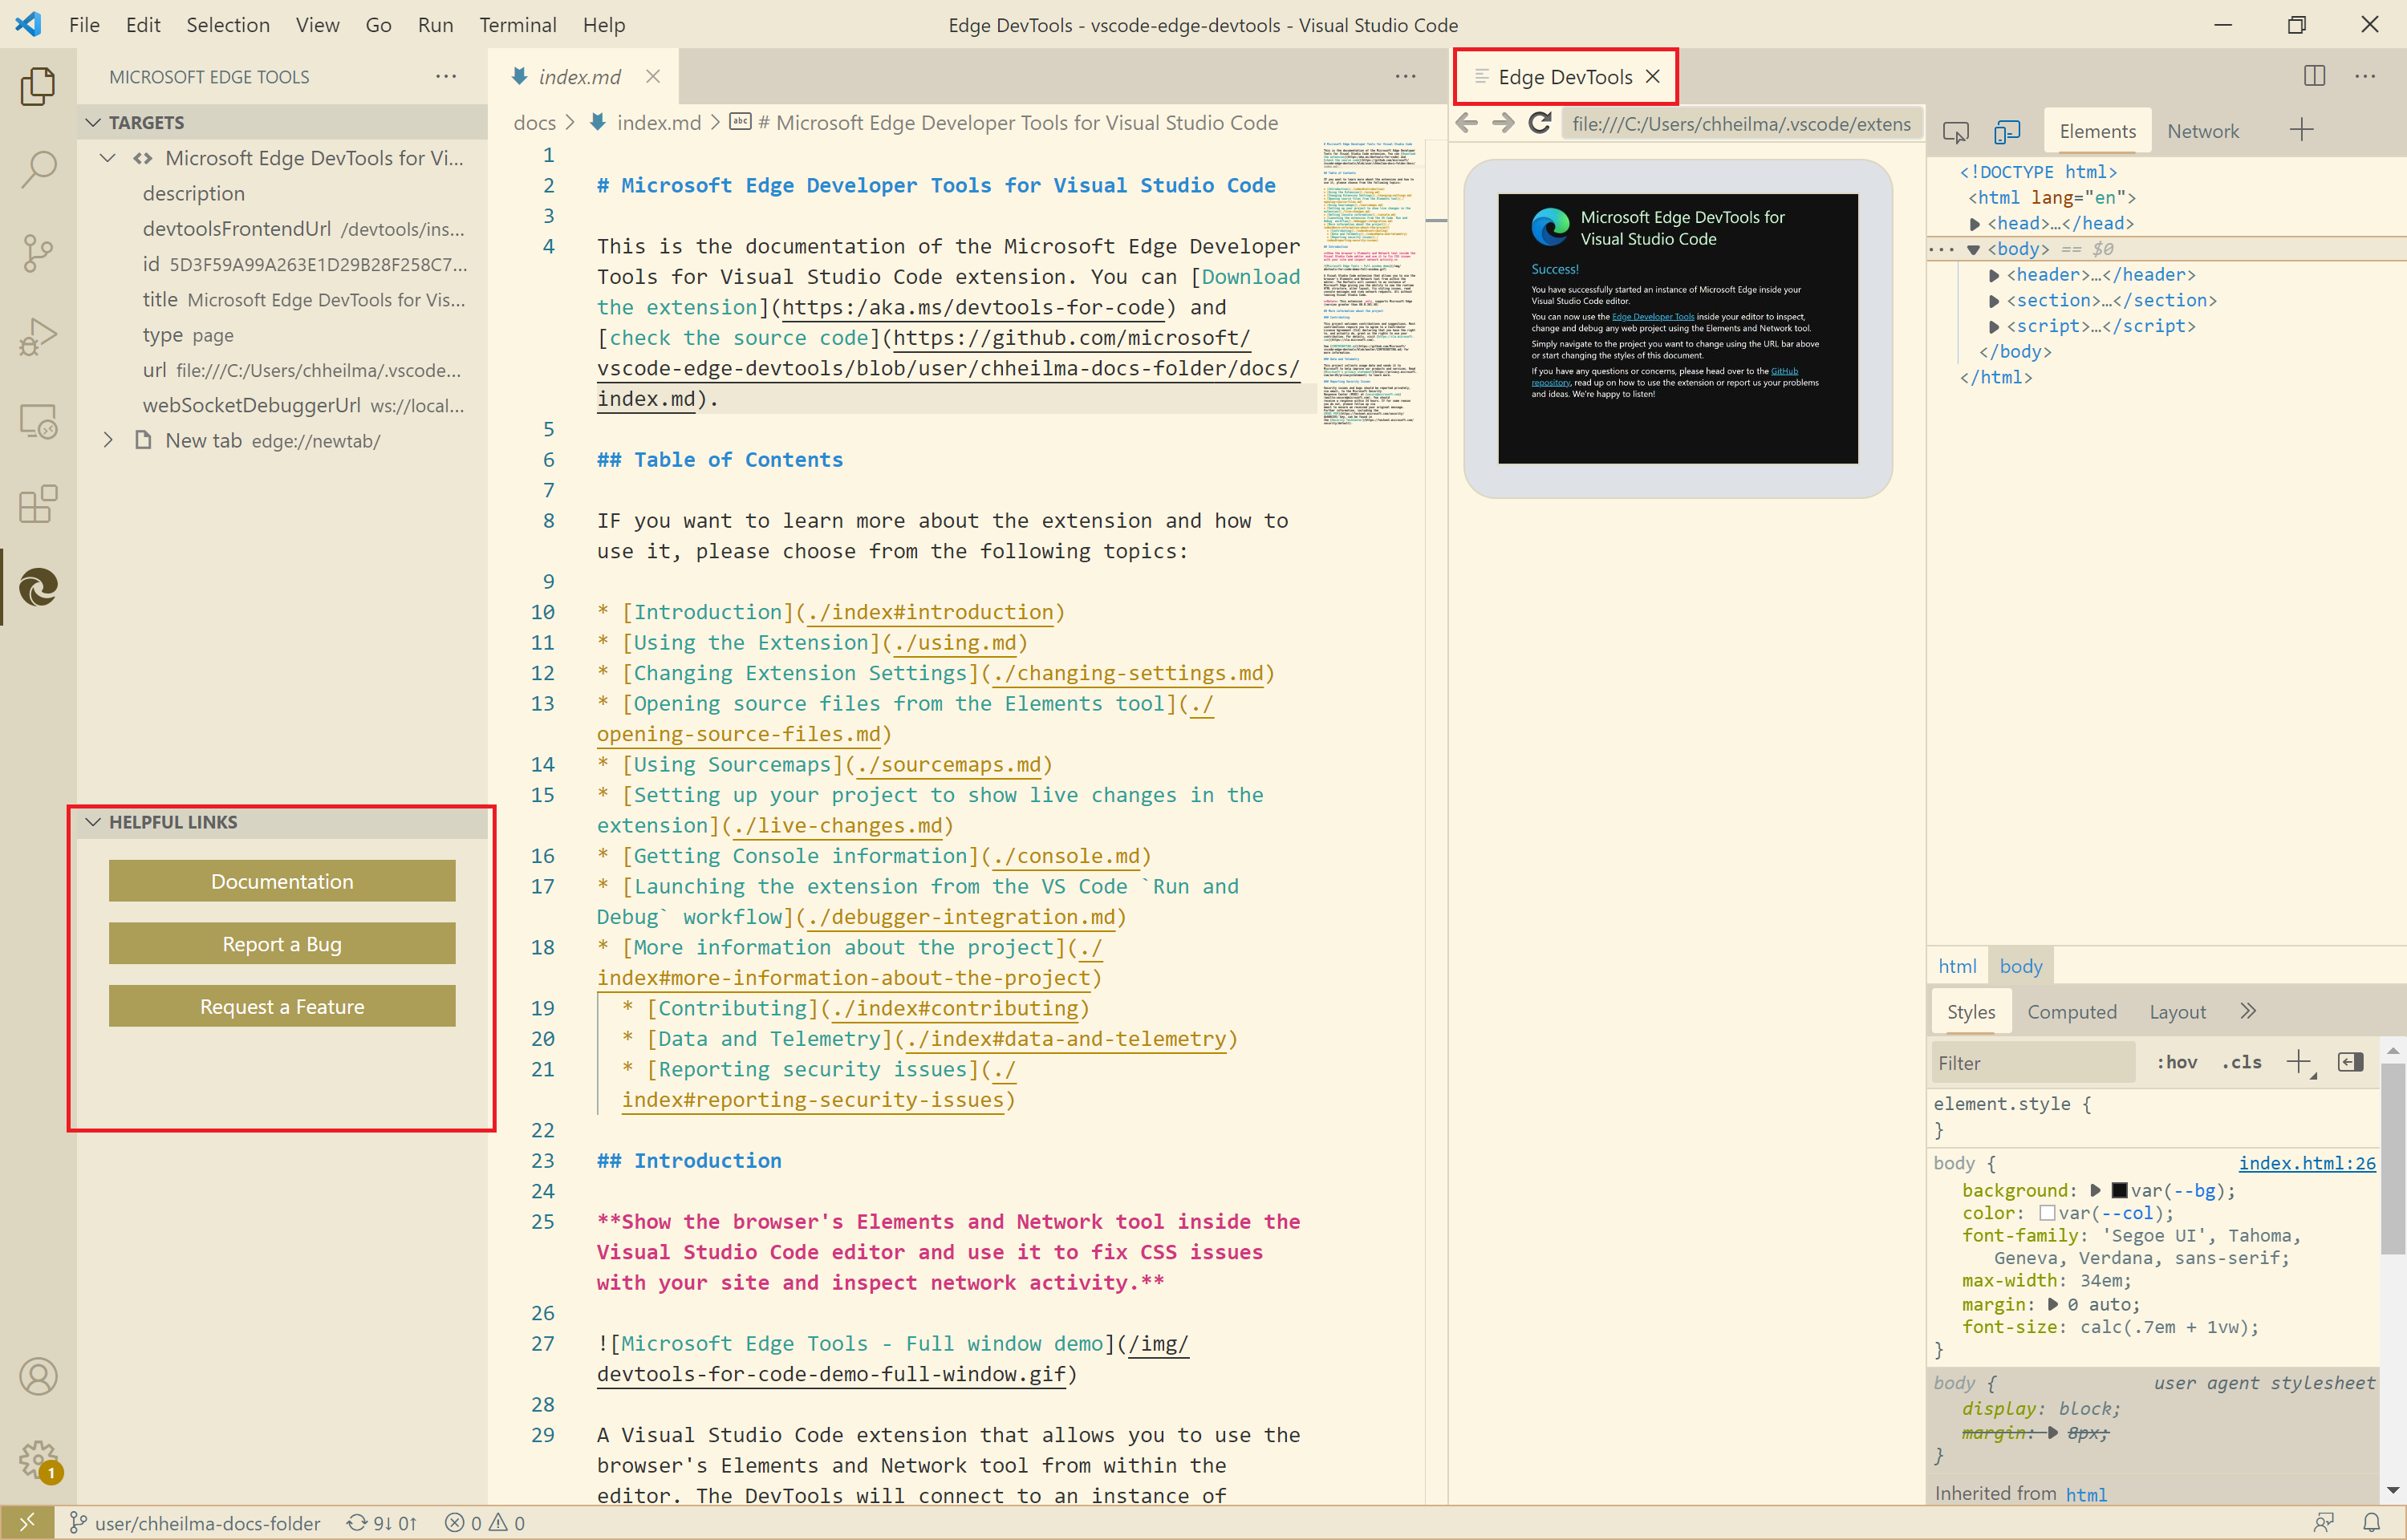
The extension running inside Visual Studio Code, matching the dark theme of Visual Studio Code, and a new Helpful Links sidebar:
Light themes from Visual Studio Code are also supported:
See also:
Breakpoint icons are now displayed when using Visual Studio Code themes
Update: Starting with Microsoft Edge 131, the Visual Studio Code themes feature is removed, and such themes revert to the default themes:
- Light+
- Dark+
In Microsoft Edge version 93, you can apply themes used in Visual Studio Code to the DevTools extension.
Previously, when using a theme from Visual Studio Code in DevTools, breakpoint icons on the left margin of the code in the Sources tool weren't displayed. Starting in Microsoft Edge 94, breakpoint icons are now displayed as expected:
![]()
See also:
Navigate to the More Tools button with the keyboard
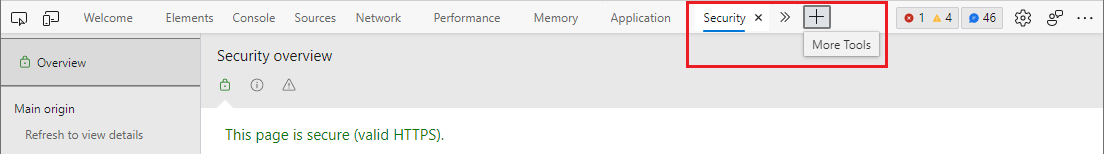
Previously, you couldn't navigate to the More Tools (+) button in DevTools using the arrow keys on the keyboard when the toolbar had focus. When using the arrow keys, after reaching the last tool in the toolbar, the focus looped back to the first tool, or the More tabs menu was displayed.
Starting with Microsoft Edge version 93, the More tabs (>>) button and the More Tools button can be selected by using the arrow keys, when focus is on the toolbar:
See also:
Note
Portions of this page are modifications based on work created and shared by Google and used according to terms described in the Creative Commons Attribution 4.0 International License. The original page is found here and is authored by Jecelyn Yeen.
![]() This work is licensed under a Creative Commons Attribution 4.0 International License.
This work is licensed under a Creative Commons Attribution 4.0 International License.