Note
Access to this page requires authorization. You can try signing in or changing directories.
Access to this page requires authorization. You can try changing directories.
These are the latest features in the Stable release of Microsoft Edge DevTools.
Video: What's new in DevTools 112
Performance tool unminifies JavaScript running in out-of-process iframes
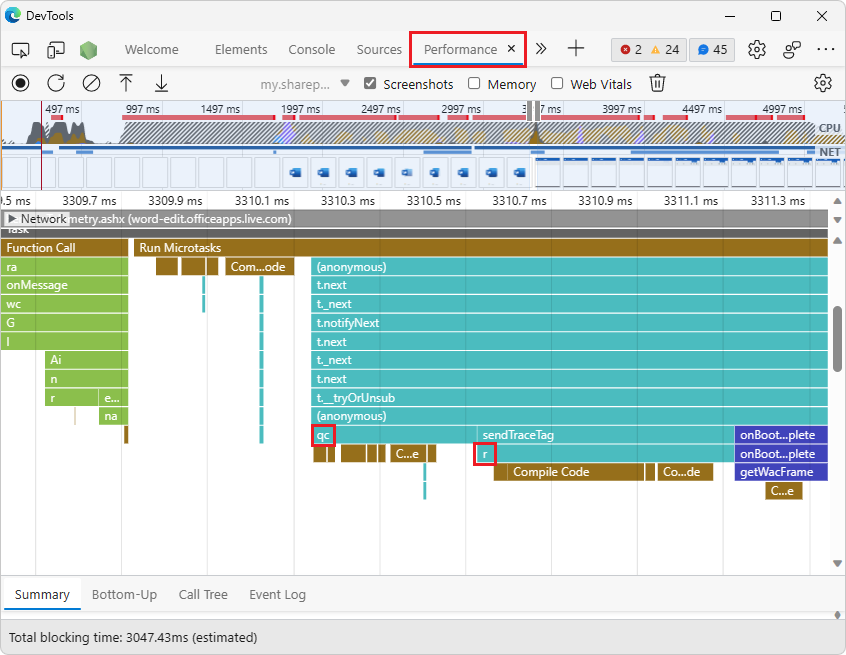
In previous versions of Microsoft Edge, JavaScript execution in an out-of-process iframe (OOPIF) was isolated from DevTools. As a result, the Performance tool was not able to apply sourcemaps to performance events that are from an OOPIF. When recording a profile in the Performance tool, the tool can only display the minified file and function names in the flame chart, not the unminified names:
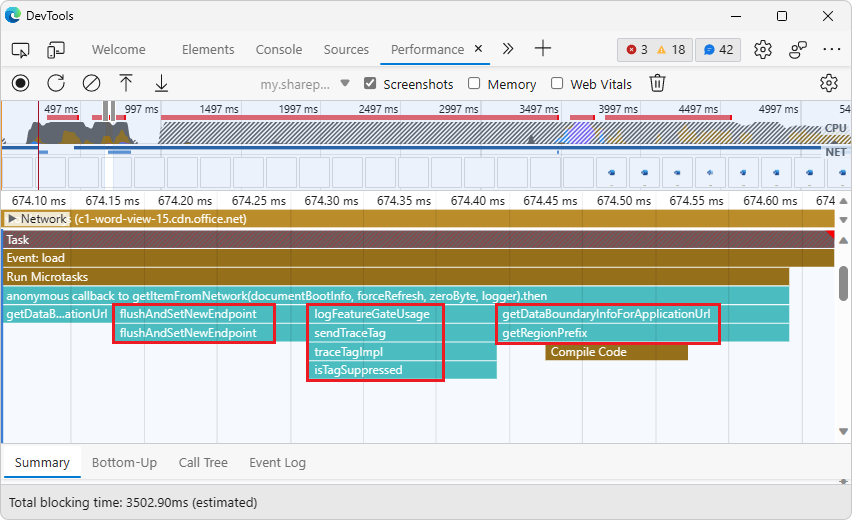
In Microsoft Edge 112, the Performance tool now loads sourcemaps and applies them to the performance events that are tracked in OOPIFs. As a result, after recording a profile in the Performance tool, you can now see unminified file and function names for the JavaScript execution that occurs within an OOPIF:
See also:
- Performance tool unminifies file and function names when profiling production code in What's New in DevTools (Microsoft Edge 111).
- Securely debug original code by publishing source maps to the Azure Artifacts symbol server
- Securely debug original code by using Azure Artifacts symbol server source maps
- Record performance in Performance features reference.
CSS overview tool displays non-simple selectors for quick performance gains
The CSS overview tool has a new Non-simple selectors section, which displays a list of non-simple CSS selectors when you take an overview snapshot of your webpage's CSS. This list of non-simple CSS selectors in the CSS overview tool provides a quick way to identify common culprits that might be causing long-running Recalculate Styles events:
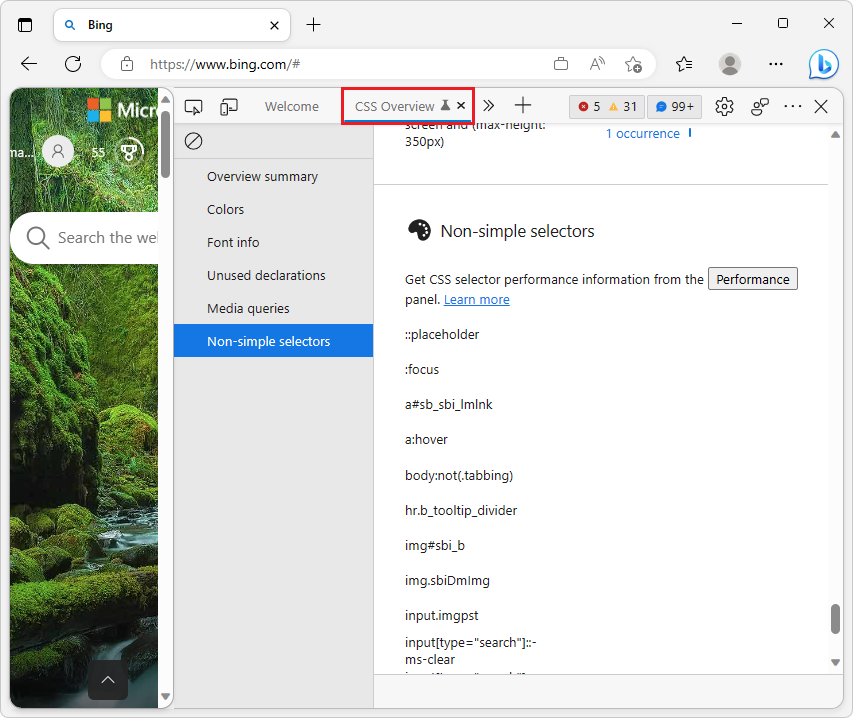
This is a list of selectors that could possibly reduce performance. To determine whether these selectors are actually reducing performance, use the Selector Stats feature in the Performance tool.
You can try to change these selectors so that they are more specific and match fewer elements, reducing the amount of time the browser takes to calculate styles in the following cases:
- When elements are added to or removed from the DOM.
- When an element's attributes are changed, such as
classorid. - When user input occurs, such as a mouse move or a change of focus, which can affect
:hoverrules.
To analyze individual CSS selector performance and analyze the impact of your changes, use the Selector Stats feature in the Performance tool.
See also:
- Optimize CSS styles with the CSS overview tool
- Analyze CSS selector performance during Recalculate Style events
The JSON Viewer in Microsoft Edge supports code folding
Starting with Microsoft Edge 110, you have access to an experimental feature for viewing JSON directly in the browser: the JSON Viewer. Previously, you may have used browser extensions or text editors for viewing JSON, but now you can inspect JSON payloads directly in Microsoft Edge, whether the JSON is from the network or from disk.
Starting in Microsoft Edge 112, the JSON Viewer now supports code folding. The JSON Viewer is an experimental feature. To turn on the JSON Viewer and access code folding:
Go to
edge://flags.In the Search flags text field, start typing JSON Viewer.
In the JSON Viewer dropdown menu, select Enabled. A Restart button appears in the lower right.
Click the Restart button.
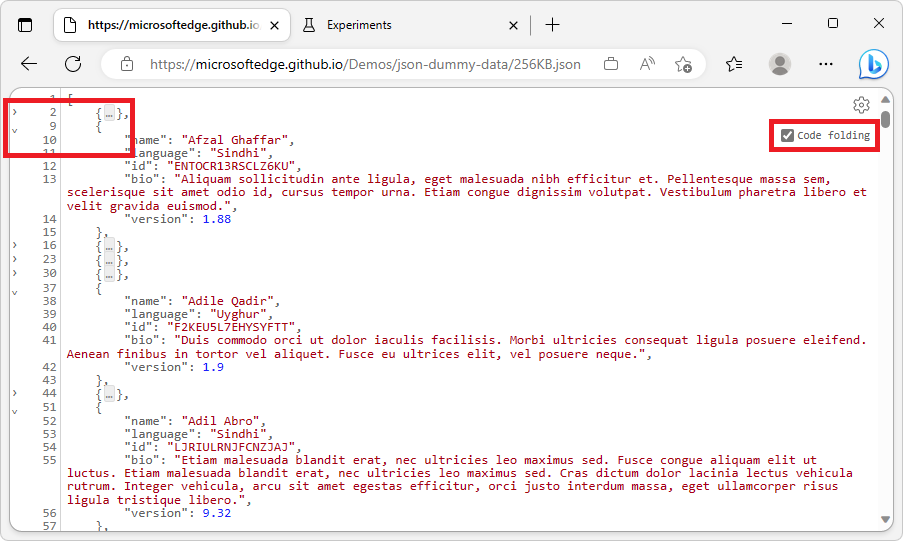
Go to a JSON file, such as https://microsoftedge.github.io/Demos/json-dummy-data/256KB.json. Line numbers appear on the left.
Click the gear (
 ) icon in the top right corner, and then select the Code folding checkbox.
With code folding turned on, you can now expand and collapse objects and arrays within the JSON you're inspecting:
Please send us your feedback!
See also:
Focus Mode improvements
Focus Mode is a new, experimental user interface for DevTools. Focus Mode simplifies and streamlines the DevTools UI, providing maximum customizability without compromising on the robust set of features in the tools. In Microsoft Edge 112, Focus Mode received the following improvements:
Pressing Esc shows or entirely hides Quick View
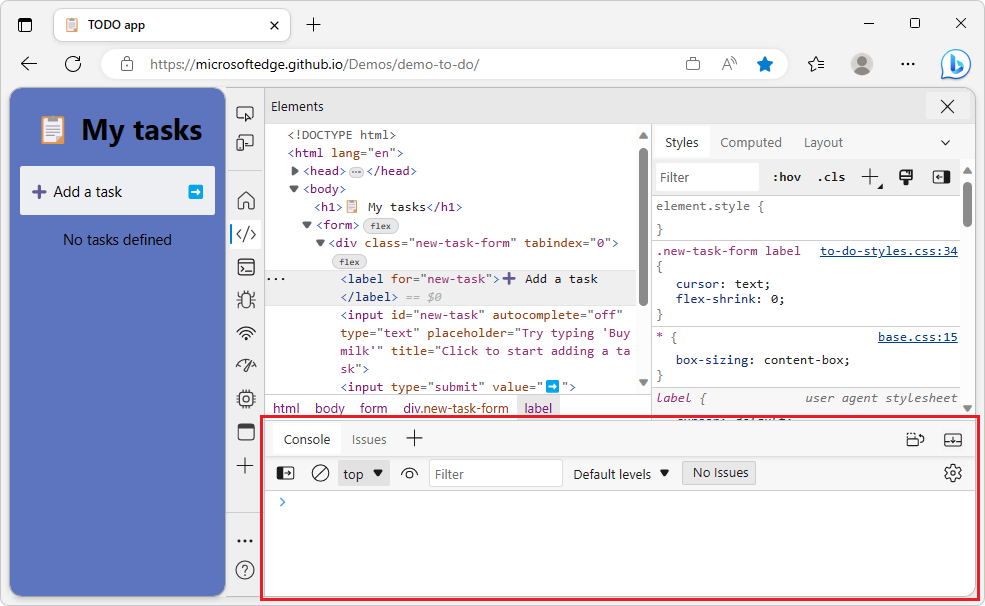
In previous versions of Microsoft Edge, in Focus Mode, the Quick View panel was always displayed, as either collapsed or expanded. Pressing Esc expanded the Quick View panel if it was collapsed, and vice versa. However, when the Console tool was selected in the Activity Bar, pressing Esc when the Quick View panel was collapsed displayed a blank view. In Microsoft Edge 112, this issue has been fixed.
Pressing Esc now shows or entirely hides the Quick View panel. If the Quick View panel is currently hidden, pressing Esc shows the Quick View panel, expanded:
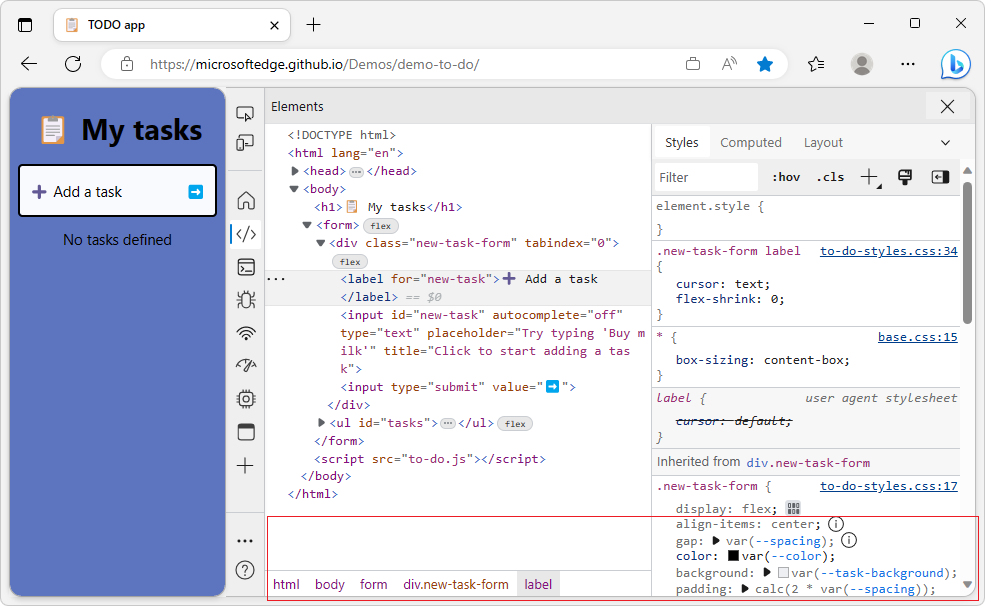
If the Quick View toolbar is currently displayed (whether the Quick View panel is collapsed or expanded), pressing Esc entirely hides the Quick View toolbar and panel:
The Node icon for dedicated DevTools no longer overlaps the first icon in the Activity Bar
In Focus Mode, when DevTools detects that a Node.js server is running, the Node icon is displayed. Clicking this icon opens the dedicated DevTools for Node.
Before Microsoft Edge 112, the Node icon overlaps the first tool icon when the Activity Bar is in vertical orientation, making it harder to select the first tool. This issue has now been fixed; there's no overlapping of the Node icon and the first tool icon when the Activity Bar is vertical:
![]()
With the vertical Activity Bar, only one label is shown for each tool icon when hovering
In Focus Mode, when the Activity Bar is in the vertical orientation, a tool name label is displayed when you hover over an icon or select an icon with the keyboard. These labels help you learn the icon for each tool in the Activity Bar.
Previously, selecting an icon with the keyboard or hovering over an icon with the mouse displayed two labels simultaneously. This issue has now been fixed; only one label is displayed:
Announcements from the Chromium project
Microsoft Edge 112 also includes the following updates from the Chromium project:
- Elements > Styles updates
- Marking logpoints and conditional breakpoints in the Console
- Ignore irrelevant scripts during debugging
- JavaScript Profiler deprecation started
- Emulate reduced contrast
- Lighthouse 10