What's New in DevTools (Microsoft Edge 115)
To check out the latest features of Microsoft Edge DevTools and the Microsoft Edge DevTools extension for Microsoft Visual Studio Code and Visual Studio, read these announcements.
To stay up to date and get the latest DevTools features, download an Insiders preview version of Microsoft Edge. Whether you're on Windows, Linux, or macOS, consider using Canary (or another preview channel) as your default development browser. The Beta, Dev, and Canary versions of Microsoft Edge run as separate apps, side-by-side with the stable, released version of Microsoft Edge. See Microsoft Edge Insider Channels.
For the latest announcements, follow the Microsoft Edge team on Twitter. To report a problem with DevTools or ask for a new feature, file an issue in the MicrosoftEdge/DevTools repo.
Improvements for connecting DevTools to Azure Artifacts symbol server
In Microsoft Edge 115, it's easier and more customizable to connect DevTools to Azure Artifacts symbol server. In previous versions of Microsoft Edge, to authenticate to the symbol server, you had to generate Personal Access Tokens (PATs) in Azure DevOps and then paste them into DevTools. Now, as long as you're logged into Microsoft Edge using a work account, you can connect to the symbol server by using Microsoft Entra ID.
Additionally, you can now connect to multiple symbol servers, in case you need to fetch sourcemaps from different Azure DevOps organizations. You can also filter which sourcemaps you want DevTools to fetch from the symbol server, by specifying the sourcemap URLs in an inclusion or exclusion list.
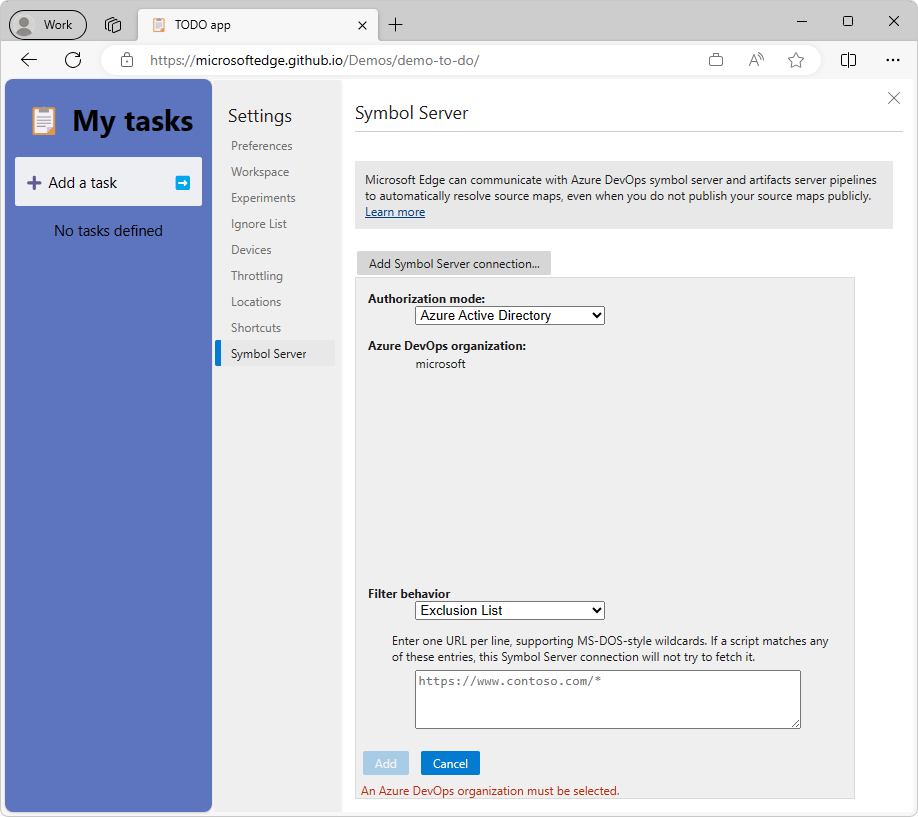
The message An Azure DevOps organization must be selected means double-click the organization, or click it and then press Enter.
Wildcards
In the Filter behavior text box, the following wildcards are supported:
| Wildcard | Meaning |
|---|---|
| ? | Matches a single character. |
| * | Matches one or more of any character. |
If you select Exclusion List, DevTools attempts to look up any source maps for scripts except those that have a URL that matches one of the entries in the list.
If you select Inclusion List, DevTools only attempts to look up source maps for scripts that have URLs that match one of the entries in the list. For example, suppose you select Inclusion List in the Filter behavior dropdown list, and then enter the following in the Filter behavior text box:
https://cdn.contoso.com/*
https://packages.contoso.com/*
In this example, DevTools only attempts to resolve source maps that match these two URL patterns, and doesn't attempt to load source maps for other scripts.
See also:
- Securely debug original code by publishing source maps to the Azure Artifacts symbol server
- Securely debug original code by using Azure Artifacts symbol server source maps
Memory tool enhancements
In previous versions of Microsoft Edge, in the Memory tool, when using the Allocation instrumentation on timeline option, the Memory tool takes a sample of the heap every 50 milliseconds. However, taking a sample of the heap scales with the size of the heap, so with a heap size of 200 MB, the sample actually takes 1.5 seconds to generate. As a result, there's little time left on the main thread for your website, outside of generating heap samples. When Allocation instrumentation on timeline is running, it might look like your web content is hanging or blocked.
In Microsoft Edge 115, the sample rate for the heap now scales to the time it takes to generate a sample, freeing up the main thread so that you can interact with your web content while profiling.
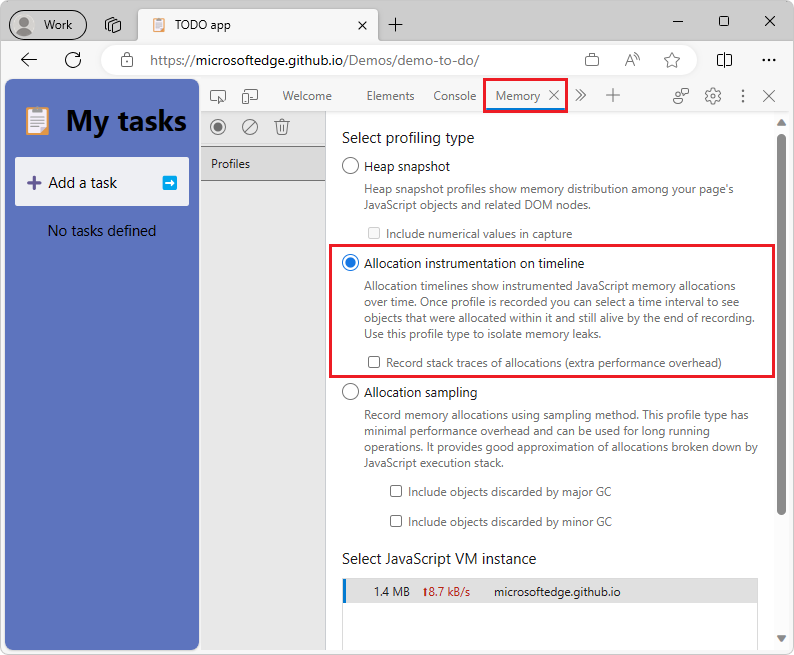
Additionally, in previous versions of Microsoft Edge, heap snapshots would sometimes include objects that should have been garbage-collected (GC'd). In Microsoft Edge 115, this issue has been fixed and heap snapshots are now more accurate.
See also:
- Limit proportion of CPU time given to requestHeapStatsUpdate (4469909) · Gerrit Code Review
- Make heap snapshots more precise (4499405) · Gerrit Code Review
Refreshed DevTools icons and buttons
In Microsoft Edge 115, the DevTools UI has gotten a makeover with new icons and buttons. For example, when debugging in the Sources tool, the current frame in the call stack is indicated by a right-pointing blue arrow. This icon is more consistent with the debugging icons in Microsoft Visual Studio and Microsoft Visual Studio Code:
![]()
In previous versions of Microsoft Edge, in the Bottom-Up view in the Performance tool, the triangle buttons for collapsing and expanding the recorded activities rendered incorrectly. In Microsoft Edge 115, this issue has been fixed and you can now expand and collapse individual activities to see which functions are calling them:
![]()
See also:
- Step through code in JavaScript debugging features.
- The Bottom-Up tab in Performance features reference.
Screen readers correctly announce dropdown state in Device Mode
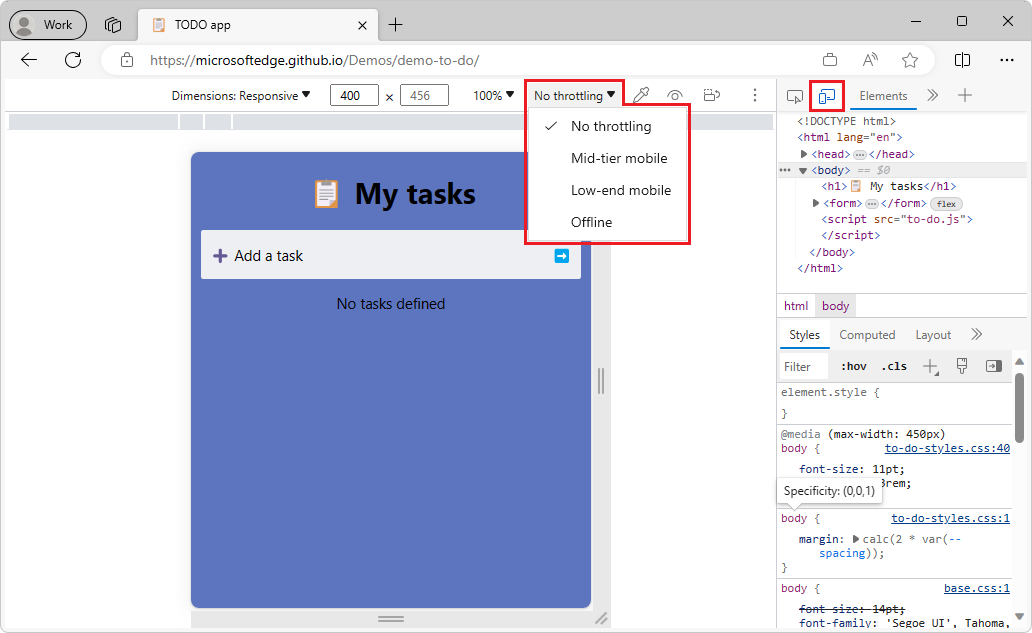
In previous versions of Microsoft Edge, in Device Mode, screen readers incorrectly announced the state of dropdown menus as "expanded" when these menus were actually collapsed. In Microsoft Edge 115, this issue has been fixed and screen readers now correctly announce the state of dropdown menus in Device Mode as "collapsed" or "expanded":
See also:
Profiling improvements for the Performance tool
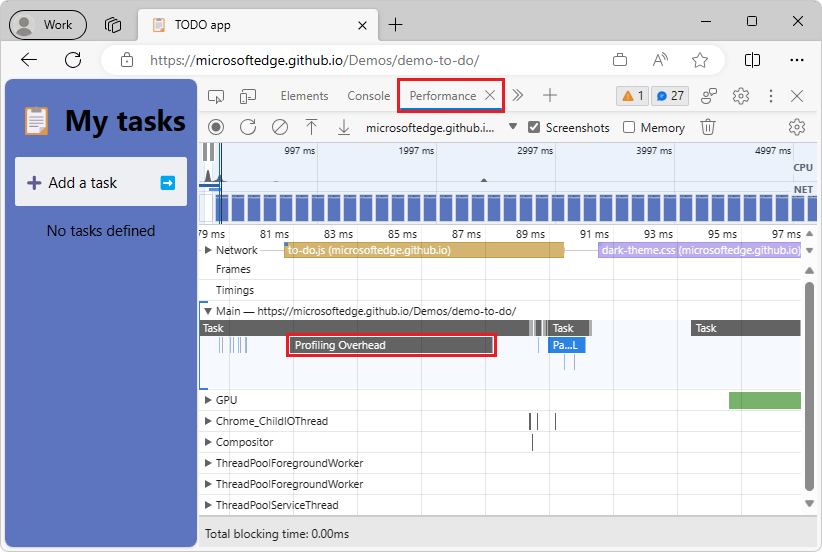
When recording a profile in the Performance tool, the V8 JavaScript engine takes periodic samples of all the JavaScript functions that are running, to accurately report CPU time in the flame chart. When profiling a website that has many cross-domain iframes, these samples take a long time to collect. This results in significant overhead, slowing down the main thread, which slows down the performance of the website while profiling. In Microsoft Edge 115 on Windows, V8 collects these samples more efficiently, resulting in better site performance while profiling.
Additionally, in the Performance tool, you can now see a representation of profiler overhead in the flame chart when recording a profile. This block of time represents the CPU time that's needed to sample and parse events when recording a profile, and doesn't represent CPU time that the users of your website are actually encountering. Profiling Overhead events have been added to the flame chart to help focus your performance investigations on Compile Code and Evaluate Script events that affect your actual users, rather than events that only take time while you're profiling in the Performance tool:
See also:
- Avoid busy-waiting in sampler thread if Windows supports precise sleep (4453767) · Gerrit Code Review
- Show V8.FinalizeDeserialization time as profiler overhead (4504370) · Gerrit Code Review
- Issue 1428605: V8's code cache deserialization is 2-4× slower than a regular uncached compilation when CPU profiling is enabled
Announcements from the Chromium project
Microsoft Edge 115 also includes the following updates from the Chromium project:
Feedback
Coming soon: Throughout 2024 we will be phasing out GitHub Issues as the feedback mechanism for content and replacing it with a new feedback system. For more information see: https://aka.ms/ContentUserFeedback.
Submit and view feedback for