Note
Access to this page requires authorization. You can try signing in or changing directories.
Access to this page requires authorization. You can try changing directories.
To open DevTools in Visual Studio Code in Debug mode by using the DevTools UI, right-click an .html file or click the Launch Project button, as described in Opening DevTools and the DevTools browser. You can also use the Visual Studio Code UI for launching the Debugger, such as F5, to open the DevTools tabs as well, if you define a DevTools-compatible launch.json file by clicking the Generate launch.json button in the Microsoft Edge Tools Side Bar.
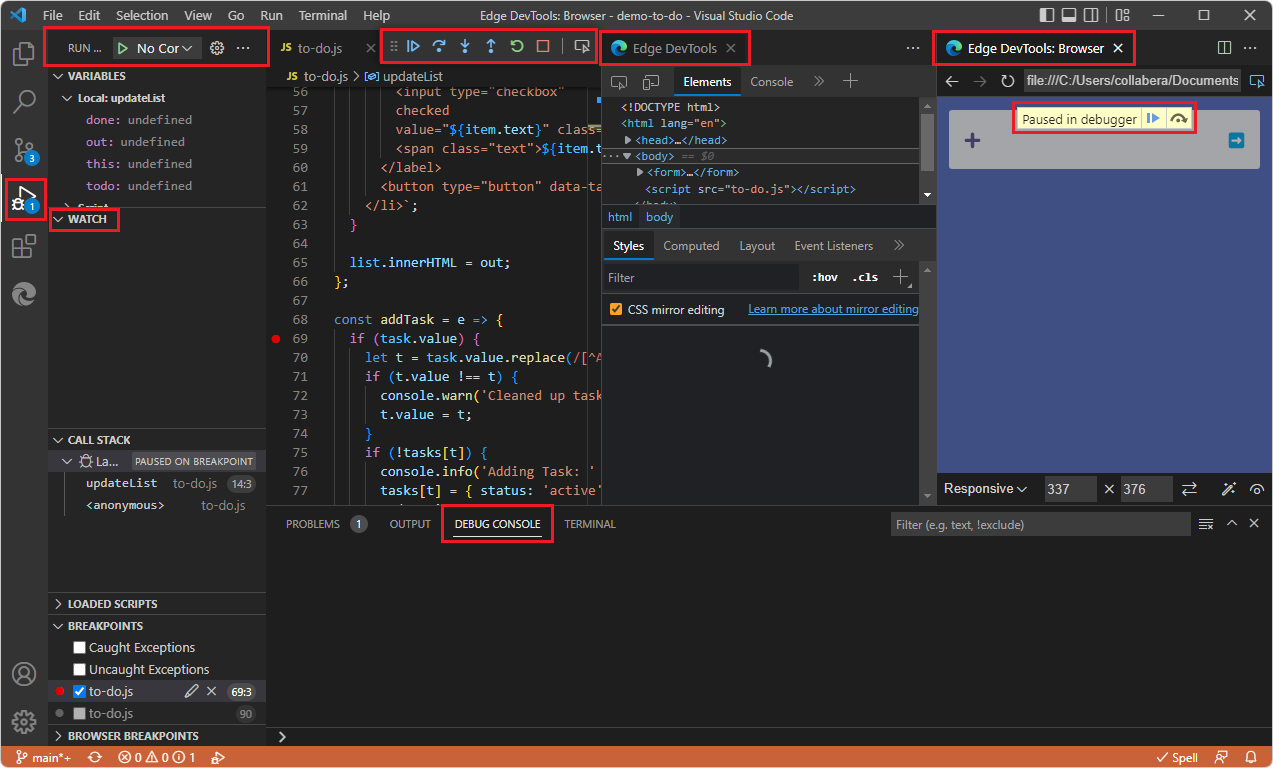
When you open DevTools in Visual Studio Code in Debug mode, the following UI components are opened:
- The Edge DevTools tab.
- The Edge DevTools: Browser tab.
- The Debug toolbar.
- The Run (Debugger) Side Bar, including the Watch pane.
- The Debug Console at bottom of window.
See also Step 5: Step through JavaScript code in the Debugger in Get started by right-clicking an HTML file.
Ways to start the debugger along with the DevTools tabs
Most of these approaches require a DevTools-generated launch.json file that contains your URL.
DevTools UI features to open DevTools in Debug mode
Right-click an
.htmlfile in Explorer > Open with Edge. This approach essentially uses a file path rather than a URL, and doesn't require you to generate alaunch.jsonfile.Activity Bar > Microsoft Edge Tools > click the Launch Project button.
Visual Studio Code UI features to open DevTools in Debug mode
Press F5.
On the Activity Bar, click the Run and Debug icon (
 ), and then in the Run and Debug Side Bar, click the Run and Debug button.
Open the Visual Studio Code command palette, start typing the word debug after >, and then select Debug: Open Link. See Open Link command in Browser debugging in VS Code.
Opening the browser as part of a debugging session
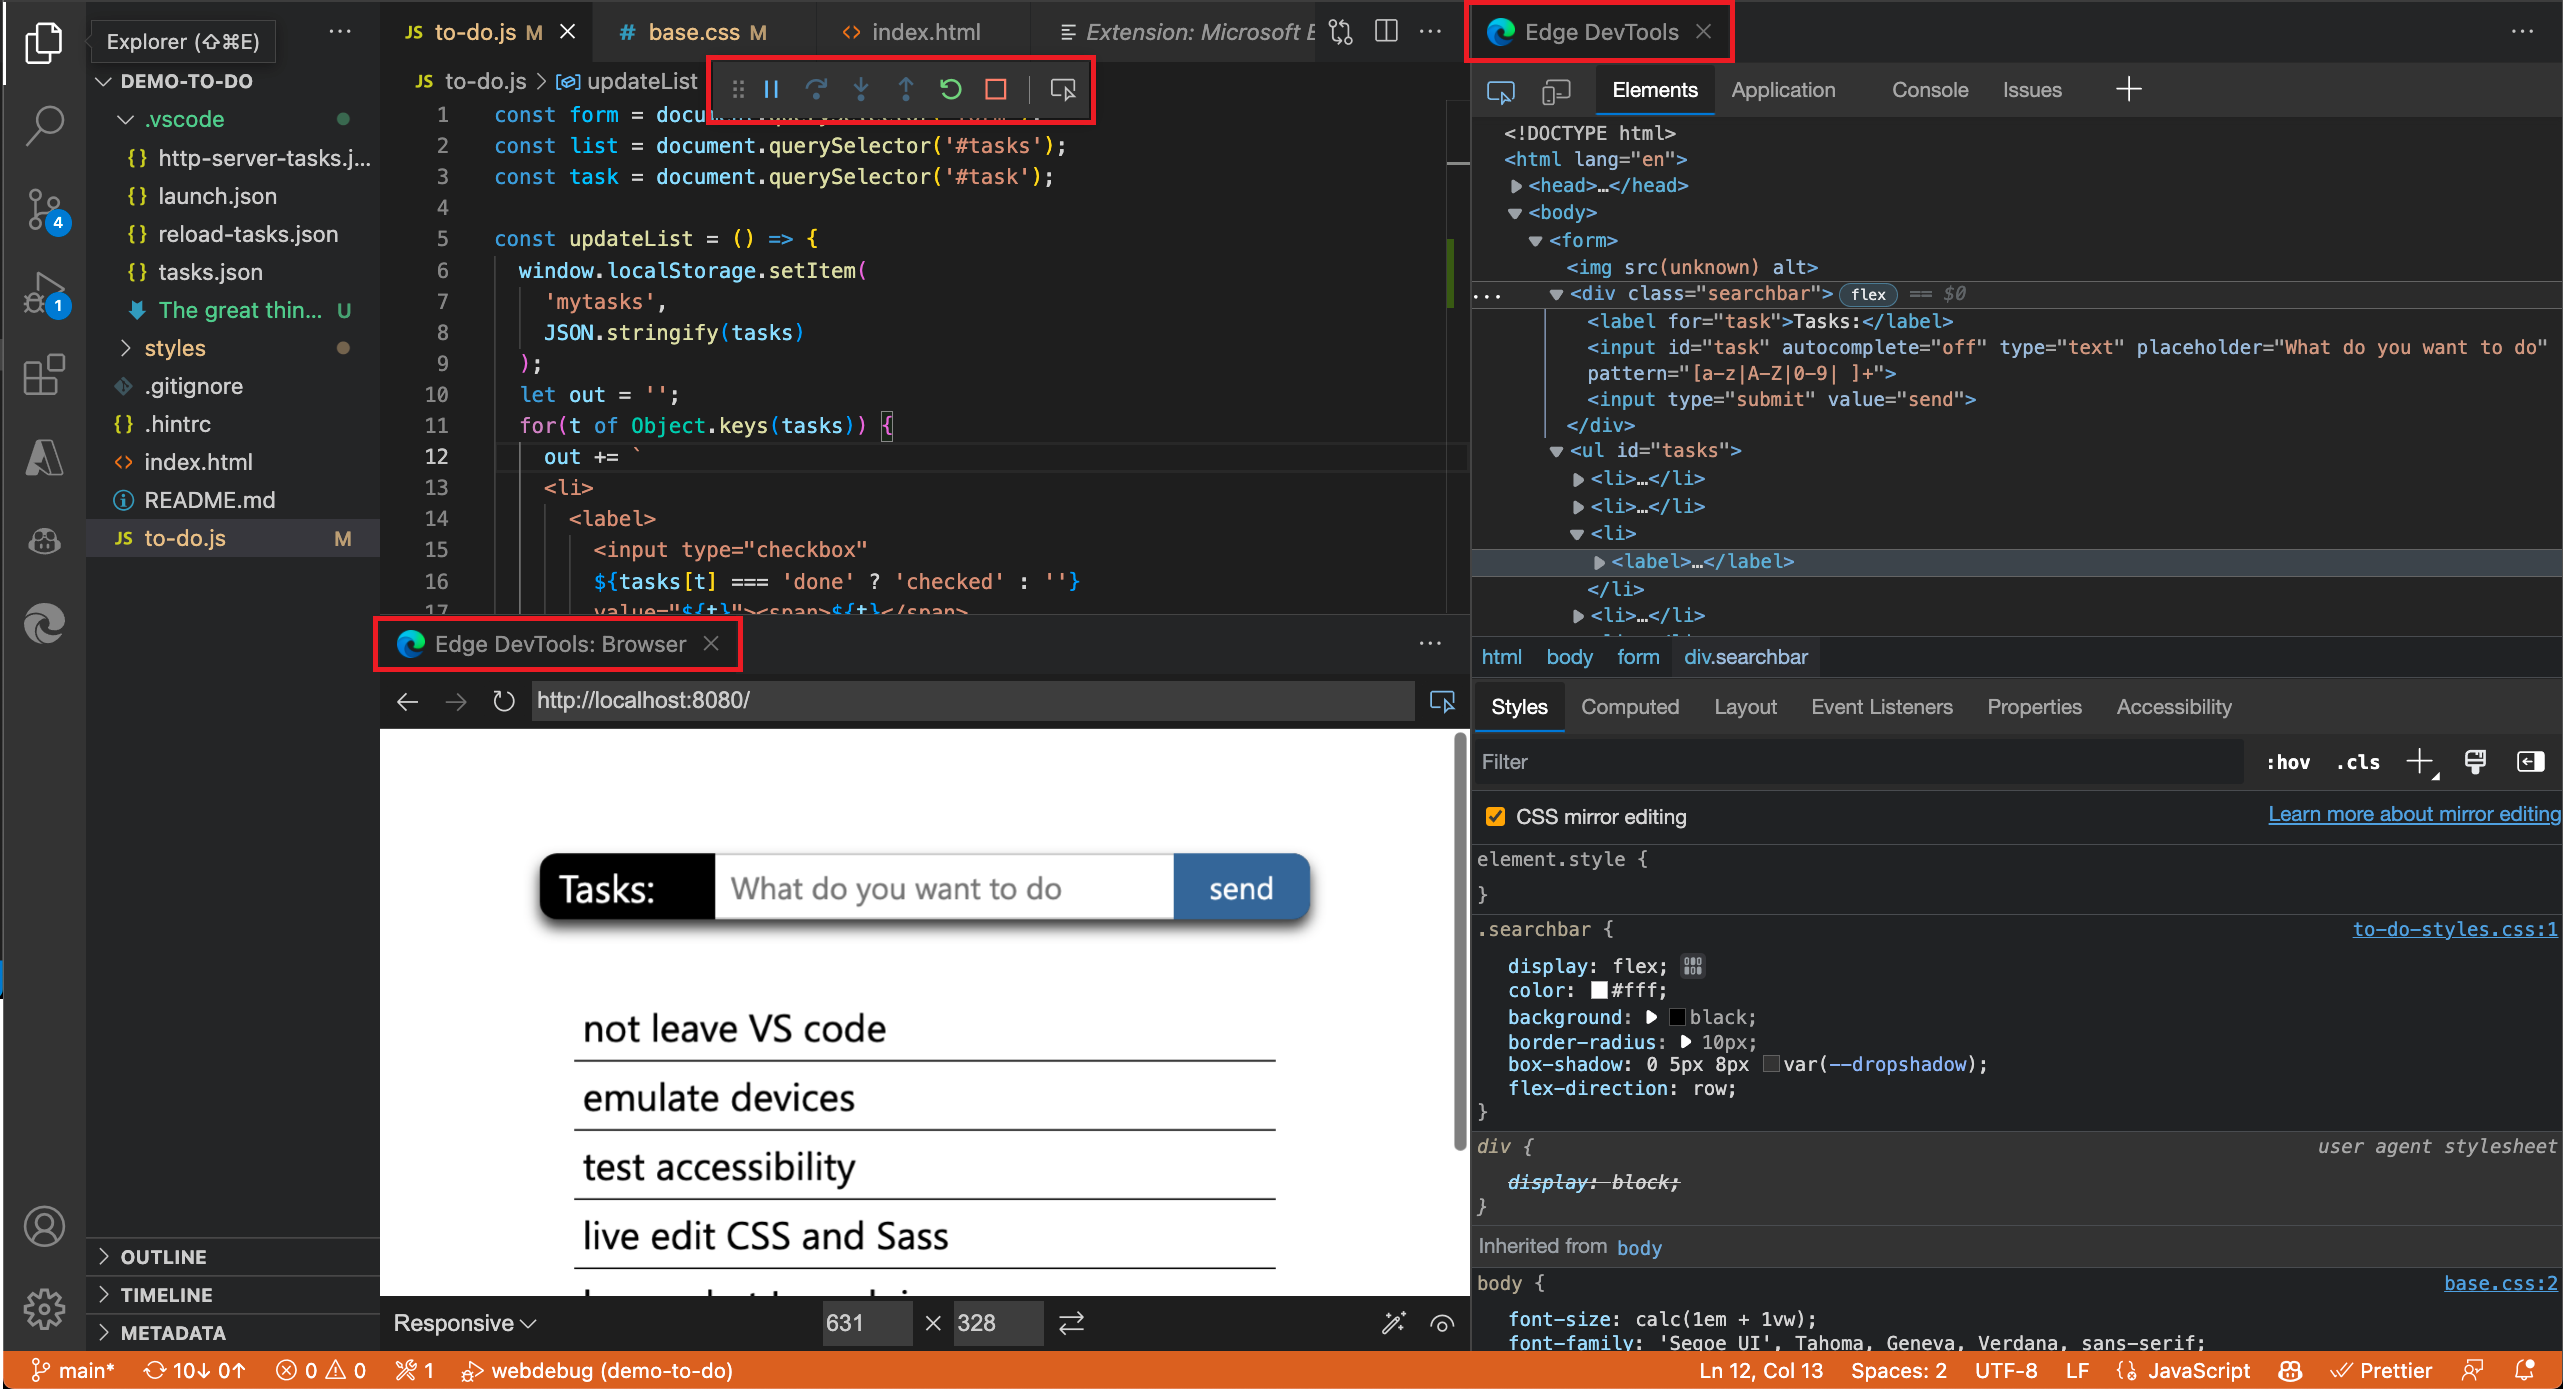
You can open the Edge DevTools: Browser tab (the embedded DevTools browser) as part of a debugging session. The DevTools extension opens a new browser as an embedded browser in Visual Studio Code. This Devtools: Browser tab can be moved anywhere within the editor. You can use this tab side by side with your source code, or split the panes and have the browser preview below your code:
You can use the DevTools extension with the usual Visual Studio Code debugging UI/workflow, as follows. In this approach, to enter Debug mode, we are not using the DevTools UI; we are not right-clicking an .html file to select Open with Edge, and we are not clicking the Activity Bar > Microsoft Edge Tools > Launch Project button.
JavaScript debugging is built in to Visual Studio Code; you can debug in Chrome, Microsoft Edge, or Node.js without installing extensions. If you debug by using the Microsoft Edge option with the Visual Studio Code debugging features and UI, you can start Microsoft Edge DevTools from the JavaScript debugger. If the DevTools extension isn't installed, you're prompted to optionally install it.
The DevTools extension gives additional functionality, such as the embedded DevTools browser which has a Device Emulation toolbar, and provides additional ways to enter Debug mode in Visual Studio Code.
See also:
- Limitations of the embedded DevTools browser in Using an external browser window.
Start the debugger
To start the Visual Studio Code debugger along with DevTools, by using the usual UI that's part of Visual Studio Code:
Open a new Visual Studio Code window. No folder (workspace) is open, and the DevTools tabs aren't open.
Open a folder (workspace). For example, select File > Open Recent >
C:\Users\username\Documents\GitHub\Demos\demo-to-do. The DevTools tabs aren't open.Open an
.htmlfile.Click in the
.htmlfile in the editor, and then do any of the following UI actions that start the Visual Studio Code debugger the usual ways:Press F5.
On the Activity Bar, click the Run and Debug icon (
), and then in the Run and Debug Side Bar, click the Run and Debug button, as shown below.Open the Visual Studio Code command palette, start typing the word debug, and then select Debug: Open Link.
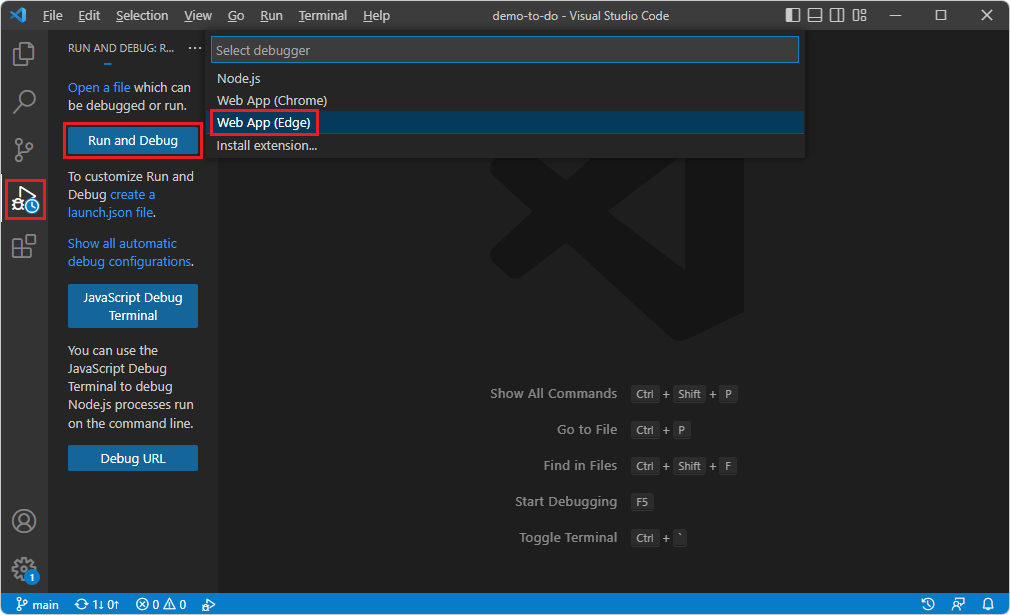
Microsoft Edge Tools doesn't appear in the above screenshot, because for this screenshot, DevTools was uninstalled.
Select Web App (Edge).
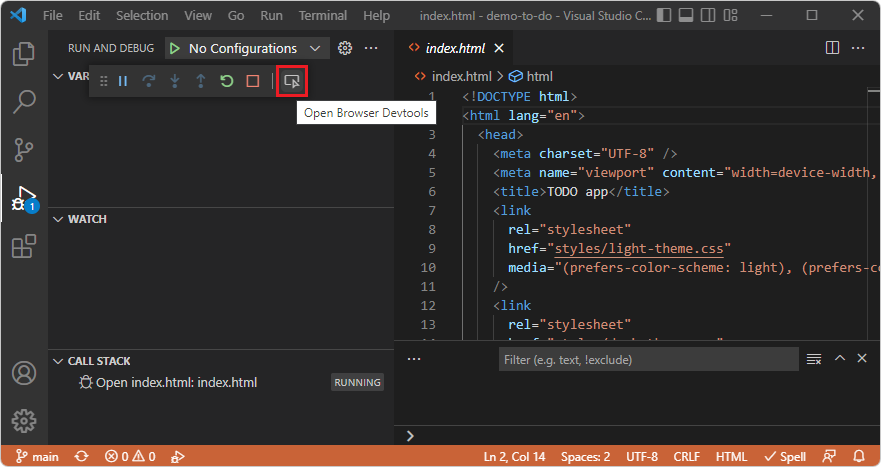
On the Debug toolbar, click the Inspect button, which has a tooltip of Open browser DevTools:
The first time you click the Inspect button on the Debug toolbar, the Extensions: Marketplace Side Bar opens, containing Microsoft Edge Tools for VS Code:
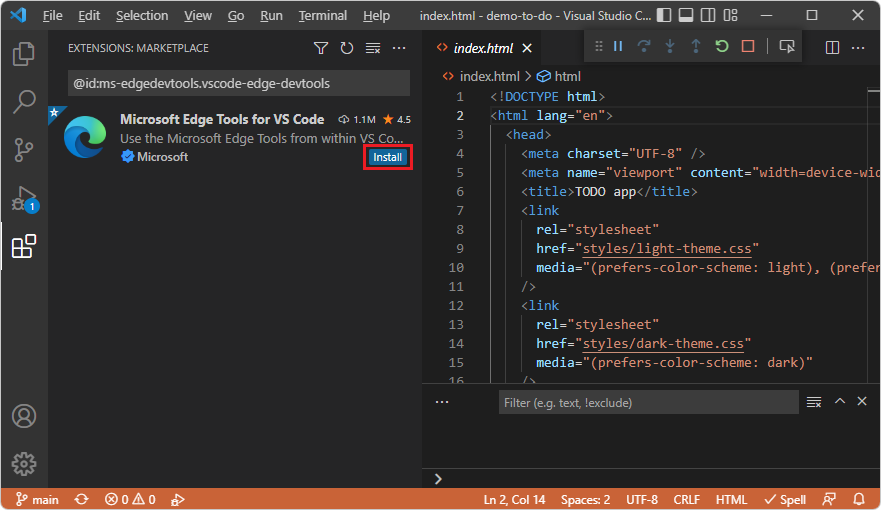
Click Microsoft Edge Tools for VS Code > Install.
Close DevTools per Closing DevTools.
Open a folder and an
.htmlfile.
Continue below.
Generating a DevTools-oriented launch.json
Assuming that the opened folder doesn't contain a .vscode folder that contains a launch.json file already:
Select Activity Bar > Microsoft Edge Tools > click the Generate launch.json button, and then press F5. Or, see Opening DevTools and the DevTools browser.
After the DevTools extension is installed, when you open an
.htmlfile and then click the Inspect button on the Debug toolbar, the Edge DevTools tabs open inside of Visual Studio Code: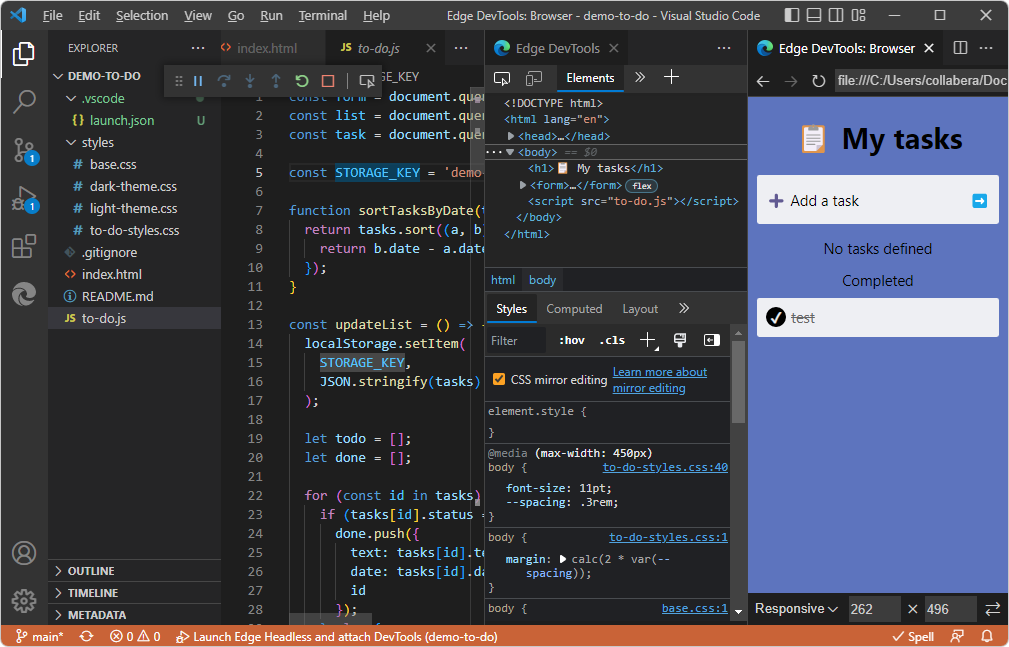
In the above screenshot, there's a
launch.jsonfile in Explorer in the.vscodefolder, and a string from that file, Launch Edge Headless and attach DevTools, at the bottom of the window, because DevTools was opened by a Visual Studio Code feature such as F5, which used the DevTools-generatedlaunch.jsonfile.If needed, in the upper left of the Edge DevTools tab, click the Toggle screencast button:
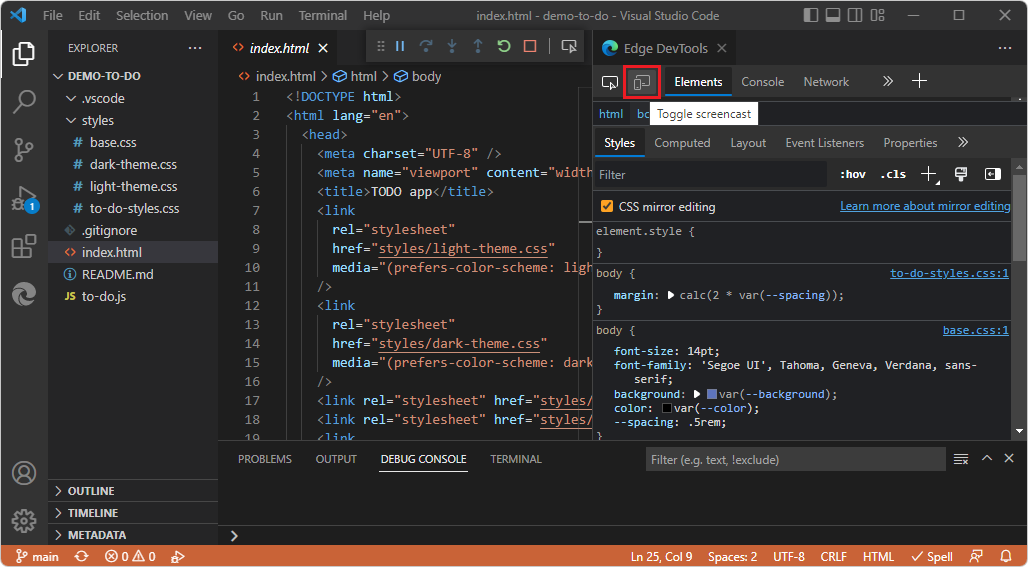
The Edge DevTools: Browser tab opens.
In the above screenshot, there's no
launch.jsonfile in Explorer in the.vscodefolder, and no string such as Launch Edge Headless and attach DevTools at the bottom of the window, because DevTools was opened by right-clicking the.htmlfile in Explorer.
For additional UI steps and screenshots, see Where the name strings appear in the UI. In most cases, the only thing you need to know about the content of the DevTools-generated launch.json file is that you need to enter your desired URL in the "url" string in several places.
Automatically opening the browser and DevTools when debugging in Visual Studio Code
To debug your project, you might want to change the default page that opens in Microsoft Edge in Visual Studio Code. To change the default page to your project's website:
In Visual Studio Code, select File > New Window. Notice that no folder is open.
On the Activity Bar, select Microsoft Edge Tools.
In the Microsoft Edge Tools: Targets panel, click the open a folder link.
Select your project folder with the new default page to display when you begin debugging in Visual Studio Code.
The first time you open a folder, you must confirm that you trust the authors of files in this folder:
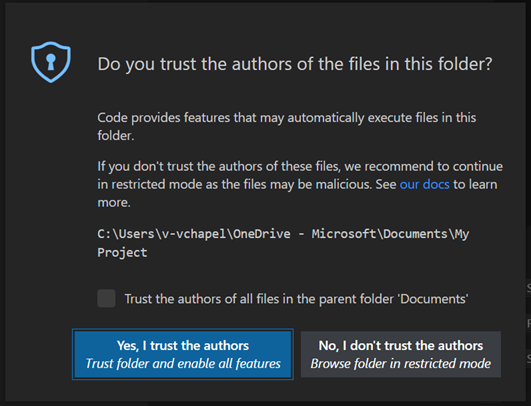
Optionally select the checkbox Trust the authors of all files in the parent folder, and then click the Yes, I trust the authors button:
The first time you do this process, you must also select Activity Bar > Microsoft Edge Tools again.
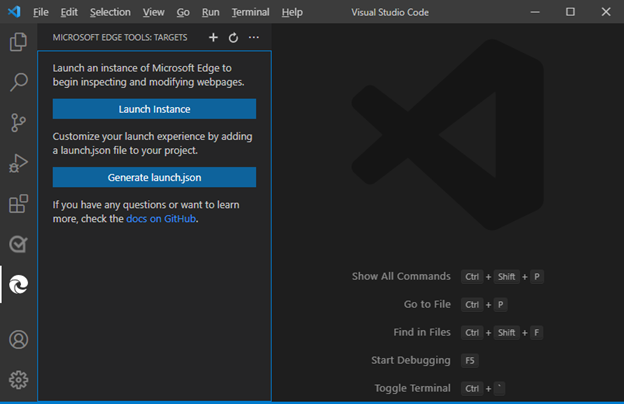
The Microsoft Edge Tools: Targets panel now displays two buttons: Launch Instance and Generate launch.json:
Generating a DevTools-oriented launch.json
Select Generate launch.json to create a
launch.jsonin your project. This must be a longer file that's created by DevTools, as shown in The launch.json file for the DevTools extension, not a short, more generic file created by Visual Studio Code. See also Deleting or re-creating launch.json in Troubleshooting the DevTools extension.In
launch.json, add the URL of your project. If you leave URL empty, the default page is displayed.Save
launch.json.
When you choose to debug your project in Visual Studio Code, whether you use DevTools UI features or the usual Visual Studio Code UI features, it will automatically launch the browser and open the Developer Tools, showing the URL you specified in your launch.json file.
If you see the Success page but want your own webpage instead
Which webpage opens is in DevTools is set by launch.json if that file exists in your workspace (your open folder). Thus you might press F5 while your own .html file is open, and yet see the default, Success page in the DevTools tabs. Options in that case are:
Edit
launch.jsonin your open folder to point to a URL (normally), or possibly a file path. Then you can use the Visual Studio Code debugger workflow/UI, such as F5.Or, delete
launch.json, then Activity Bar > Explorer > right-click your.htmlfile > select Open with Edge. This approach doesn't use the Visual Studio Code Debugger workflow/UI, such as F5.
See also
- The launch.json file for the DevTools extension
- Debug Microsoft Edge in Visual Studio Code
- Microsoft Edge DevTools extension for Visual Studio Code
- The Visual Studio Code debugger now integrates with the DevTools extension in What's new in DevTools (Microsoft Edge 93).
External pages:
- Launch configurations in the Debugging article for Visual Studio Code.
- Browser debugging in VS Code