Note
Access to this page requires authorization. You can try signing in or changing directories.
Access to this page requires authorization. You can try changing directories.
Use this tutorial to learn how to open and close DevTools by right-clicking an .html file for Demo To Do in the Explorer of Visual Studio Code, without needing to run a web server.
Step 1: Install DevTools and prerequisites
- If you haven't already, do the steps in Installing the DevTools extension for Visual Studio Code, and then continue below. You don't need to install and start a web server for the present tutorial, but it's recommended.
Step 2: Start DevTools by right-clicking an HTML file
Right-clicking an .html file in Visual Studio Code's Explorer is the main way to open DevTools when your webpage doesn't require running on a web server.
Unlike the Launch Instance button, this approach opens DevTools in Debug mode.
Unlike the Launch Project button that we'll use later, this approach doesn't require you to generate a
launch.jsonfile.
We'll demonstrate by opening the demo-to-do web app:
In Visual Studio Code, select File > Open Folder.
Go to the directory where you cloned the Demos repo, open the specific directory for the demo-to-do app, such as
C:\Users\username\Documents\GitHub\Demos\demo-to-do\, and then click the Select Folder button: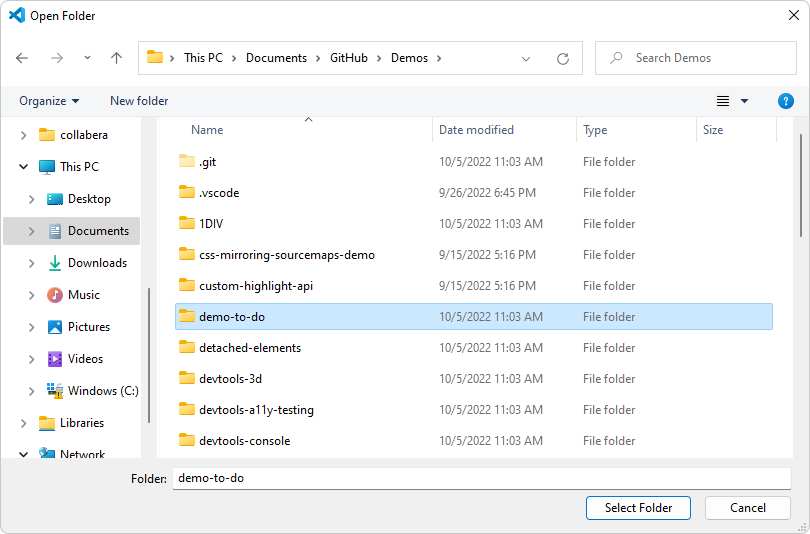
Select Activity Bar > Explorer (
 ) > right-click
 index.htmland then select Open with Edge > Open Browser with DevTools: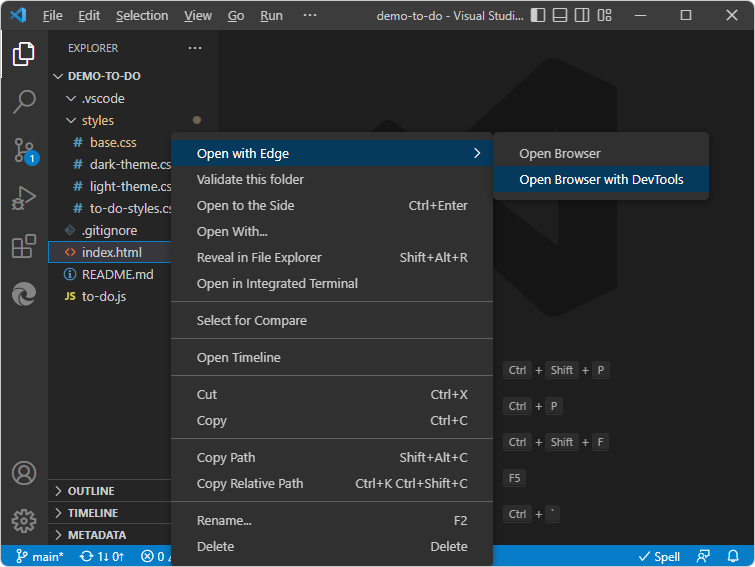
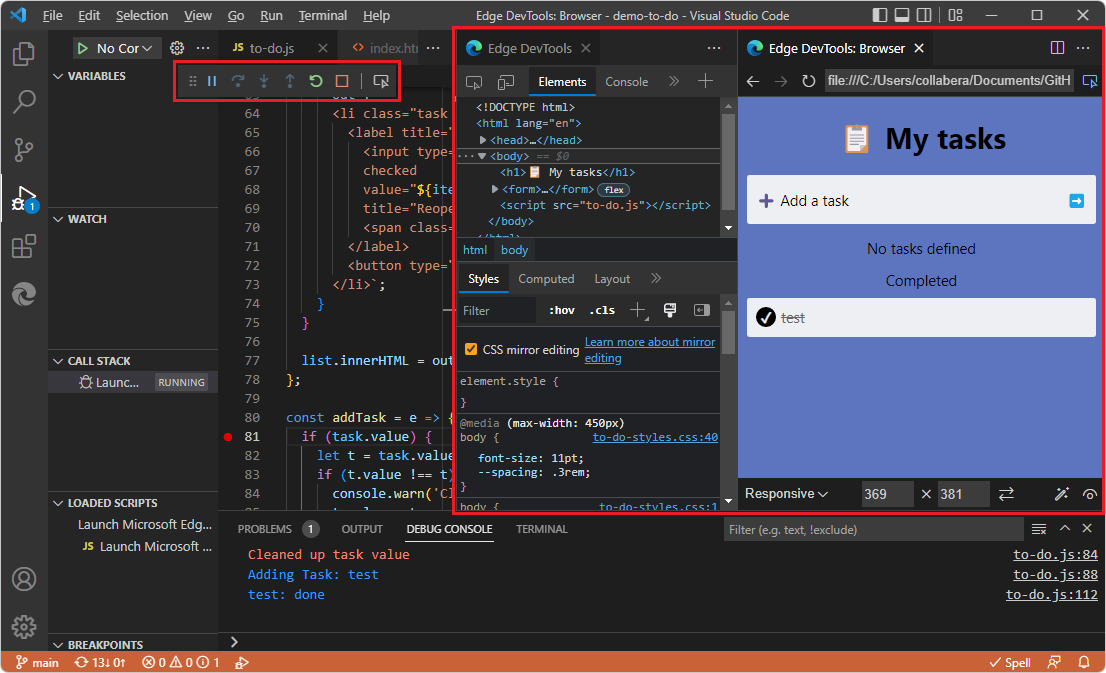
The Edge DevTools tab opens.
The Edge DevTools: Browser tab opens, displaying the webpage you right-clicked.
The Debug toolbar of Visual Studio Code opens, the Debug Console opens at the bottom, and the Run pane opens. These features indicate that Visual Studio Code is in Debug mode:
Step 3: Arrange tabs
To save space, use the Close DevTools or Open DevTools button and the Toggle screencast button to toggle (open or close) the DevTools tabs.
Toward the upper left corner of the Edge DevTools tab, click the Toggle screencast button:
The Edge DevTools: Browser tab closes.
In the Edge DevTools tab, click the Toggle screencast button again.
The Edge DevTools: Browser tab opens.
In the top right of the Edge DevTools: Browser tab, click the Close DevTools button:
In the top right of the Edge DevTools: Browser tab, click the Open DevTools button.
Drag the Edge DevTools: Browser tab to dock it anywhere in Visual Studio Code, such as grouping it with the source code editor.
Step 4: Edit CSS in DevTools, updating the .css file automatically
In the Edge DevTools tab, in the Elements tool > Styles tab, you can edit CSS selectors, rules, and values. The CSS mirror editing checkbox is selected by default, so the .css file is automatically edited, but the edits are not saved, so that you can decide whether to save the changes.
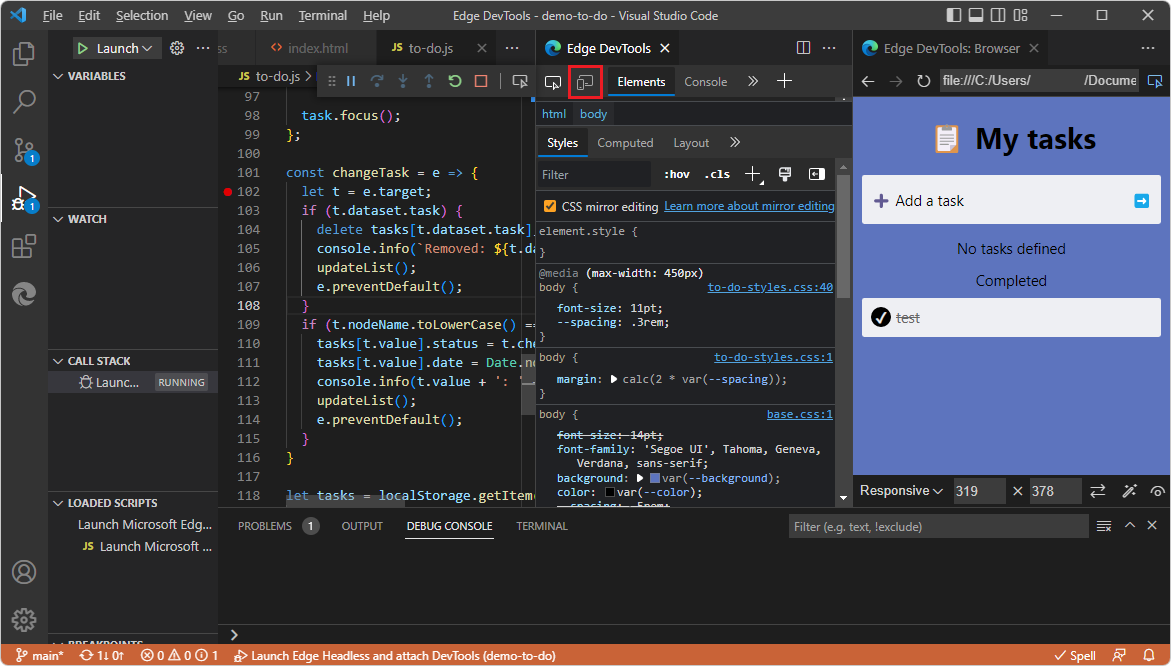
In the Elements tool, in the Styles tab, click a CSS value, such as the body font size.
Change the CSS value, such as using mouse wheel or pressing Up Arrow and Down Arrow. The associated
.cssfile opens, such asto-do-styles.cssand scrolls to the line that defines the CSS value, and automatically edits the.cssfile but doesn't save changes: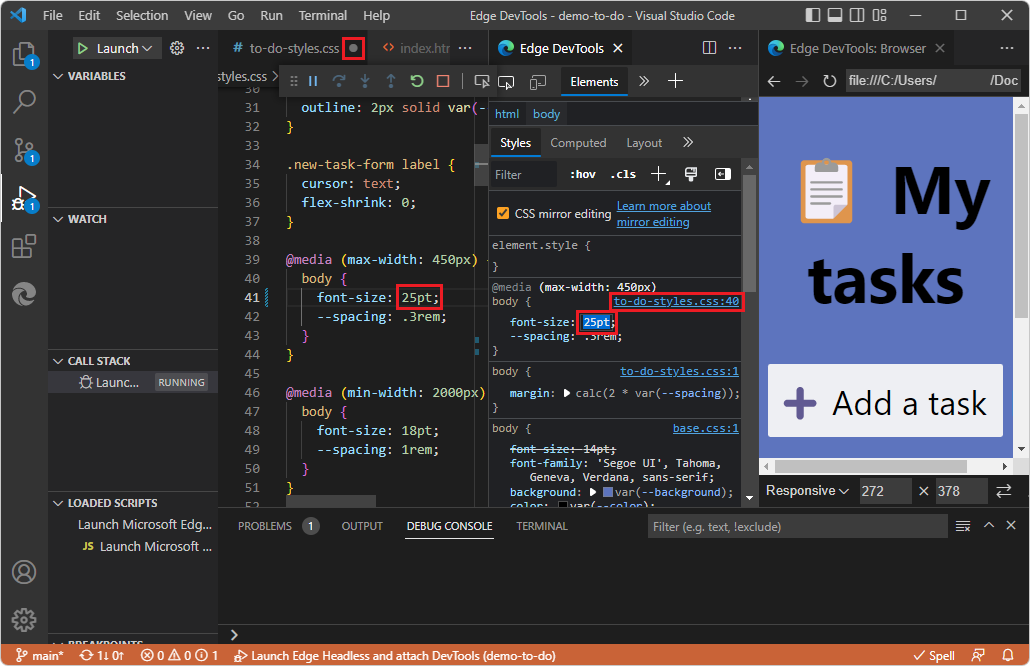
Close the
.cssfile. Visual Studio Code prompts you whether to save changes.Click the Don't Save button.
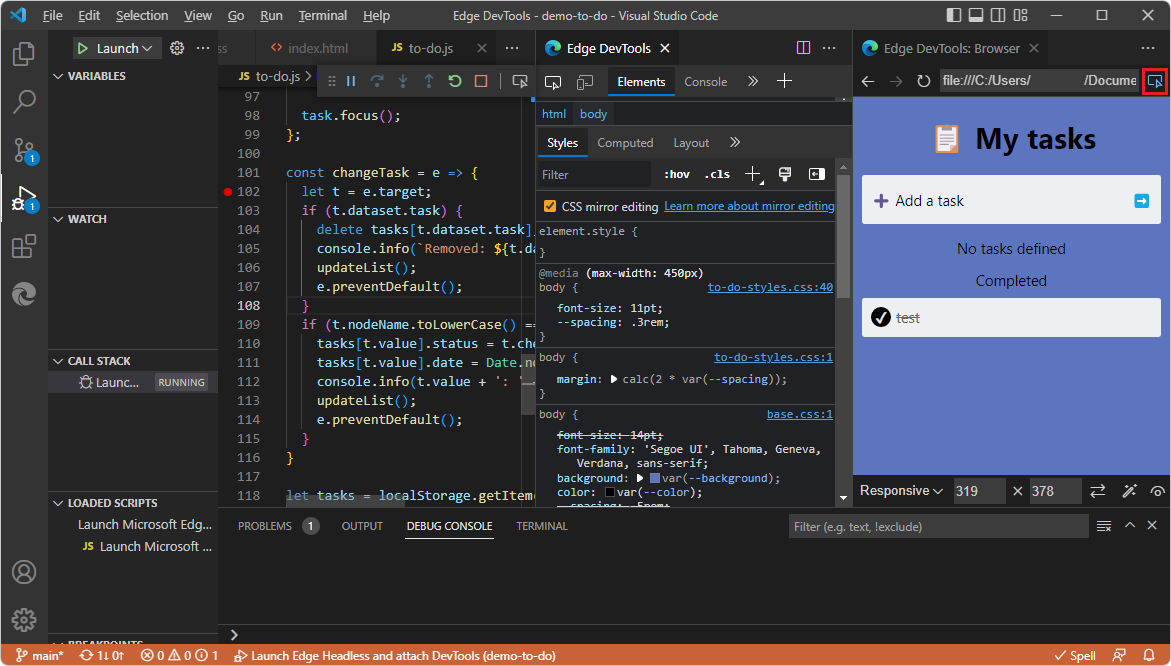
Step 5: Step through JavaScript code in the Debugger
Select Activity Bar > Explorer (
).In the demo-to-do directory, click to-do.js to open it. Scroll down to the
changeTaskfunction and then click to the left of a line number to set a breakpoint:
If the Run and Debug Side Bar isn't displayed, select View > Run. The Run and Debug Side Bar includes the Watch pane and other debugger panes.
In the demo app rendered in the Edge DevTools: Browser tab, enter a task, such as test. The debugger of Visual Studio Code pauses at the breakpoint in the
to-do.jsfile:In the Debug toolbar, or using the Run menu or by pressing keys, step through a couple lines of code in
to-do.js.In the demo app rendered in the Edge DevTools: Browser tab, click the "done" circle next to the test task. The debugger of Visual Studio Code pauses at the breakpoint in the
to-do.jsfile.
Step 6: Close DevTools
To end debugging and close the Edge DevTools tabs:
In the Debug toolbar, click the Stop (Shift+F5) button. Or, on the Run menu, select Stop Debugging:
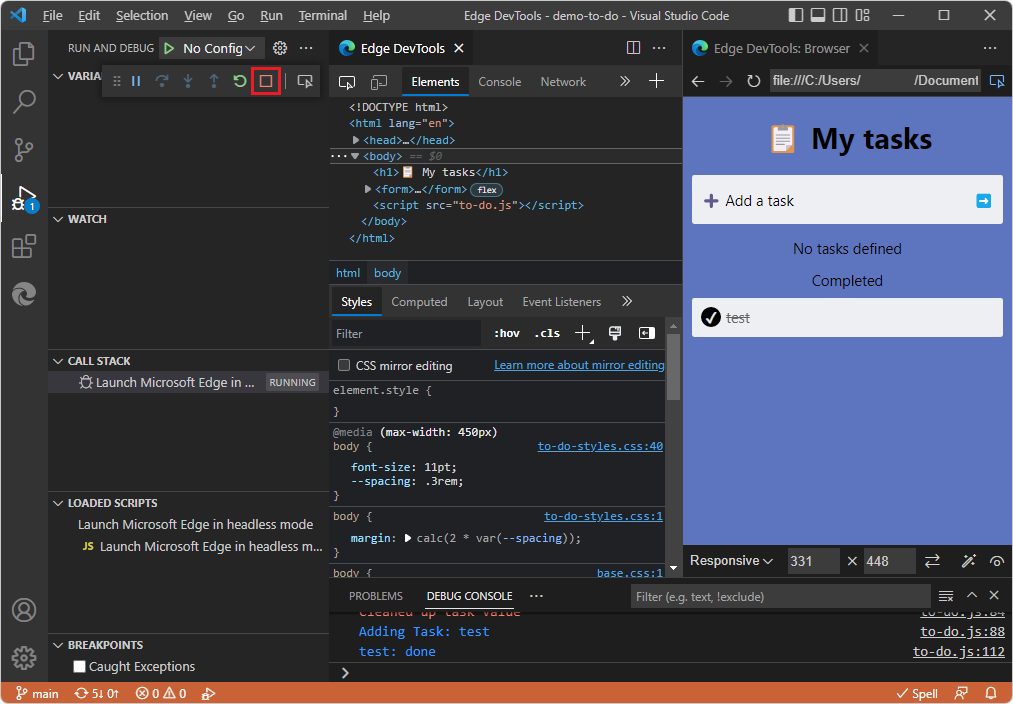
The Edge DevTools tab closes, and the Edge DevTools: Browser tab closes.
See also:
- Closing DevTools in Opening DevTools and the DevTools browser.
You've finished the tutorial "Get started by right-clicking an HTML file". It's recommended that you also do the other tutorials; see Get started using the DevTools extension for Visual Studio Code.
See also
GitHub:
- demo-to-do - the demo web app running on the
github.ioserver. - Source code for demo-to-do
- MicrosoftEdge/Demos repo