Note
Access to this page requires authorization. You can try signing in or changing directories.
Access to this page requires authorization. You can try changing directories.
Use this tutorial to learn how to open and close DevTools by clicking the Launch Instance button, to experiment with the demo Success webpage. This approach opens the default, Success webpage for editing, so you can practice and get started using DevTools. This approach is prominent in the UI, and it opens the DevTools tabs in non-debug mode.
This way of opening DevTools is useful for these simple scenarios:
If you want to experiment with editing the default, Success page by using DevTools.
If you want to inspect a page that's specified by using a URL, and don't need Debug mode. To open a different webpage, you can paste a URL or file path, in the Address bar.
If you don't have a folder open and you want to experiment with changing CSS on a page that's specified by using a URL, without editing a local source file.
Step 1: Install DevTools and prerequisites
- If you haven't already, do the steps in Installing the DevTools extension for Visual Studio Code, and then continue below. You don't need to install and start a web server for the present tutorial, but it's recommended.
Step 2: Click the Launch Instance button
In Visual Studio Code, select File > New Window. Initially, no folder is opened.
In Activity Bar, click Microsoft Edge Tools (
 ). The Microsoft Edge Tools Side Bar opens:
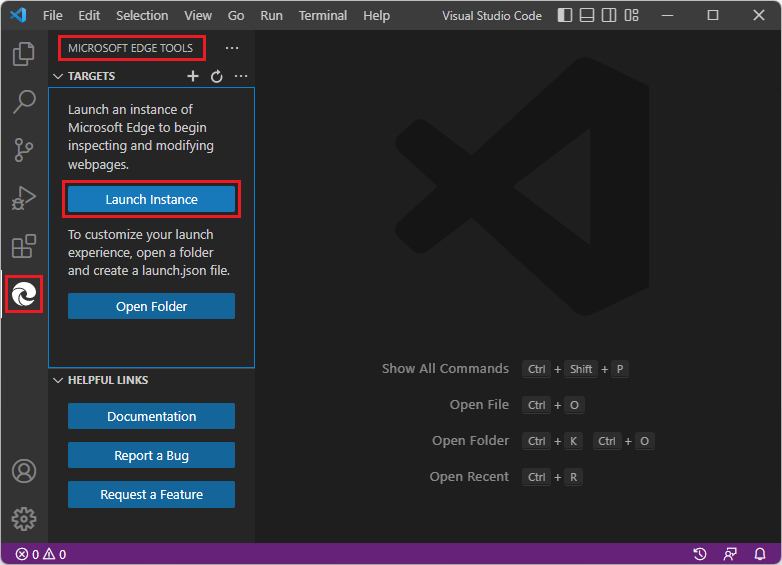
Click the Launch Instance button. The Edge DevTools tab opens, and the Edge DevTools: Browser tab opens, displaying the default, Success page:
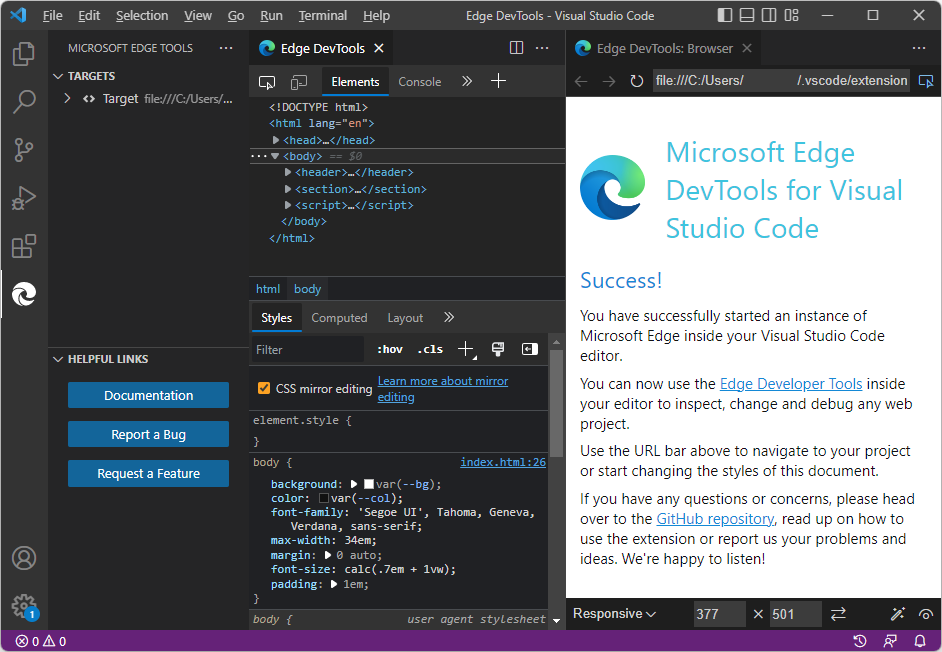
The Success page source file is a self-contained
.htmlfile in a directory on your drive. This is a single.htmlfile that includes CSS rules (in a<style>element). It also includes a JavaScriptconsolestatement (in a<script>element).In the Address bar of the DevTools browser, there is a
file:///path (rather than a URL), such asfile:///C:/Users/username/.vscode/extensions/ms-edgedevtools.vscode-edge-devtools-2.1.1/out/startpage/index.html.The Debug toolbar doesn't open, Debug Console doesn't open at bottom, and the Run and Debug Side Bar with Watch pane doesn't open. This indicates that Visual Studio Code is not in Debug mode.
You can modify CSS of the local files, and you can enter local file paths or localhost URLs in the Address bar and interact with local web app pages.
Step 3: Open a folder, to ensure editing is allowed
Note that no folder is open in Visual Studio Code. In many cases, to use DevTools to edit rather than merely inspect a webpage, you must open a folder that contains source files that match the displayed webpage. Opening a folder gives the most flexibility so you can open either a URL or a file path in the Address bar of the Edge DevTools: Browser tab and have full DevTools functionality.
Opening a folder gives you the opportunity to grant trust to the folder, so that you don't get an error message when you try to change the source files. Otherwise you might get an error message because the folder that contains the Success page is not trusted, and CSS mirror editing is trying to edit the CSS in the index.html source file in that folder.
In the Edge DevTools: Browser tab, in the Address bar, select and copy the file path, but not the file name, such as
C:/Users/username/.vscode/extensions/ms-edgedevtools.vscode-edge-devtools-2.1.1/out/startpage/.In Activity Bar > Explorer, click the Open Folder button. In the Open Folder dialog, paste or select the path you copied above. To paste, on Windows, you might need to change
/to\throughout the path. Then click the Select Folder button.The first time you open a folder, you must confirm that you trust the authors of files in this folder:
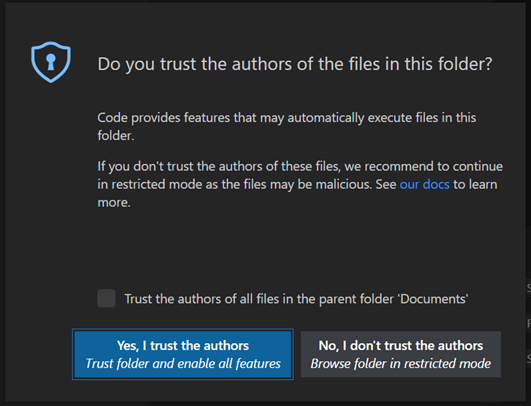
Click the Yes, I trust the authors button.
You might need to launch DevTools again, as follows:
In Activity Bar, click Microsoft Edge Tools (
). The Microsoft Edge Tools Side Bar opens.Click the Launch Instance button. The Edge DevTools tab opens, and the Edge DevTools: Browser tab opens, displaying the default, Success page.
Step 4: Edit CSS
In the Edge DevTools tab, click the Select an element in the page to inspect it (
 ) button, sometimes called the Inspect button.
In the Edge DevTools: Browser tab, hover over different parts of the page, while you watch the Elements tool's DOM tree expand and update.
Click the Success! heading, which is an
<h2>element.In the Styles tab of the Elements tool in the Edge DevTools tab, in the non-italic h2 declaration section, click to the right of the
margin-bottomrule.Enter a new CSS rule,
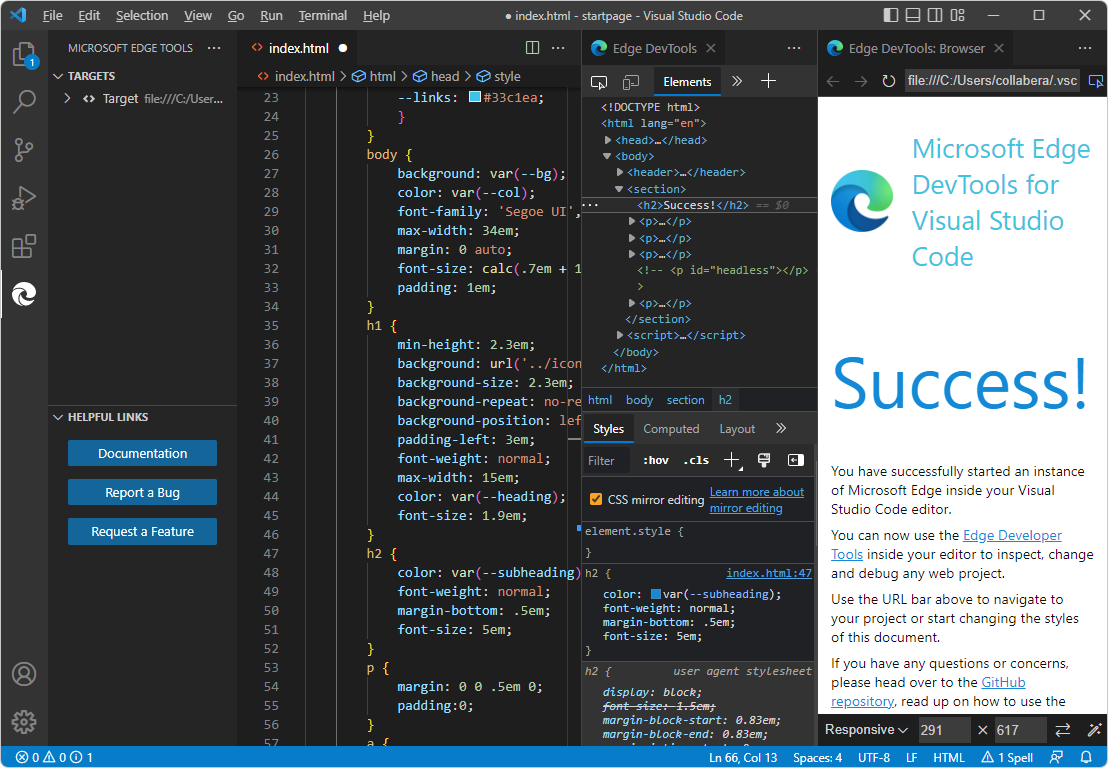
font-size: 5em, and then press Enter. The spelling is similar to the rule shown in the italic h2 section from the user agent stylesheet below it.index.htmlopens, automatically edited by CSS mirror editing to add the linefont-size: 5em;. Scroll to that line, in the h2 section.
Step 5: Arrange tabs
In the Edge DevTools tab, in the non-italic h2 section, click the
font-sizeCSS rule that you entered, and then press Up Arrow and Down Arrow. The value inindex.htmlis automatically edited, by CSS mirror editing.In the Edge DevTools tab, click the Toggle screencast button a couple times. The Edge DevTools: Browser tab opens and closes, saving space.
In the Edge DevTools: Browser tab, click the Close DevTools or Open DevTools button a couple times. The other DevTools tab opens and closes, saving space.
Along the top of Visual Studio Code, right-click the tabs and arrange them to show the various tabs at the same time:
- The Side Bar, showing Microsoft Edge Tools > Targets.
- The
index.htmleditor. - The Edge DevTools tab.
- The Edge DevTools: Browser tab.
Step 6: View JavaScript
- In the Edge DevTools tab, click the Console tool's tab.
index.htmlcontains a<script>element that contains a JavaScript statementconsole.info('Hello from the startpage!'), which outputs "Hello from the startpage!"
Step 7: Open a different .html file by using the Address bar
By entering a file path in the Address bar of the Edge DevTools: Browser tab, the Launch Instance button can also be used to open a different .html file instead of the Success page. We'll demonstrate that below. However, right-clicking an .html file in the Explorer is the main way to open an .html file other than the Success webpage, and the tools open in Debug mode.
In Visual Studio Code, select File > Open Folder (or Open Recent). Open the
\Demos\demo-to-do\folder of the Demos repo that you cloned, such asC:\Users\username\Documents\GitHub\Demos\demo-to-do\.If prompted, click the Yes, I trust the authors button. Aside from granting trust, the Launch Instance approach doesn't actually require opening a folder, if you specify a file path rather than a URL in the DevTools browser.
If the Edge DevTools tabs aren't open already, in the Activity Bar, click Microsoft Edge Tools (
), and then click the Launch Instance button:In the Activity Bar, select Explorer, and then right-click
\demo-to-do\index.html> Copy Path.In Visual Studio Code, in the Edge DevTools: Browser tab, in the Address bar, paste the local filepath that you obtained above, such as
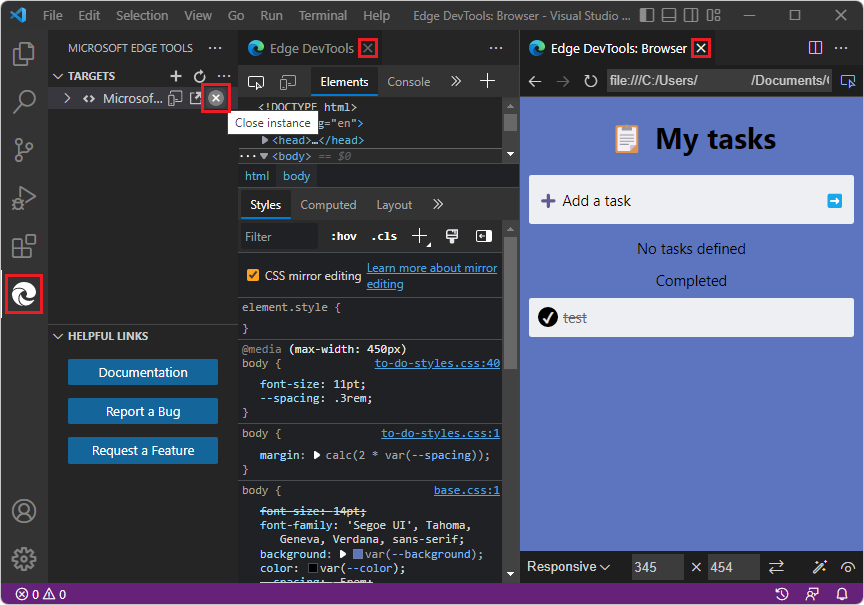
C:\Users\username\Documents\GitHub\Demos\demo-to-do\index.html. The demo-to-do app opens. In the Address bar, thefile:///prefix is added and (on Windows) backslashes are changed to forward slashes; for example:file:///C:/Users/username/Documents/GitHub/Demos/demo-to-do/index.html.In the demo app, enter a task, such as test.
In the Elements tool, in the Styles tab, change a CSS value, such as: click the point size in
body { font-size: 11pt;}and then change the value. The corresponding.cssfile in the folder that you opened opens and it is automatically edited to match your changes made in the Styles tab (but is not saved).
Step 8: Open a URL by using the Address bar
The Address bar that results from the Launch Instance button can be used to open a URL on a server. However, the Launch Project button, along with a URL stored in launch.json, is the main way to open a webpage by specifying a URL, and the tools then open in Debug mode.
If your localhost server is running, paste a localhost URL, such as
http://localhost:8080. Or, paste the github.io server URL, https://microsoftedge.github.io/Demos/demo-to-do/.If you want to use CSS mirror editing to edit your source files, you'll need to open a folder in Visual Studio Code; otherwise, clear the CSS mirror editing checkbox in the Styles tab in the Elements tool in the Edge DevTools tab. Clearing the checkbox prevents error messages about mapping and mirror editing when you experiment with changing CSS in DevTools and haven't provided a CSS source file for DevTools.
In the demo app, enter a task, such as test.
In the Elements tool, in the Styles tab, change a CSS value, such as: click the point size in
body { font-size: 11pt;}and then change the value. The corresponding.cssfile in the folder that you opened opens and it is automatically edited to match your changes made in the Styles tab (but is not saved).
Step 9: Close DevTools
Click Close (x) in the Edge DevTools tab and in the Edge DevTools: Browser tab, if these tabs are open.
Select Activity Bar > Microsoft Edge Tools. If the Targets section lists any targets, hover on the right side of the target instance and then click Close instance (x). The Launch Instance button appears, indicating that all DevTools instances are closed.
Note that in the above screenshot, Visual Studio Code isn't in Debug mode; for example, there's no Debug toolbar. If there were a Debug toolbar, you could close DevTools by clicking the Stop button.
Close
index.htmlwithout saving changes.Select File > Close Folder.
See also:
- Closing DevTools in Opening DevTools and the DevTools browser.
You've finished the tutorial "Get started by clicking the Launch Instance button". It's recommended that you also do the other tutorials; see Get started using the DevTools extension for Visual Studio Code.
See also
GitHub:
- demo-to-do - the demo web app running on the
github.ioserver. - Source code for demo-to-do
- MicrosoftEdge / Demos repo.