Note
Access to this page requires authorization. You can try signing in or changing directories.
Access to this page requires authorization. You can try changing directories.
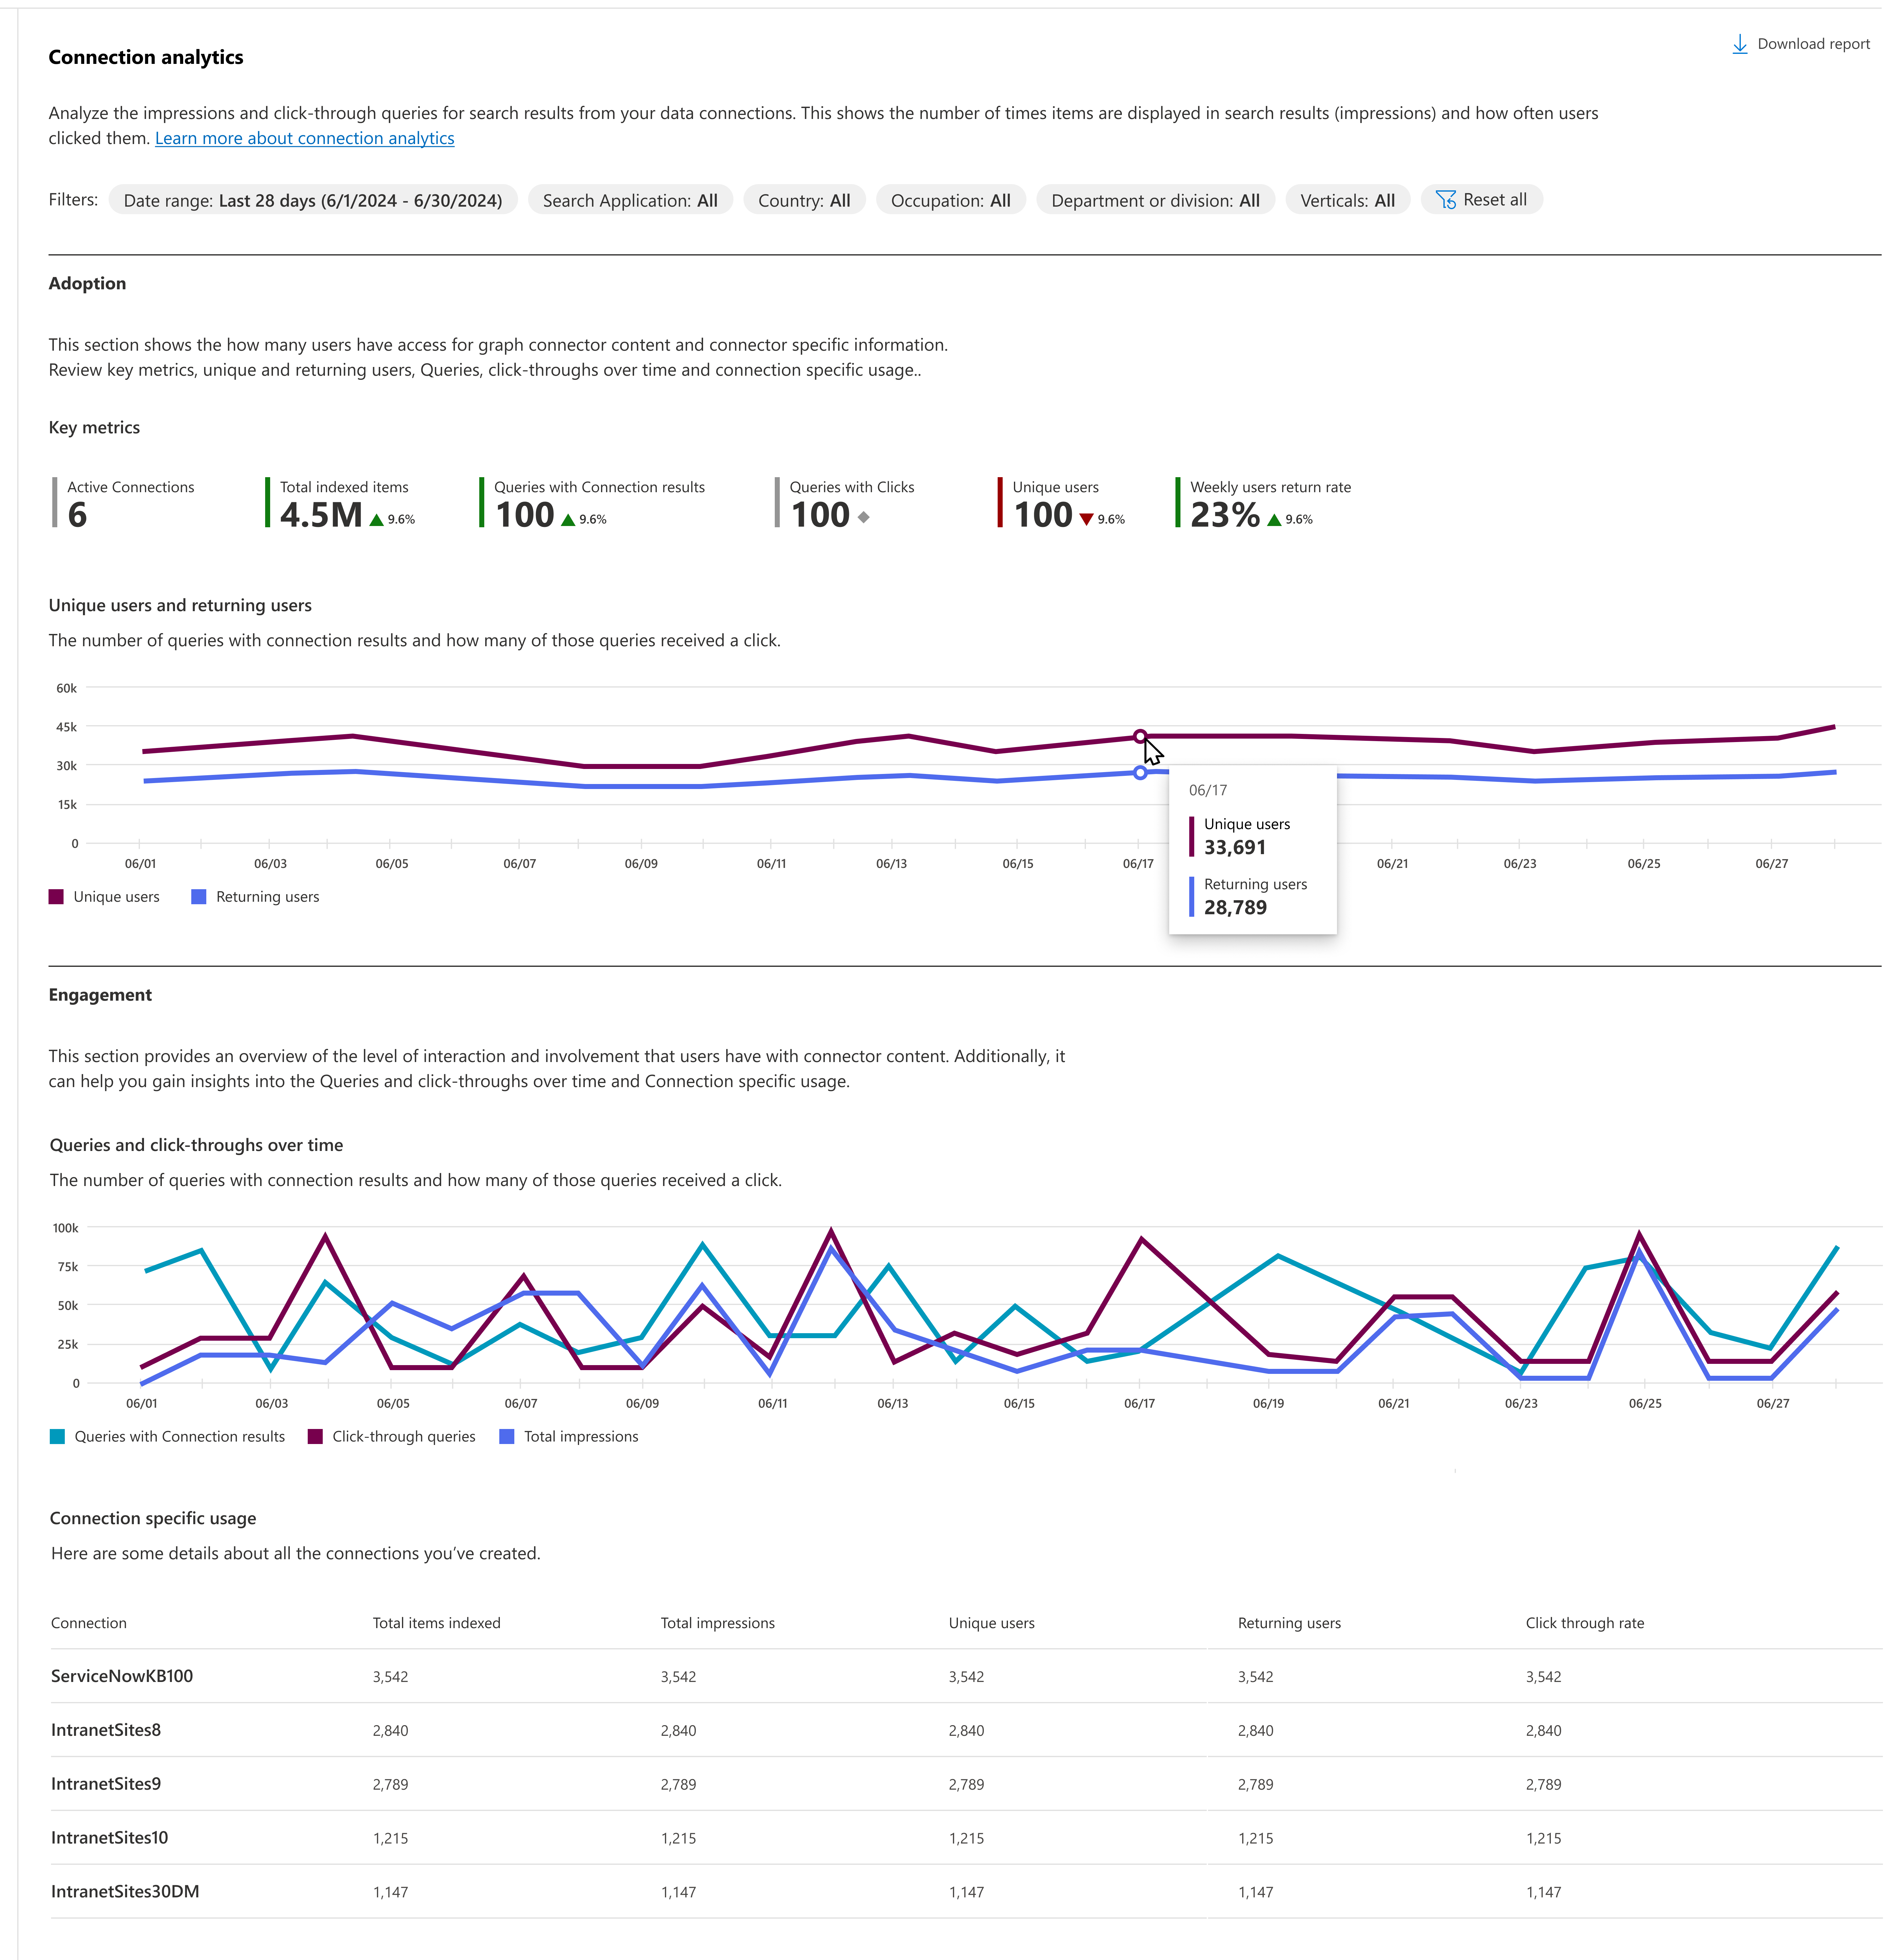
In the Microsoft Search usage report, the connection analytics section provides an overview of the Copilot connector usage in your organization. It highlights metrics about how often users search for third-party content and engage with it.
The data above the chart shows changes over the selected period for the following metrics:
| Metric | Description |
|---|---|
| Active connection | The number of connections that are currently active. |
| Total indexed items | Total number of indexed items across all connections. |
| Queries with connection results | Number of queries that included one or more connection results. |
| Click-through queries | Number of queries where the user has clicked on one or more of the connection results. |
| Unique users | Number of users who query at least once for Copilot connectors. |
| Return rate | Unique users who have searched for the connector at least once or more in the 7-day period. |
Queries and queries with clicks
The graph below shows the number of queries with connection results and how many of those queries received a click. See the definitions below:
- Queries The number of queries that a connector results in.
- Queries with clicks How many of the queries with connector results received a click.
You can select the Download report link to download the report as an Excel file and see more details.
You can view the Connection Analytics details page by selecting the Connection analytics tab or selecting the View connection analytics button at the bottom of the Connection analytics section of the Usage analytics main page.
Connection analytics details page
The Connection analytics details page allows you to analyze queries with search results from your connections.
In the Filters menu, use one or more of the following to filter the data in the reports:
| Filter | Description |
|---|---|
| Date range | The date range for the analytics shown on the page. Available options are Last 28 days and Last 12 months. |
| Search application | The search application where the user has performed the queries: SharePoint start page, SharePoint sites, Microsoft 365, Microsoft 365 Copilot, or all applications combined. |
| Country | The country of the user performing the query based on their country attribute in Microsoft Entra ID. |
| Occupation | The occupation of the user performing the query based on their title attribute in Microsoft Entra ID. |
| Department or division | The department or division of the user performing the query, based on the department attribute of the second top-level user in the management chain of the user performing the search in Microsoft Entra ID. |
The Connection analytics details page contains the following reports:
- Unique users and weekly returning users
- Queries and queries with clicks over time
- Connection-specific usage
- Top 10 keywords
Unique users and weekly returning users
The chart below displays two key metrics: the number of unique users who queried for the connector at least once in the past 30 days and the return rate for those users over the last 7 days. This data can help you assess user engagement and retention patterns during this recent period.
Connection-specific usage
This report shows the details (Connection name, total items indexed, total impressions, unique users, and click-through rate) for all the connections that have been created. It shows the number of items indexed and how many times users are seeing that connector content. It also tells the number of unique users, which indicates whether your audience is expanding over time, and if the content is even useful to them by the click-through rate.
Top 10 keywords
This report shows the details of the top keywords which was searched for the most and the corresponding queries for the keywords. It also shows where these results are coming from.
- Total queries indicates the number of queries where the mentioned keyword was used.
- Total impressions indicates the number of times users were shown results from the connector.
- Connector Refers to the connectors from which we got this information.
Download reports
Each report and table has a download option that allows you to download the background data for the report that you see on the screen in an Excel format. Where the displayed report is limited to the top five to ten rows, the downloaded report has up to 2000 top records.
Downloading a report allows you to see reports from a broader range of time. The report is downloaded as an Excel spreadsheet based on the selected date filter. If you chose the past 28 days, the spreadsheet would have an individual tab for each day. The past 12 months' download has a tab for each month.
Prevent filtering by country, occupation, department, or division
By default, users with search administrator and search editor roles can filter search data by country, occupation, or department/division. If you don't want administrators to filter your report data using these dimensions, you can go into your organizational settings in the Microsoft 365 admin center and configure this setting. When this setting is unchecked, administrators won't be able to filter the Connection analytics details reports by these filters.
Only global administrators can configure this setting.
To configure this setting:
- In the Microsoft 365 admin center, select Settings, then select Org Settings.
- On the Org Setting page, select Search & intelligence usage analytics.
- On the Search & intelligence usage analytics page, uncheck Allow usage reports to be filtered by country, occupation, department, or division.
- Select Save.
Related articles
Microsoft Search Usage Report
Microsoft Search Usage Report - Queries
Microsoft Search Usage Report - Users
Microsoft Search Usage Report - Answer analytics
View search usage reports in modern sites


