Note
Access to this page requires authorization. You can try signing in or changing directories.
Access to this page requires authorization. You can try changing directories.
In the Microsoft Search Usage Report, the User analytics section shows how people in your organization use Microsoft Search and allows you to compare user engagement and adoption across the search applications and time periods. The charts are presented for the filters selected on the top of the page.

The key metrics show you a quick summary of how people are using search in your organization. The data shows metrics and changes from the previous period for the following metrics:
| Filter | Description |
|---|---|
| Users who searched | The total number of users who searched at least once in the selected period. |
| Users who searched weekly | The average of users who searched at least once in a 7-day period and searched at least once in the previous 7-day period. |
| Users not searching | The total number of users who visited an application that offers Microsoft Search without performing any searches in the selected period. |
The color of the bar and the trend indicator show the trend compared to the previous period. For example, if the 28-day filter is selected, it compares the current 28-day period data to the previous 28-day period data. In the case of a downward trend, the arrow and the line are shown in red. In the case of an upward trend, it appears in green. Trend data isn't available for a 12-month view.
The users who searched, users who searched weekly, and users not searching trend graph shows activity over time for the key metrics in the table. Notice that this graph might be represented by weekly bar graphs instead of line graphs based on the search activity in the tenant.
Note
The 12-month view shows average metrics for all graphs except the trend graph which can represent a good baseline to compare with the current metrics and identify areas with better or worse usage than average.
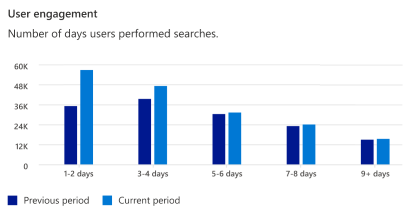
User engagement
The user engagement graph shows how many unique days people performed searches for the selected set of filters. The two bars compare the number of users in this period with the previous period. A high number of users in the 9+ days category represents a higher search engagement in the organization. Use the Search application filter to analyze user engagement for different search applications.
Search users by application
The search users by application graph shows how many users searched one or more times for each search application. The two bars compare the number of users that used search in this period with the previous period. Use the Search application filter to understand the user engagement for each search application.

For details on the search applications that are included in these usage reports, see Search Application Coverage.
User analytics detail pages
The User analytics details page shows how people in your organization use Microsoft Search, measured by the filters you select. These filters include:
| Filter | Description |
|---|---|
| Date range | The date range for the analytics shown on the page. The available options are Last 28 days, and Last 12 months. |
| Search application | The search application where the user performed the queries: Windows Search Work results, Outlook, Teams, OneDrive, Word/Excel/Powerpoint, SharePoint start page, SharePoint sites, Microsoft365.com, or all applications combined. |
| Country | The country of the user performing query based on their country attribute in Microsoft Entra ID. |
| Occupation | The occupation of the user performing the query based on their title attribute in Microsoft Entra ID. |
| Department or division | The department or division of the user performing the query, based on the department attribute of the second top-level user in the management chain of the user performing the search in Microsoft Entra ID. |
Note
To protect privacy, if the selected filter combination results in queries that are performed by only five or fewer individuals, those results will not be included in any report.
You can view the User details page by selecting the User analytics tab or selecting the View user analytics button at the bottom of the User analytics section of the Usage analytics main page.
In addition to the user analytics graphs shown on the summary page, the user details page contains the following charts:
- Search users by geography
- Top 10 search users by occupation
- Top 10 search users by department or division
Search users by geography
The Search users by geography chart shows you a distribution of search users based on their country attribute in Microsoft Entra ID and for the selected set of filters.

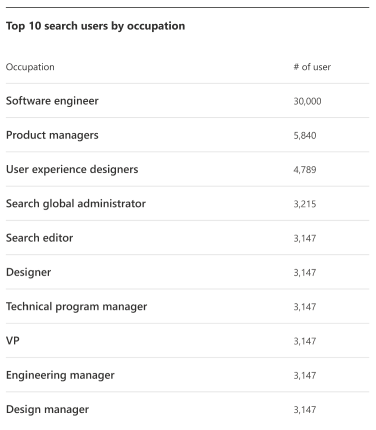
Top 10 search users by occupation
The Top 10 search users by occupation chart shows top you a distribution of search users based on their title attribute in Microsoft Entra ID and for the selected set of filters. Due to computational complexity, only the top 100 occupations are included in this list which means that some filter combinations might produce an empty list of occupations.
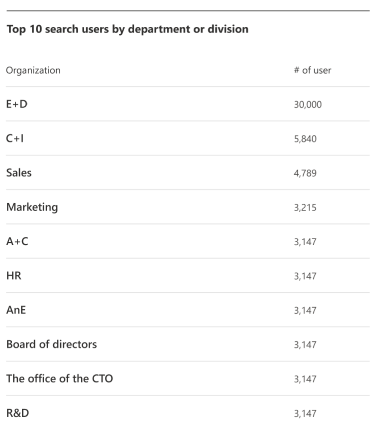
Top 10 search users by department or division
The Top 10 search users by department or division chart shows top you a distribution of search users based on the department attribute of the second top-level user in the management chain of the user performing the search in Microsoft Entra ID and for the selected set of filters.
User analytics – See what actions you can take
The User analytics section shows how people in your organization use Microsoft Search and allows you to compare user engagement and adoption across the search applications and time periods. Use the graphs to:
Validate key metrics for users who searched, users searching weekly and users with no search activity. What is the potential in increasing users searching weekly and addressing users with no search activity?
Check the user engagement. Is it as expected?
Check the distribution of search activity across all search applications. Where do you have gaps in search adoption?
Visit the user analytics detail page for more insights and use the filters to identify adoption gaps. What search application, region or department are lagging in search adoption? Would awareness or training help?
By monitoring user adoption and addressing adoption gaps, you can optimize the value that search is bringing to each individual and the entire organization.
Accessing search data prior to the start of new generation reports
Processing of the new search user reports varies for different tenants. If you select a date range before the date processing started, for example by selecting the 12 month date range, you might see a message stating Data not available for entire time period selected. To view data prior to this date, you need to use the previous user analytics reports.
To view the previous search analytics reports, select the New user analytics toggle on the top right corner of the page.
Prevent filtering by country, occupation, department, or division
By default, users with search administrator and search editor roles can filter search data by country, occupation, or department/division. If you do not want administrators to filter your report data using these dimensions, you can go into your organizational settings in the Microsoft 365 admin center and configure this setting. When this setting is unchecked, administrators can't filter the Query details reports by these filters.
Only global administrators can configure this setting.
To configure this setting:
In the Microsoft 365 admin center, select Settings, then select Org Settings.
On the Org Setting page, select Search & intelligence usage analytics.
On the Search & intelligence usage analytics page, uncheck Allow usage reports to be filtered by country, occupation, department, or division.
Select Save.
Related Topics
Microsoft Search Usage Report
Microsoft Search Usage Report - Queries
Microsoft Search Usage Report - Connection analytics
Microsoft Search Usage Report - Answer analytics
View search usage reports in modern sites