Note
Access to this page requires authorization. You can try signing in or changing directories.
Access to this page requires authorization. You can try changing directories.
Microsoft Call Quality Dashboard (CQD) uses a near-real-time (NRT) data feed. Call records are typically available in CQD within 30 minutes of the end of a call and remain in CQD for 12 months, except for end user identifiable information (EUII) fields, which are removed after 28 days. In rare cases, some calls may take longer than 30 minutes to appear in CQD.
Many ways to access call quality data
You can access call quality data by several different avenues. Pick the one that best meets your needs:
| Resource | Description |
|---|---|
| CQD in Power BI | Use direct queries to view your CQD data in Power BI using customizable Power BI templates and the CQD Quality of Experience Report (QER). The CQD Power BI templates are regularly updated to support new Teams features, calling scenarios, and the latest telemetry we have available in CQD. |
| Teams admin center (https://admin.teams.microsoft.com) | Call quality data is included on the Users page in the Teams admin center, showing the most common data you need in an easy-to-read format. You can't customize the data that you find under Users. |
| CQD portal (https://cqd.teams.microsoft.com) | Robust summary and detailed reports that meet most needs, with drill-through filtering. You can also customize reports in the CQD portal. Get two CQD report templates to help you analyze data in the CQD portal. |
| Graph API | Access raw call quality data yourself using the Graph API. Using Graph API is the most complex method, but it gives you the most control and flexibility in analyzing your call quality data. For example, if you need to join it with other data for your organization, you can use the Graph API to create a data model and incorporate call quality data. CallRecords Graph API might not contain all of the fields that are available in CQD and naming conventions might differ between the two products. |
Import the CQD report templates
Download two curated CQD report templates (All Networks and Managed Networks) to help you get up to speed quickly with CQD on the web. The All Networks template, though optimized to work with a building data file, can be used while you work toward collecting and uploading building information into CQD, as described in the next section.
To import the templates (.CQDX) into CQD:
In CQD, select Detailed Reports from the menu at the top of the page.
In the left panel, select Import. Browse to the first CQDX template and select Open.
After the template is uploaded, a pop-up window will display the message "Report import was successful."
Repeat steps 2 and 3 for the second CQD template.
Note
Templates and saved reports are unique for each admin that logs into CQD. Each user must follow the steps to import the CQD templates if they wish to use them.
For the best experience with using CQD, we recommend using the latest QER experience in Power BI instead.
EUII data
Caution
As of late-March 2025, permissions for location sharing in Microsoft Teams changed. Users must now consent to sharing their location with Microsoft Teams using individual toggles for the purposes of Emergency calls and Insights for IT admins. If users in your tenant deny sharing their location except for emergencies, CQD can't provide admins with the BSSID of the client endpoint. Quality and reliability troubleshooting tasks that rely on BSSID—such as deep analysis of issues involving wireless networks—will become more difficult and potentially less accurate as fewer clients will report them.
On fully managed devices, the operating system controls location sharing. It turns location sharing on by default and allows users to turn it off only through the system’s location setting. On non-fully managed devices, Teams users must choose between Allow all and Keep emergency only. In the Teams client, this setting can be changed by your users in Settings > Privacy > Location > Insights for IT admins.
For compliance reasons, EUII data (also known as personally-identifiable information or PII) is only kept for 28 days. As CQD's data crosses the 28-day mark, fields that contain EUII are cleared, resulting in EUII-free data. Fields that contain EUII data are:
- IP Address
- User ObjectId
- MAC Address
- Sip Uri (Skype for Business only)
- Phone Number
- UPN
- Feedback Text
- Client Endpoint Name
- Local Address
- Remote Address
- Base Address
- BSSID
- Local Site
- Remote Site
- Auto Attendant Identity
- Call Queue Identity
- Transferred from Call Queue Identity
- Organizer ObjectId
- Organizer UPN
- Organizer Sip Uri (Skype for Business only)
- VTC Device Name
- VTC Device Detail
Admin roles with and without EUII access
These RBAC roles DO have EUII access:
- Teams Service Admin
- Teams Communications Admin
- Teams Communications Support Engineer
- Skype for Business Admin
- Global Reader
- Global Admin
Important
Microsoft recommends that you use roles with the fewest permissions. This helps improve security for your organization. Global Administrator is a highly privileged role that should be limited to emergency scenarios when you can't use an existing role. To learn more, see About Admin roles in the Microsoft 365 admin center.
These RBAC roles DON'T have EUII access:
- Reports Reader
- Teams Communications Support Specialist
Note
Users assigned to one or more Administrative Units won't see end-user identifying information (EUII) even if their role would ordinarily allow it.
Date controls
CQD supports the following Rolling Trend types:
- 5-day
- 7-day
- 30-day
- 60-day
- 90-day
The URL Date parameter accepts a Day field. Rolling-day reports use dates specified in the YYYY-MM-DD format as the last day of the trend. The URL Date parameter "00" indicates "today."
| URL | End date of Rolling Day Trend |
|---|---|
| https://<cqdv3>/spd/#/Dashboard/<reportid>/2019-02/ | Current Day of Feb 2019 |
| https://<cqdv3>/spd/#/Dashboard/<reportid>/2019-02-15/ | Feb 15, 2019 |
| https://<cqdv3>/spd/#/Dashboard/<reportid>/00/ | Current Day |
By default, the current day of the month is used as the last day of the Rolling Day Trend.
Data available in CQD reports
The default summary and detailed CQD reports may be all you need to manage call quality for your org. If you need to, you can create custom reports.
If you want to use Power BI to analyze your CQD data, read Use Power BI to analyze CQD data for Teams.
| Feature | Summary Reports | Detailed Reports |
|---|---|---|
| Application sharing metric | No | Yes |
| Customer building information support | Yes | Yes |
| Customer endpoint information support | Only in cqd.teams.cloud.microsoft | Only in cqd.teams.cloud.microsoft |
| Drill down analysis support | No | Yes |
| Media reliability metrics | No | Yes |
| Out-of-the-box reports | Yes | Yes |
| Overview reports | Yes | Yes |
| Per-user report set | No | Yes |
| Report set customization (add, delete, modify reports) | No | Yes |
| Video-based screen sharing metrics | No | Yes |
| Video metrics | No | Yes |
| Amount of data available | Last 12 months | Last 12 months |
| Microsoft Teams data | Yes | Yes |
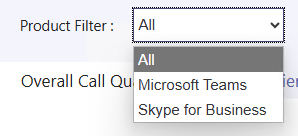
Select product data to see in reports
In the Summary and Location-Enhanced Reports, you can use the Product Filter drop-down to show all product data, only Microsoft Teams data, or only Skype for Business data.
In Detailed reports, you can use the Is Teams dimension to filter the data to Microsoft Teams or Skype for Business data.
Summary Reports
These are the reports that you'll see on the CQD Dashboard when you first sign in to CQD. They give you an at-a-glance look at quality trends with daily, monthly, and table reports to assist with identifying subnets that have poor quality.
| Tab | Description |
|---|---|
| Overall Call Quality | Aggregate of the other three tabs. |
| Server—Client | Details of the streams between server and client endpoints. |
| Client—Client | Details of the streams between two client endpoints. |
| Voice Quality SLA | Info about calls included in the Skype for Business voice quality SLA. |
Overall Call Quality tab
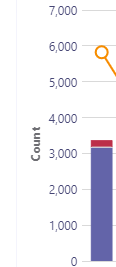
Use the data on this tab to evaluate call quality status and trends based on stream counts and poor percentages. The legend in the upper-right corner shows which color and visual elements represent these metrics.
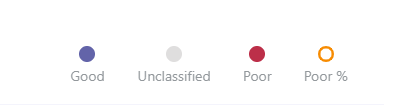
Streams are classified in three groups: Good, Poor, and Unclassified. There are also calculated Poor % values that give you the ratio of streams classified as Poor to the total classified stream count. Since Poor % = Poor streams/(Poor streams+ Good streams) * 100, the Poor % is unaffected by the presence of multiple Unclassified streams. To see what classifies a stream as poor or good, refer to Stream Classification in Call Quality Dashboard.
Use the scale on the left to measure the stream count values.
Use the scale on the right to measure the Poor % values.
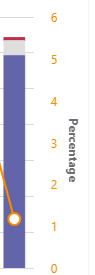
You can also obtain the actual numerical values by hovering the mouse over a bar.
Note
The following example is from a very small sample data set, and the values aren't realistic for an actual deployment.
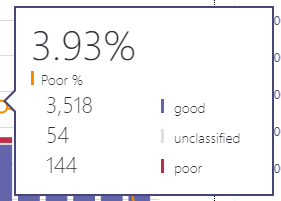
The overall stream volume helps determine how relevant the calculated Poor percentages are. The smaller the volume of overall streams, the less reliable the reported Poor percentage values are.
Server-Client tab and Client-Client tabs
These two tabs provide details for the streams that took place in their endpoint-to-endpoint scenarios. The Server-Client tab has four collapsible sections that represent four scenarios under which media streams would flow.
- Wired Inside
- Wired Outside
- WiFi Inside
- WiFi Outside
Similarly, the Client-Client tab has five collapsible sections:
- Wired Inside — Wired Inside
- Wired Inside — Wired Outside
- Wired Outside — Wired Outside
- Wired Inside — WiFi Inside
- Wired Inside — WiFi Outside
Inside versus Outside
CQD classifies a stream as Inside or Outside using Building information, if it exists. Endpoints of each stream are associated with a subnet address. If the subnet appears in the list of subnets marked InsideCorp in the uploaded building information, it's considered Inside. If building information isn’t uploaded, Inside Test always classifies the streams as Outside.
The Inside Test for a Server-Client scenario only considers the client endpoint. Because servers are always outside from a user's perspective, this isn't accounted for in the test.
Wired versus WiFi
As the names indicate, the classification criteria is based on the type of client connections. Server is always wired and it isn't included in the calculation. In a given stream, if one of the two endpoints is connected to a WiFi network, then CQD classifies it as WiFi.
Note
Given a stream, if one of the two endpoints connects to a WiFi network, CQD classifies it as WiFi.
Tenant Data information
The CQD Summary Reports dashboard includes a Tenant Data Upload page, accessed by selecting Tenant Data Upload from the settings menu in the top-right corner. This page is used for admins to upload their own information, such as:
- A map of IP address and geographical information.
- A map of Endpoint to Endpoint Make/Model/Type, etc.
We recommend that you upload your tenant, building, and location data so CQD can include this information in your reports. If you haven't already uploaded this data, read Upload tenant and building data.
Detailed reports
| Name | Description |
|---|---|
| Location-Enhanced Reports | Shows quality trends based on location information. This report appears only if you've uploaded your tenant data. |
| Reliability Reports | Includes audio, video, video-based screen sharing (VBSS), and app sharing reports. |
| Quality of Experience Reports | Audio quality and reliability for all clients and devices, including meeting rooms. These reports are a "slimmed-down" version of the downloadable CQD templates, focusing on key areas for analyzing audio quality and reliability. |
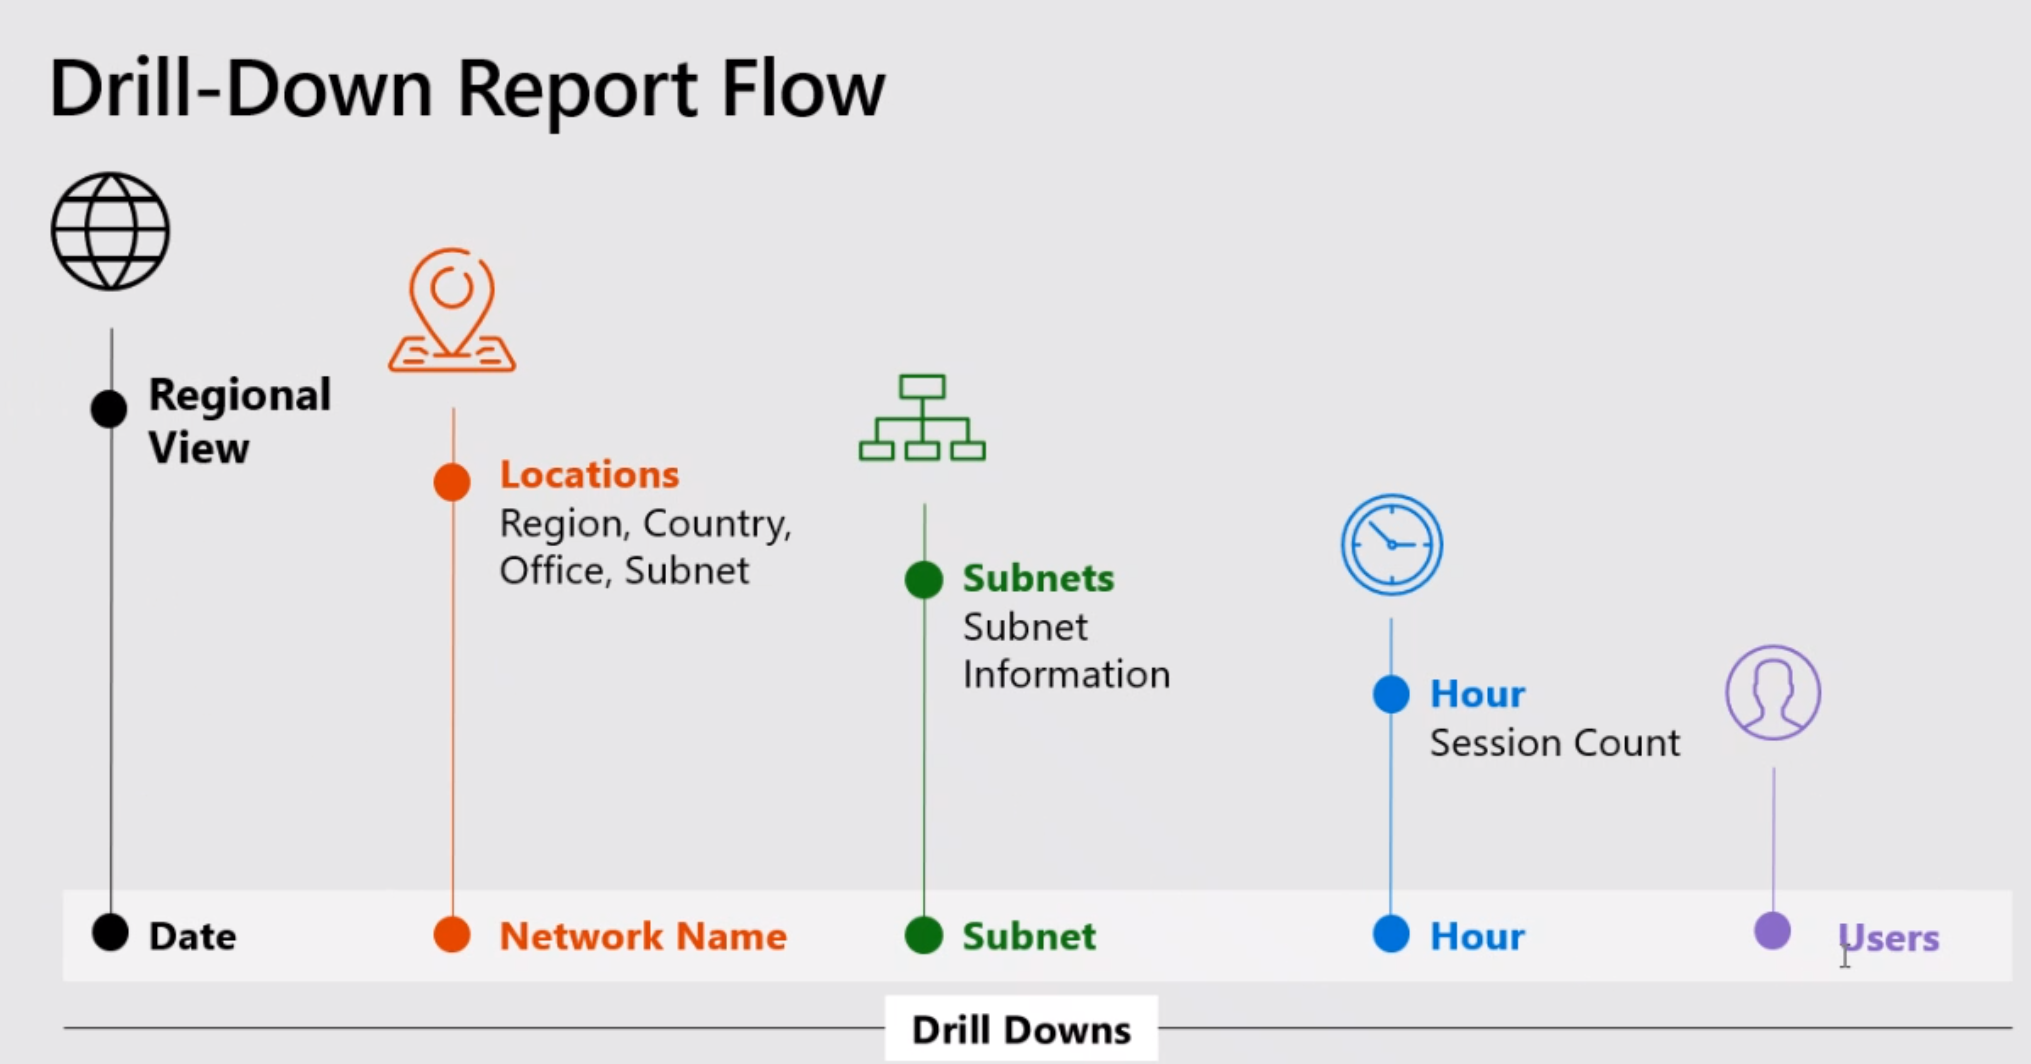
| Quality Drill Down Reports | Drill downs: Date by region, locations, subnets, hour, and users. |
| Failure Drill Down Reports | Drill downs: Date by region, locations, subnets, hour, and users. |
| Rate My Call Reports | Analyze user call ratings by region, location, or by user. Includes verbatim feedback. |
| Help Desk Reports | Help Desk Reports look at call and meeting data for individual users, groups of users, or everyone. Incorporating building and EUII data, these reports help identify possible system issues based on network location, conference details, devices, or firmware. |
| Client Version Reports | Client Version Summary: View the Sessions and Users counts for each client app version Client Version by User: View user names for each client app version Prebuilt filters for Product and Client Type help focus the versions to specific clients. |
| Endpoint Reports | Shows call quality by machine endpoints (computer make and model). These reports include building data, if you've uploaded it. |
Create custom detailed reports
If the default CQD reports don't meet your needs, use these instructions to create a custom report. Or Use Power BI for CQD reports instead.
From the pull-down list of reports at the top of the screen displayed at login (the Summary Reports screen) Select Detailed Reports and then New. Select Edit in a report to see the Query Editor. Each report is backed by a query into the cube. A report is a visualization of the data returned by its query. The Query Editor helps you edit these queries and the display options of the report.
Important
The network range can be used to represent a supernet (combination of several subnets with a single routing prefix). All new building uploads are checked for any overlapping ranges. If you previously uploaded a building file, download the current file and re-upload it to identify overlaps and fix the issue before uploading again. Any overlap in previously uploaded files may result in the wrong mappings of subnets to buildings in the reports. Certain VPN implementations don't accurately report the subnet information. When you add a VPN subnet to the building file, add a separate 32-bit network entry for each address instead of a single entry for the whole VPN subnet. Each row can have the same building metadata. For example, instead of one row for 172.16.18.0/24, you should have 256 rows, with one row for each address between 172.16.18.0/32 and 172.16.18.255/32, inclusive.
The VPN column is optional and defaults to 0. If the VPN column's value is set to 1, the subnet represented by that row is fully expanded to match all IP addresses within the subnet. Use this sparingly and only for VPN subnets since fully expanding these subnets has a negative impact on query times for queries involving building data.
Point to bar charts and trend lines in the report to display detailed values. The report in focus shows the action menu: Edit, Clone, Delete, Download, and Export Report Tree.
Query filters
Query filters are implemented by using the Query Editor in CQD. These filters are used to reduce the number of records returned by CQD, thus minimizing the report's overall size and query times. Query filters are especially useful for filtering out unmanaged networks. The filters listed in the following table use regular expressions (RegEx).
| Filter | Description | CQD query filter example |
|---|---|---|
| No blank values | Some filters don't have the option to filter for blank values. To filter blank values manually, use the blank expression and set the filter to Equals or Not Equals, depending on your needs. | Second Building Name <> ^\s*$ |
| Exclude common subnets | Without a valid building file to separate managed from unmanaged networks, home networks are included in the reports. These home subnets are outside the scope of IT's control and can be quickly excluded from a report. Common subnets, as defined in this guide, are 10.0.0.0, 192.168.1.0 and 192.168.0.0. | Second Subnet <> 10.0.0.0 |192.168.0.0 |192.168.1.0 |
| View inside only | Used to filter a report for managed (inside) or unmanaged (outside). The managed CQD template is already preconfigured with these filters. | Second Inside Corp = Inside |
Report filters
Use CQD report filters to narrow the focus of your investigations. Use report filters by adding a filter to the rendered report either in the Query Editor or directly in the report. The following report filters are used throughout the CQD templates.
| Filter | Description | CQD report filter example |
|---|---|---|
| Month | Start with the year first, then month. | 2017-10 |
| Alphabetic | Filters for any alphabetic characters. | [a-z] |
| Numeric | Filters for any numeric characters. | [0-9] |
| Percentage | Filters for a percentage. | ([3-9]\.)|([3-9])|([1-9][0-9]) |
Drill-down filters
CQD reports feature several drill-down filters, which are powerful tools for narrowing the focus of your call-quality investigations. If you select a drill-down field, the report automatically opens the appropriate tab and filters on the selected value. If that tab has its own drill-down fields and one is selected, both sets of filters are applied, progressively narrowing the resulting data set.
Multi-select filters
In addition to drill-down functionality, CQD also supports specifying Filters with multiple values (OR filters).
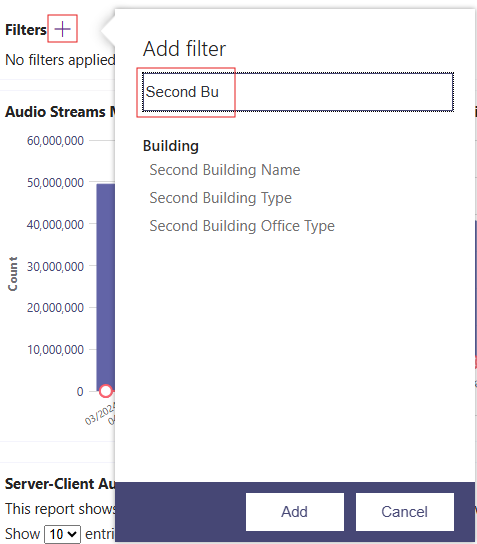
In order to select multiple filter values, begin by adding a new filter to the report. Select + beside the Filters label, enter the name of the Dimension you want to use, and select Add.
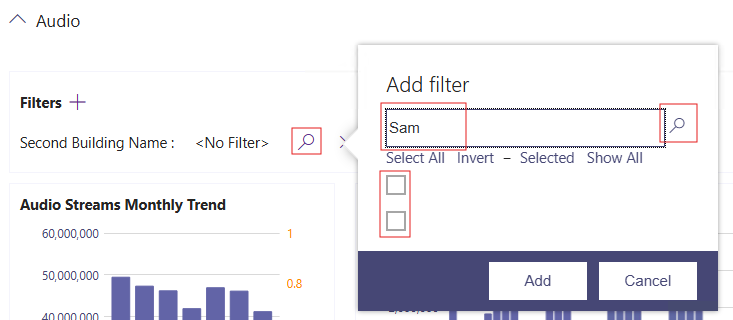
Then, select Search (a magnifying glass icon next to the new filter). CQD displays a text field and a number of options, including Select All and Invert. Enter a value, and select Search next to that field to search. Alternatively, leave the text field empty and select Search to view up to the first 100 options.
/filter/[AllStreams].[Second Tenant Id]\|[YOUR TENANT ID HERE]
Example:
Dashboard level filters
Certain CQD reports have dashboard-level filters added to them, making it easy to filter by common parameters. These filters appear outside the regular report tabs and directly beneath the Product filter, and they apply to all filters in the Dashboard.
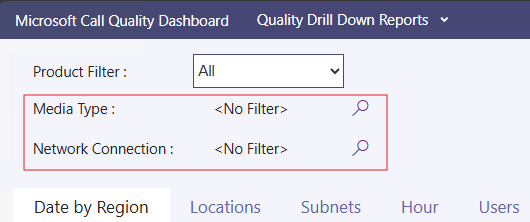
/filter/[AllStreams].[Is Teams]|[TRUE | FALSE]
URL filters
CQD supports adding filters to the URL. These URL filters make it easy to share or bookmark a CQD query. You can define parameters in the URL, such as Trending Month, tenant ID, or language. You can also add Product or Dashboard level filters to the URL. Excluding federated data from CQD reports is useful when you're remediating managed buildings or networks where federated endpoints might influence your reports.
To add a filter, append the following to the end of the URL:
/filter/[AllStreams].[Second Tenant Id]\|[YOUR TENANT ID HERE]
Example:
https://cqd.teams.microsoft.com/cqd/#/1234567/2018-08/filter/[AllStreams].[Second Tenant Id]|[TENANTID]
To add a Dashboard-level filter to a URL, that filter must exist in CQD as either a Product or Dashboard level filter. Add these filters to the URL after the Trending Month and before the URL parameters:
filter/DATA_MODEL_NAME|VALUE
For example, to apply a Product filter value of Microsoft Teams, you'd add the following information:
filter/[AllStreams].[Is%20Teams]|[True]
Your entire URL would look something like this:
https://cqd.teams.microsoft.com/spd/#/Dashboard/2624085/2018-9/filter/[AllStreams].[Is%20Teams]|[True]
To apply URL filters with multi-select values, separate each value with a pipe ( | ) character. For example:
filter/[AllStreams].[Media%20Type]|[Video]|[Audio]|[VBSS]
If you specify an invalid name or value, the URL filter isn't applied.
You can use a URL filter to filter every report for a specific dimension. The most common URL filters are used to filter reports to exclude federated participant telemetry, or focus on only Teams or Skype for Business. Excluding federated data from CQD reports is useful when you're remediating managed buildings or networks where federated endpoints might influence your reports.
| Filter | Description | CQD query filter example |
|---|---|---|
| No blank values | Some filters have no option to filter for blank values. To filter blank values manually, use the blank expression and set the filter to Equals or Not Equals, depending on your needs. | Second Building Name <> ^\s*$ |
| Exclude common subnets | Without a valid building file to separate managed from unmanaged networks, home networks are included in the reports. These home subnets are outside the scope of IT's control and can be quickly excluded from a report. Common subnets, as defined in this article, are 10.0.0.0, 192.168.1.0 and 192.168.0.0. | Second Subnet <> 10.0.0.0 |192.168.0.0 |192.168.1.0 |
| View inside only | Used to filter a report for managed (inside) or unmanaged (outside). The managed CQD template is already preconfigured with these filters. | Second Inside Corp = Inside |
How to find your tenant ID
The tenant ID in CQD corresponds to the Directory ID in Azure. If you don't know your Directory ID, you can find it in the Azure portal:
Sign in to the Microsoft Azure portal: https://portal.azure.com
Select Microsoft Entra ID.
Under Manage, select Properties. Your tenant ID is in the Directory ID box.
You can also find your tenant ID by using PowerShell:
Login-AzureRmAccount
Comparing Teams and Skype for Business CQD data
When reviewing your data, you may see differences in data between Teams and Skype for Business. Some reasons:
- Differences in the mechanisms for ensuring performance and reliability:
- Teams has auto-reconnect and fast roaming. Skype for Business doesn't.
- Teams has dynamic bandwidth management. Skype for Business doesn't.
- Differences in IP address ranges between Teams and Skype for Business. The Teams IP ranges are newer, which could cause connectivity problems at the firewall.
Related topics
Improve and monitor call quality for Teams
Set up Call Quality Dashboard (CQD)
Upload tenant and building data
Use CQD to manage call and meeting quality