Note
Access to this page requires authorization. You can try signing in or changing directories.
Access to this page requires authorization. You can try changing directories.
Before you can use the Power BI query templates (PBIX files) for Microsoft Teams Call Quality Dashboard (CQD), you need to install the Microsoft Call Quality connector for Power BI, using the MicrosoftCallQuality.pqx file included in the download.
Read Use Power BI to analyze CQD data for Teams to learn about these templates.
Make sure you have the right CQD access role to access the Power BI reports.
Note
The Microsoft Call Quality connector only supports DirectQuery in Power BI; Import mode isn't supported.
Installation
The process for installing a custom connector and adjusting security to enable use of the connector is described in detail in the Power BI documentation. For the sake of simplicity, here's a quick explanation:
Check to see if your computer already has a [Documents]\Power BI Desktop\Custom Connectors folder. If not, create this folder.1
Download the connector file (either a *.mez or *.pqx file) and place it in the Custom Connectors directory.
If the connector file is a *.mez file, you also need to adjust your security settings as described in the custom connector setup documentation.
If a new version of the Microsoft Call Quality connector is released, replace the old connector file in the Custom Connectors directory with the new file.
Customers in Government cloud environments (GCC, GCC-H, DoD) need to install the connector with an on-premises data gateway for compatibility with Power BI Service. Without an on-premises gateway, Government cloud customers can only use Microsoft Call Quality connector in Power BI Desktop.
Setup
To build a report and run queries, you first need to connect to the CQD data source. In order to connect, perform the following steps:
In the Home tab of Power BI Desktop, select Get Data.
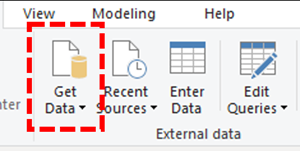
The Get Data window should appear at this point. Navigate to Online Services, then select Microsoft Call Quality (Beta) and select Connect.

In the sign-in prompt, use the same credentials that you use for Call Quality Dashboard.2
The next prompt gives you the option between two Data Connectivity modes. Select DirectQuery, then select OK.
The final prompt shows you the entire data model for Call Quality Dashboard. No data is visible at this point, only the data model for CQD. Select Load to complete the setup process.
At this point, Power BI loads the data model onto the right side of the window. The page remains otherwise blank, and no queries are loaded by default. In order to build a query and return data, see Building Queries.
If any of the steps during this setup process aren't clear, you can find a more detailed explanation of the process in Quickstart: Connect to data in Power BI Desktop.
Building Queries
Once setup is complete, you should see the names of several hundred dimensions and measures load in the Fields pane. Constructing actual queries from here's simple, just select the dimensions and measures you want for your query, then drag and drop them onto the page. Here's a more detailed explanation, with a simple example:
Select the visualization you want to use from the Visualizations pane. A blank version of that visualization should appear on the page. For the purposes of this example, we're using the Table visualization.
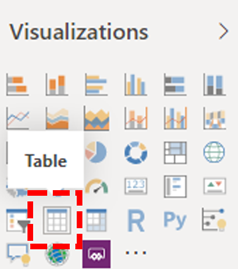
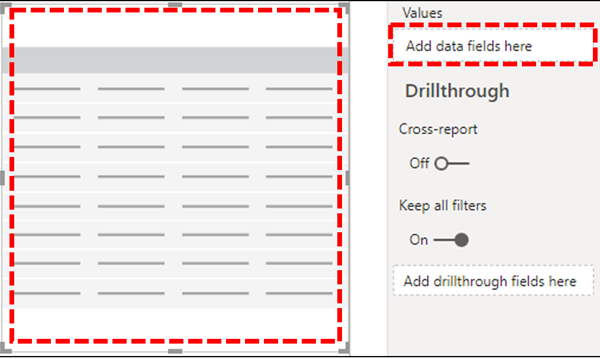
Determine which dimensions and measures (denoted by an aggregation symbol by their name) you wish to use for your query. Then, manually select these dimensions and measures and drag them onto the black visualization. Alternately, drag them onto the Values field beneath the visualization options.
Important
Call Quality Dashboard requires a measure for any query to run. Failure to add a measure to a query will cause that query to fail.
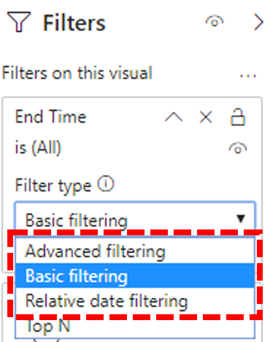
Next, select any dimensions you want to filter on and drag them to the Filters on this visual field in the Filters pane. The Microsoft Call Quality connector currently supports Basic filtering (select values from a list of possible dimension values), Advanced filtering (manually specify values and operands to filter on, similar to Call Quality Dashboard), and Relative date filtering (only available for the End Time and Start Time dimensions). Call Quality Dashboard doesn't support filtering according to Top N.
Important
Filters are only supported when applied to Dimensions. Filtering on the values of Measurements isn't supported in Call Quality Dashboard.
Finally, select the Format tab within the Visualizations pane to style and format your query.
Note
Call Quality Dashboard queries require at least one measure in order to run. If your query does not load, double check that you included a measure in the query.
Creating a Drillthrough Report
Drillthrough in Power BI allows you to create focused reports that you can quickly filter using the values of other reports as context. Once you know how to create your first query with the Microsoft Call Quality connector, creating a drillthrough is even simpler.
Create another page for the focused report, and then add your queries to that page.
Select the dimension you want to use as a drillthrough filter and drag them onto the Drillthrough field under on the Visualizations pane.
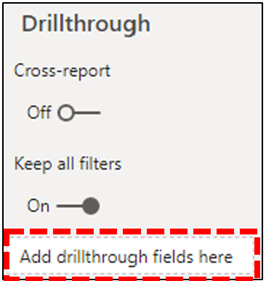
That's it! Any other query on another page that uses that dimension can now drill through to that page, automatically applying the drillthrough dimension's value as a filter.
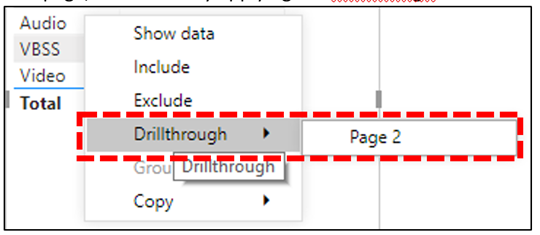
Unlike Call Quality Dashboard, Power BI supports non-sequential drillthrough. If a query includes the necessary dimension, it can drill through to any other page.
Best practice
You should design Microsoft Call Quality connector queries with drillthrough functionality in mind. Instead of trying to load all the data at once, and then slicing down with filters, start with broader, low-cardinality queries and drill down to high-cardinality queries. For instance, when attempting to diagnose which subnets contribute most to quality issues, it's helpful to first identify those regions and countries/regions that contribute to the problem, then drill down to the subnets in that region or country. The Call Quality connector templates are designed in this manner in order to act as an example.
Limitations
Not all Power BI functionality is support by the Microsoft Call Quality connector, either as a result of limitations on Call Quality Dashboard's data model or on DirectQuery connectors in general. The list below notes some of the Connector's more noteworthy limitations, but this list isn't exhaustive:
Calculated Columns – DirectQuery connectors in general have limited support for calculated columns in Power BI. Some calculated columns might work with the Connector, that those columns are exceptions. As a general rule, calculated columns don't function.
Aggregations – The Call Quality Dashboard data model is built on a cube model, meaning that aggregations are already supported in the form of measures. Attempting to manually add aggregations to different dimensions or changing the aggregation type of a measure doesn't work with the Connector, and it will generally result in an error.
Custom Visuals – While the Microsoft Call Quality connector does work with a range of custom visuals, we're unable to guarantee compatibility with all custom visuals. Many custom visuals rely on the use of calculated columns or imported data, neither of which is supported by DirectQuery connectors.
Referencing Cached Data – Power BI currently doesn't support referencing cached data from a DirectQuery connector in any way. Any attempt to reference the results of a query will create a new query.
Relative Data Filtering – Is supported in the Microsoft Call Quality connector, but only with the Start Time and End Time dimensions. Although the Date dimension might be the obvious choice for relative date filtering, Date isn't stored as a date time object and thus doesn't support relative date filtering in Power BI.
Dimension Only or Measurement Only Queries - Aren't supported at this time in the Microsoft Call Quality connector. If you create a visualization with three or more measurements and no dimensions, or three or more dimensions and no measurements, the column data will be transposed. Always include at least one dimension (for example, Month Year) and one measurement (for example, Total Call Count) in your visualizations.
Government Community Cloud (GCC, GCC-High, and DoD) Support – For customers in Government cloud environments, the Microsoft Call Quality connector can be used with an on-premises data gateway for compatibility with Power BI service. Simply follow the guide for installing custom connectors with an on-premises data gateway using the latest version of the Microsoft Call Quality connector to enable access. Additionally, an appropriate Power BI US Government license is required for government cloud. For more information on licensing, see the latest guidance for Power BI for US government customers.
Most of these issues are either restrictions to DirectQuery connector design in Power BI or fundamental to the design of the CQD data model.
Troubleshooting
I'm trying to use the Date column as a Date slicer. As soon as I convert the data type of this column to Date, I get this error
Couldn't load the data for this visual: OLE DB or ODBC error: [Expression.Error] We couldn't fold the expression to the data source. Please try a simpler expression.
Date slicers aren't supported with the Microsoft Call Quality connector. To specify a date range, apply two filters to the report, specifying a less than and greater than date.
Alternatively, if the dates you want to view are recent, apply a relative date filter to show only data for the last N days/weeks/months.
When I add certain dimensions to my reports, the visual immediately returns "Couldn't load the data for this visual". Removing the dimension fixes the visual--what is happening?
This is a known issue in the Microsoft Call Quality connector. Any dimension that's exposed as a whole number appears in Power BI as an "aggregate" column, where Power BI attempts a default summarize action (typically 'Sum'). In some cases, this behavior succeeds at summing up the values even though the result isn't useful, since the "sum" of a dimension like Second WiFi Channel is meaningless. In other cases, this summarize action fails and causes errors in the visual.
To work around this issue, start by removing the dimension from the visual. Select the dimension from the Fields list, browse to the Column tools tab in the ribbon, select the Summarization drop-down menu, and select Don't summarize. You can now add the dimension to the visual again.
Error Codes
Because the Microsoft Call Quality connector for Power BI is less restricted than the browser app in terms of kinds of queries you can construct, you might occasionally encounter errors while building your queries. If you receive an error message of the type "CQDError. RunQuery – Query Execution Error," reference the list below with the ErrorType number provided in order to troubleshoot the possible issue with the query. The following are the most common Error Type codes you might encounter with the CQD Power BI Connector:
ErrorType 1 - Query Structure Error: A query structure error is typically caused by the Connector failing to build a properly formatted query. This happens most often when using unsupported functionality, as specified in the Limitations above. Double check that you aren't using any calculated columns or custom visuals for that query.
ErrorType 2 - Query Building Error: A query building error is caused by the Microsoft Call Quality connector being unable to properly parse the query you're attempting to build. This error happens most often when using unsupported functionality, as specified in the Limitations above. Double check that you aren't using any calculated columns or custom visuals for that query.
ErrorType 5 - Execution Timeout: The query reached the maximum possible runtime before timing out. Try adding more filters to the query in order to limit its scope. Narrowing the data range is often the most effective way to achieve this.
ErrorType 7 - No Measurements Error: Call Quality Dashboard queries require a measure in order to function. Double check that your query includes measure. Measures in the Microsoft Call Quality connector are denoted by the aggregation (sum) symbol before their name.
If you encounter any another errors outside of this scope, notify the Call Quality Dashboard team so that we can help troubleshoot the issue and update the documentation as appropriate.
Footnotes
1 Certain processes and apps (for example, OneDrive) might cause your Documents root folder to change; make sure that the Power BI Desktop\Custom Connectors directory is placed inside of the current root folder Documents folder.
2 The sign in credentials you use for Call Quality Dashboard don't need to be the same credentials you use for logging into the Power BI Desktop app itself.
Frequently asked questions
When will the Power BI Connector be updated from "Beta" status?
Despite the "beta" label in the Microsoft Call Quality connector, the connector is in release status; it's not a beta. At the time of the connector's initial release, the Power BI team was unable to provide support and broader certification (and thus, the "beta" tag), but they were still prepared to attest to the security, authenticity, and general functionality of the Microsoft Call Quality connector. Since then, the CQD team independently continues to invest further development into the connector to improve and revise its functionality. The "beta" label shouldn't dissuade customers from using the connector. The labeling is just a side effect of our independent approach to connector development.
Why does the connector seem slower compared to Call Quality Dashboard in the browser? What can I do to improve performance?
Query performance for the various templates is actually the same in both the browser and in the connector. Just like any other standalone app, Power BI adds its authentication and rendering time to our performance. In addition, the difference comes in the number of concurrent queries being run. Because the in-browser version of Call Quality Dashboard had less well-developed and information-dense visualization options, most of our reports were limited to loading 2-3 queries at a time. On the other hand, the connector templates often display 20+ concurrent queries. If you wish to build reports that are as responsive as the older ones you were used to, try creating reports with no more than 2-3 queries per tab.
For more information, see the following articles:
I find that I routinely run into the 10,000-row limit when running queries. How can I get the connector to return more than 10,000 rows?
The 10,000-row limit is specified on the API end, and it's designed to help significantly improve performance and reduce the risk of query execution errors resulting from low memory conditions.
Instead of attempting to increase the result row count, it's best to restructure your reports according to connector best practices. The templates we include are designed to demonstrate these best practices. Where possible, start by looking at your KPIs using broader, lower-cardinality dimensions, such as Month, Year, Date, Region, Country, etc. From there, you can drill down into increasingly higher-cardinality dimensions. The Helpdesk and Location-Enhanced Reports both provide good examples of this drill down workflow.