Note
Access to this page requires authorization. You can try signing in or changing directories.
Access to this page requires authorization. You can try changing directories.
When Teams is running in a browser, it's easy to access the browser's Dev Tools. To access Dev Tools in Windows press F12 and in macOS press Command-Option-I. Dev Tools gives you access to:
- View console logs.
- View or modify HTML, CSS, and network requests during runtime.
- Add breakpoints to your JavaScript code and perform interactive debugging.
Note
Dev Tools is only available for desktop and Android clients. To access Dev Tools, you must enable Public preview.
Access Dev Tools on desktop
While the web version and the desktop version of Teams are almost same, there are some differences with authentication. Sometimes the only way to figure out what's going on is to use Dev Tools. To use Dev Tools in the desktop client, follow these steps:
Enable Public preview. You must restart Teams to view the Dev Tools option.
Open a tab to inspect with Dev Tools.
Open Dev Tools in one of the following ways:
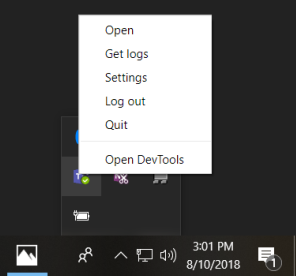
On Windows: Open the desktop tray and right-click to select the Microsoft Teams icon. Select Open Dev Tools:
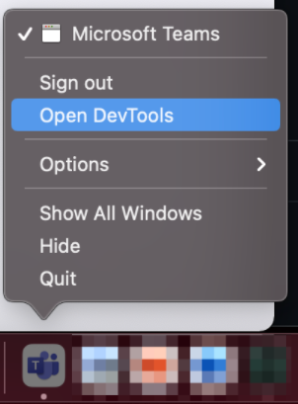
On macOS: Select Open Dev Tools:
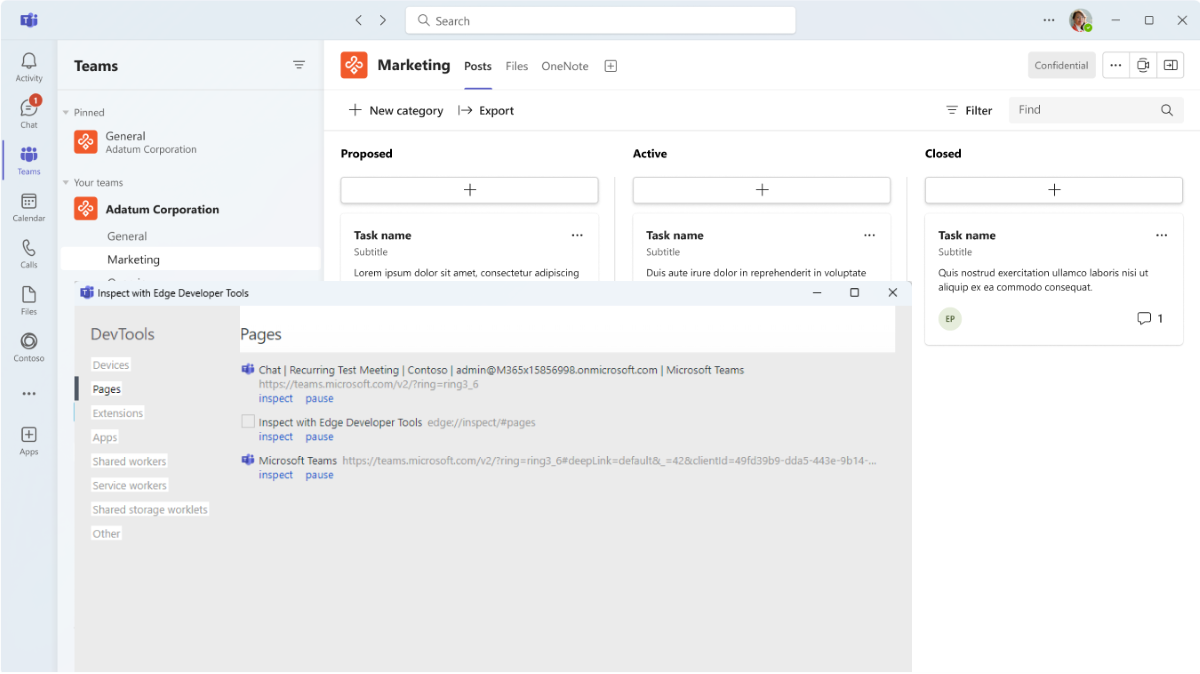
The following example shows DevTools:


Access DevTools from Teams Android client
You can enable DevTools in the Teams Android client. To enable DevTools, follow these steps:
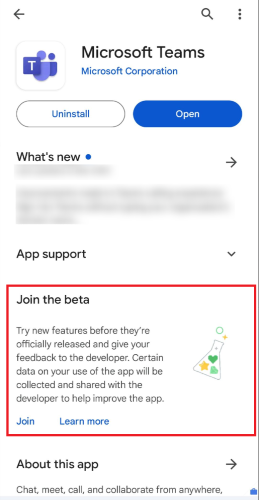
DevTools for Android is available only on the beta version of Teams app. To join the beta version of Teams app, follow the instructions listed in Get beta versions of apps.
Enable Public preview. You must restart Teams to view the Dev Tools option.
Connect your device to your desktop computer, and set up your Teams Android client for remote debugging.
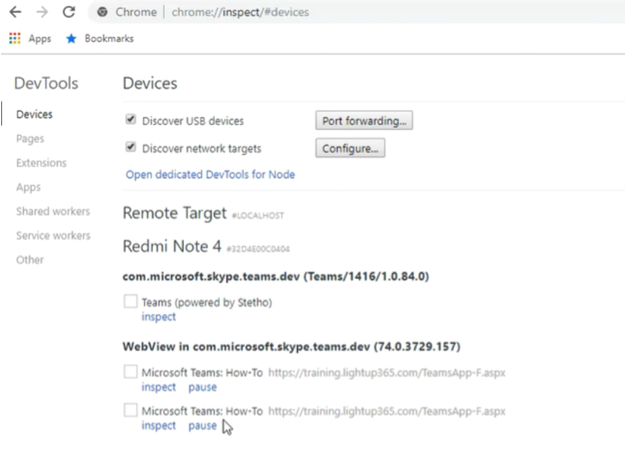
In your Chrome browser, open
chrome://inspect/#devices.Select inspect under the tab you wish to debug, as in the following image:

Access DevTools for Teams iOS client
You can access DevTools on your Teams iOS client. This involves meeting the necessary prerequisites and following the steps to activate it.
Prerequisites
To access DevTools for a Teams iOS client, ensure you meet the following requirements:
- Mac system with Safari.
- Teams iOS version 6.10.0 or later. You can download Microsoft Teams for iOS from the AppStore.
Activate DevTools for your Teams iOS client
To activate DevTools:
Confirm whether the user or the tenant is activated for targeted release. If not, you need to enable it.
For more information, see targeted release for entire organization.
Important
After enabling the user or the tenant for targeted release, allow 24 hours for the settings to take effect. After this period, try signing out and then signing back in on the Teams iOS client to confirm its activation.
Sign in to the Teams iOS app and activate the developer preview. For more information about developer preview, see public developer preview for Teams.
Enable Web Inspector for the Mac system and the iOS client. For more information, see enable Web Inspector.
Connect your Teams iOS client to your Mac system. When prompted, confirm that you trust the client and give your consent to allow the connection.
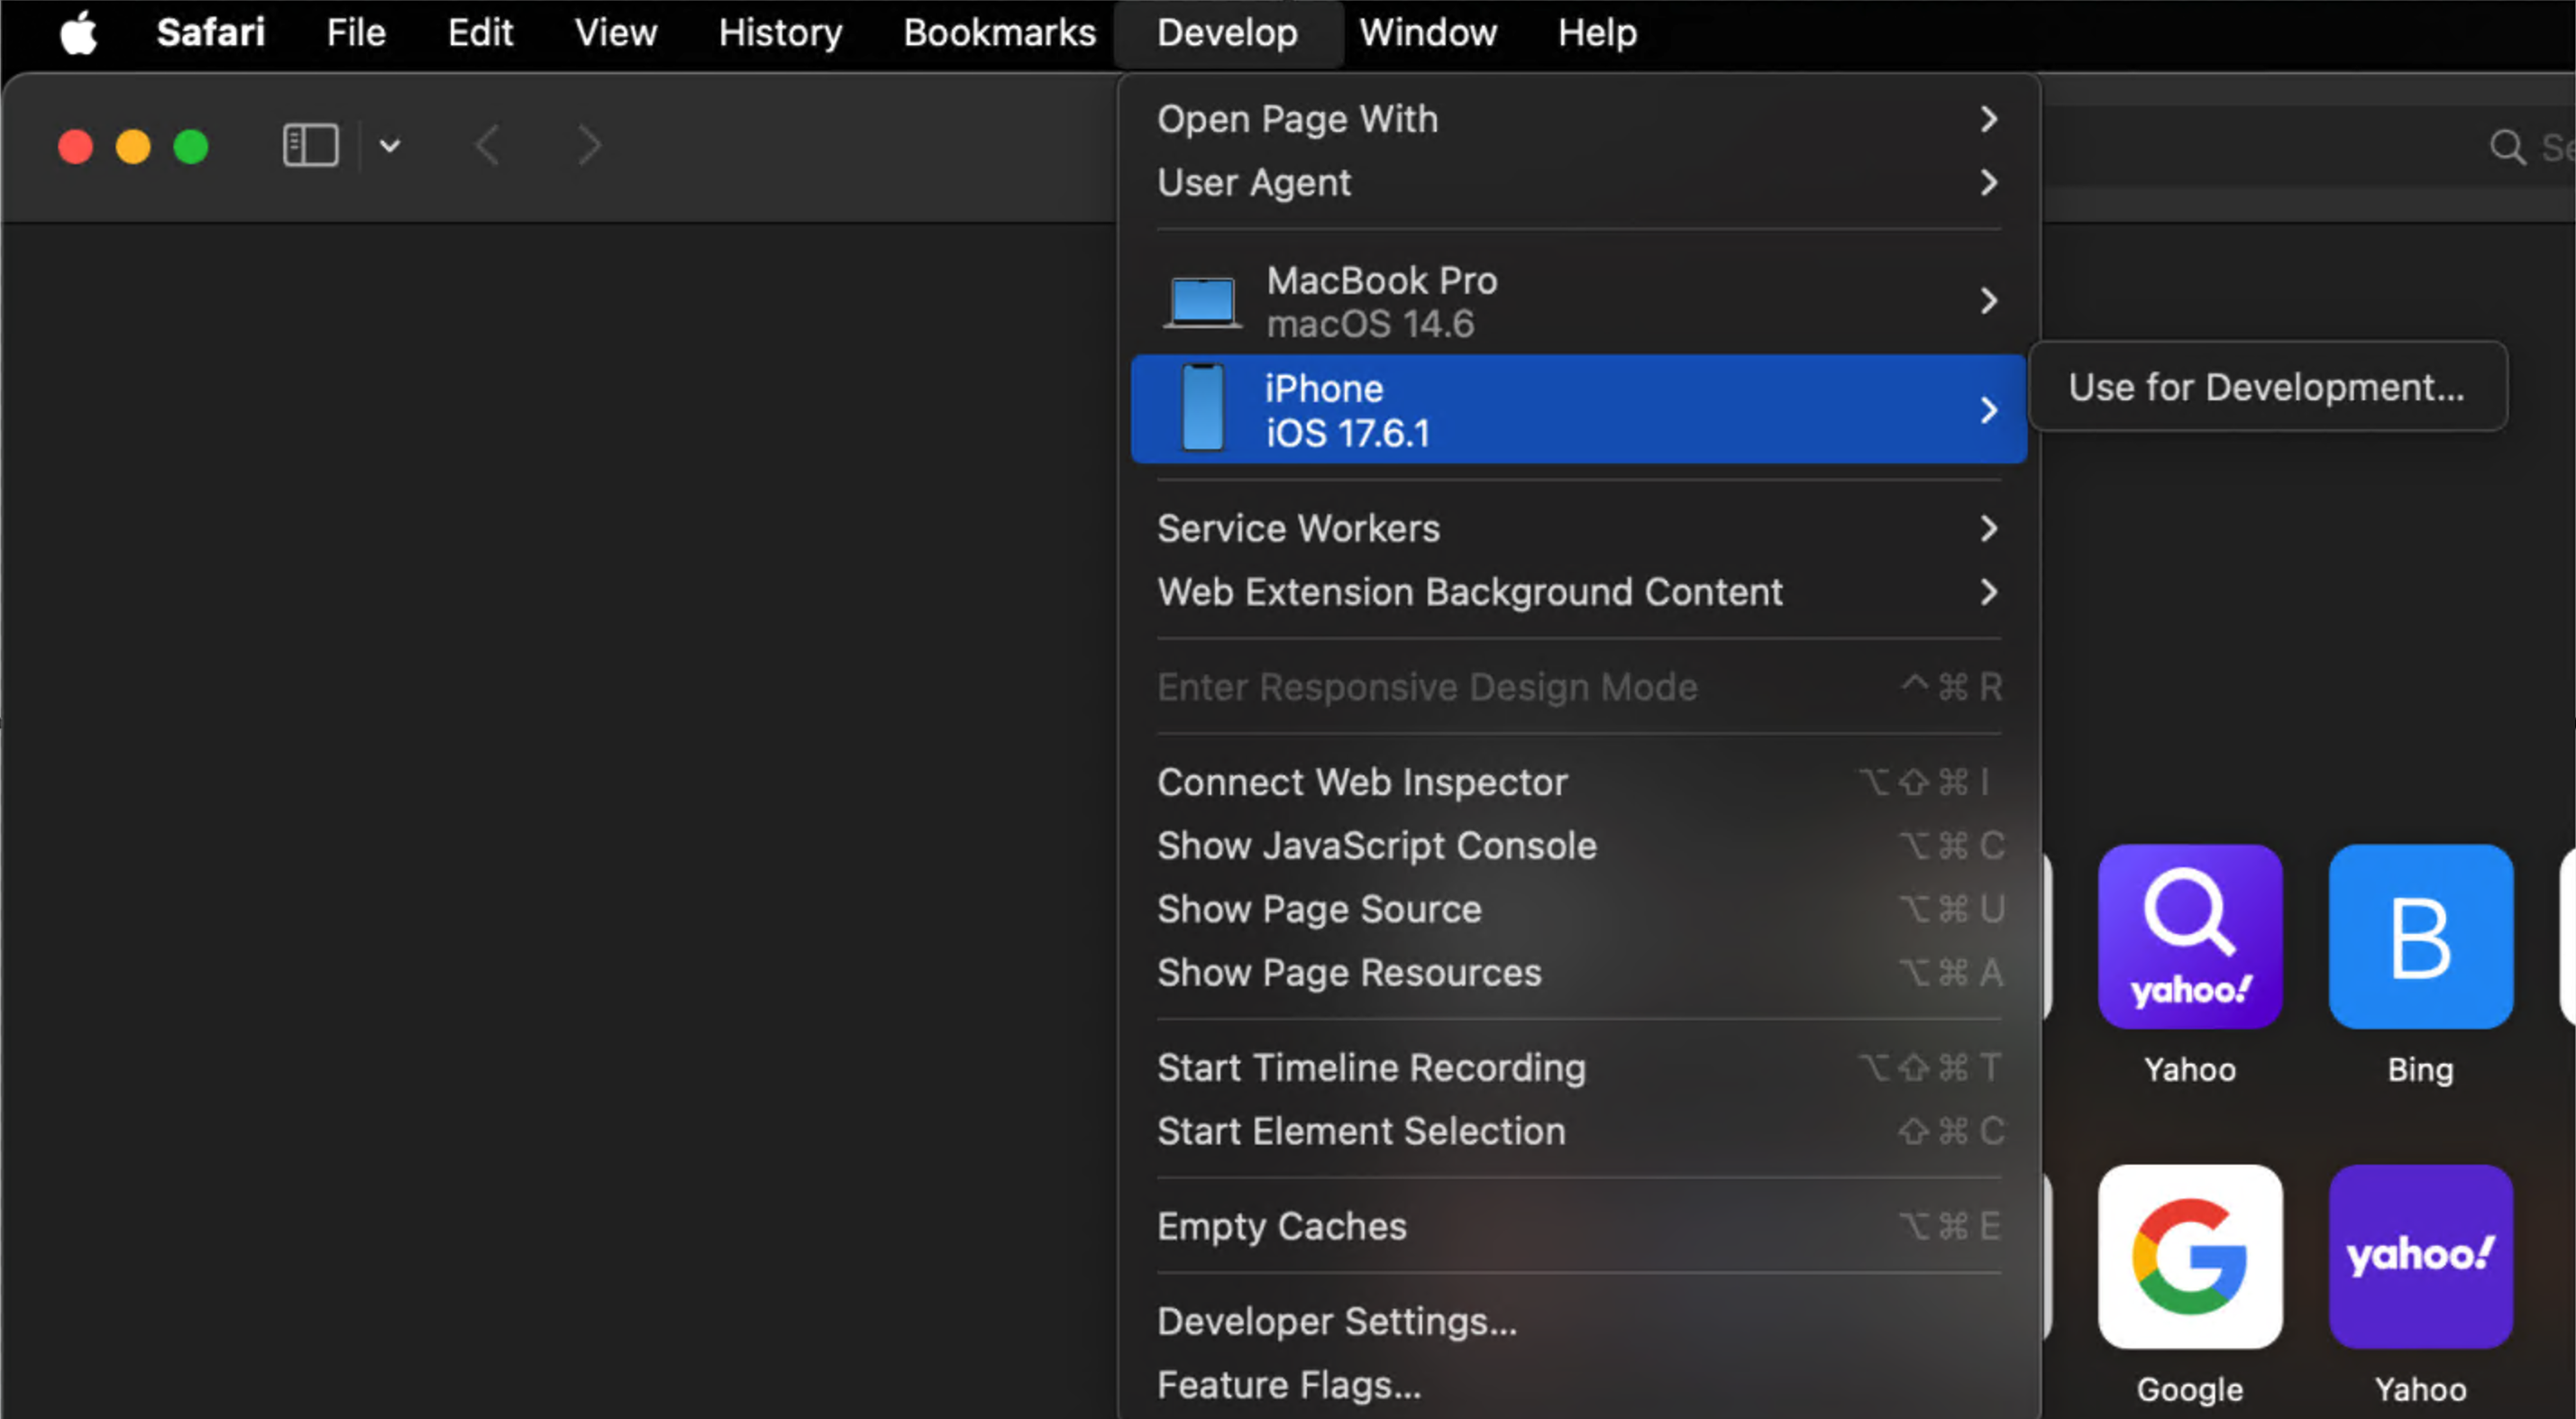
You'll find your iOS client listed under the Develop option in Safari on your Mac system.
From the Safari's Develop menu on the Mac system, select Use for Development... for your iOS client. This is a one-time setting that you configure the first time you use Safari to access DevTools for the iOS client.
Open Teams on your connected Teams iOS client and open your app inside Teams.
From the Develop menu, select the connected iOS client to view the inspection link for your app.
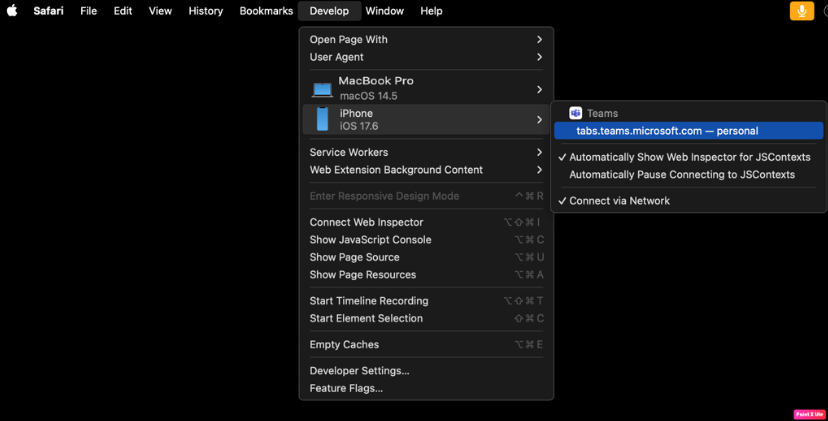
Select the link to open Safari Web Inspector for your app.
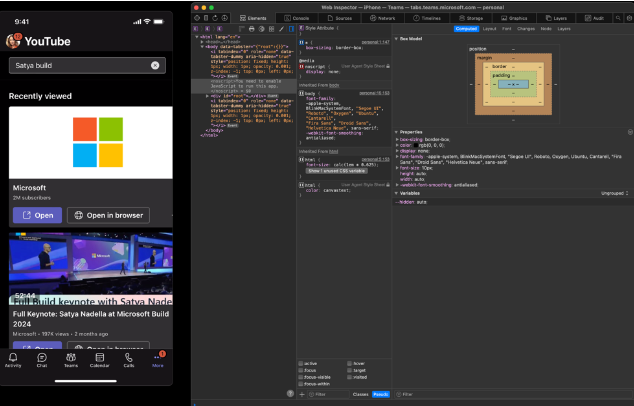
You can now utilize DevTools for your Teams iOS client.


See also
Collaborate with us on GitHub
The source for this content can be found on GitHub, where you can also create and review issues and pull requests. For more information, see our contributor guide.
Platform Docs