Note
Access to this page requires authorization. You can try signing in or changing directories.
Access to this page requires authorization. You can try changing directories.
This article provides code samples that show how to perform common tasks with tables using the Excel JavaScript API. For the complete list of properties and methods that the Table and TableCollection objects support, see Table Object (JavaScript API for Excel) and TableCollection Object (JavaScript API for Excel).
Create a table
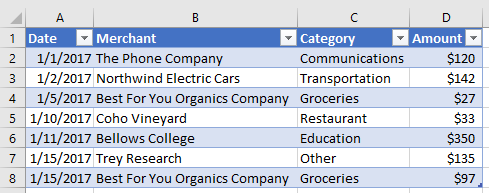
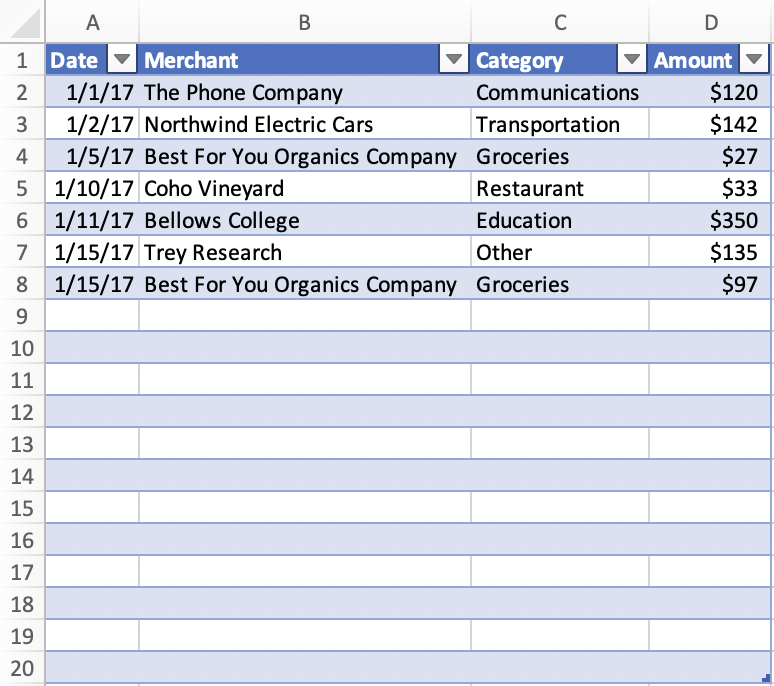
The following code sample creates a table in the worksheet named Sample. The table has headers and contains four columns and seven rows of data. If the Excel application where the code is running supports requirement set ExcelApi 1.2, the width of the columns and height of the rows are set to best fit the current data in the table.
Note
To specify a name for a table, you must first create the table and then set its name property, as shown in the following example.
await Excel.run(async (context) => {
    let sheet = context.workbook.worksheets.getItem("Sample");
    let expensesTable = sheet.tables.add("A1:D1", true /*hasHeaders*/);
    expensesTable.name = "ExpensesTable";

    expensesTable.getHeaderRowRange().values = [["Date", "Merchant", "Category", "Amount"]];

    expensesTable.rows.add(null /*add rows to the end of the table*/, [
        ["1/1/2017", "The Phone Company", "Communications", "$120"],
        ["1/2/2017", "Northwind Electric Cars", "Transportation", "$142"],
        ["1/5/2017", "Best For You Organics Company", "Groceries", "$27"],
        ["1/10/2017", "Coho Vineyard", "Restaurant", "$33"],
        ["1/11/2017", "Bellows College", "Education", "$350"],
        ["1/15/2017", "Trey Research", "Other", "$135"],
        ["1/15/2017", "Best For You Organics Company", "Groceries", "$97"]
    ]);

    if (Office.context.requirements.isSetSupported("ExcelApi", "1.2")) {
        sheet.getUsedRange().format.autofitColumns();
        sheet.getUsedRange().format.autofitRows();
    }

    sheet.activate();

    await context.sync();
});
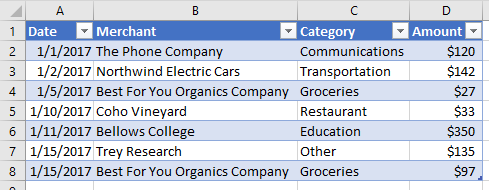
New table
Add rows to a table
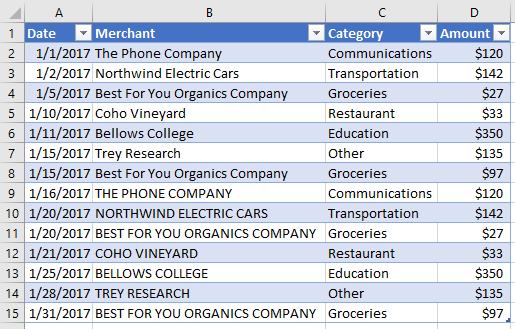
The following code sample adds seven new rows to the table named ExpensesTable within the worksheet named Sample. The index parameter of the add method is set to null, which specifies that the rows be added after the existing rows in the table. The alwaysInsert parameter is set to true, which indicates that the new rows be inserted into the table, not below the table. The width of the columns and height of the rows are then set to best fit the current data in the table.
Note
The index property of a TableRow object indicates the index number of the row within the rows collection of the table. A TableRow object does not contain an id property that can be used as a unique key to identify the row.
// This code sample shows how to add rows to a table that already exists
// on a worksheet named Sample.
await Excel.run(async (context) => {
    let sheet = context.workbook.worksheets.getItem("Sample");
    let expensesTable = sheet.tables.getItem("ExpensesTable");

    expensesTable.rows.add(
        null, // index, Adds rows to the end of the table.
        [
            ["1/16/2017", "THE PHONE COMPANY", "Communications", "$120"],
            ["1/20/2017", "NORTHWIND ELECTRIC CARS", "Transportation", "$142"],
            ["1/20/2017", "BEST FOR YOU ORGANICS COMPANY", "Groceries", "$27"],
            ["1/21/2017", "COHO VINEYARD", "Restaurant", "$33"],
            ["1/25/2017", "BELLOWS COLLEGE", "Education", "$350"],
            ["1/28/2017", "TREY RESEARCH", "Other", "$135"],
            ["1/31/2017", "BEST FOR YOU ORGANICS COMPANY", "Groceries", "$97"]
        ],
        true, // alwaysInsert, Specifies that the new rows be inserted into the table.
    );

    sheet.getUsedRange().format.autofitColumns();
    sheet.getUsedRange().format.autofitRows();

    await context.sync();
});
Table with new rows
Add a column to a table
These examples show how to add a column to a table. The first example populates the new column with static values; the second example populates the new column with formulas.
Note
The index property of a TableColumn object indicates the index number of the column within the columns collection of the table. The id property of a TableColumn object contains a unique key that identifies the column.
Add a column that contains static values
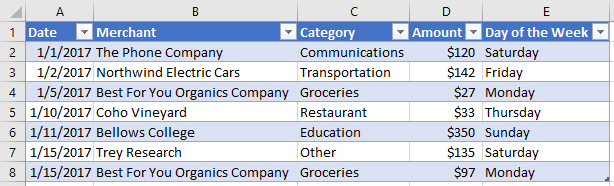
The following code sample adds a new column to the table named ExpensesTable within the worksheet named Sample. The new column is added after all existing columns in the table and contains a header ("Day of the Week") as well as data to populate the cells in the column. The width of the columns and height of the rows are then set to best fit the current data in the table.
await Excel.run(async (context) => {
    let sheet = context.workbook.worksheets.getItem("Sample");
    let expensesTable = sheet.tables.getItem("ExpensesTable");

    expensesTable.columns.add(null /*add columns to the end of the table*/, [
        ["Day of the Week"],
        ["Saturday"],
        ["Friday"],
        ["Monday"],
        ["Thursday"],
        ["Sunday"],
        ["Saturday"],
        ["Monday"]
    ]);

    sheet.getUsedRange().format.autofitColumns();
    sheet.getUsedRange().format.autofitRows();

    await context.sync();
});
Table with new column
Add a column that contains formulas
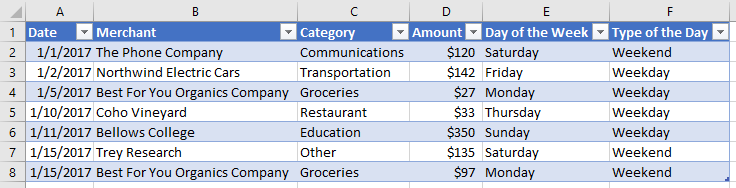
The following code sample adds a new column to the table named ExpensesTable within the worksheet named Sample. The new column is added to the end of the table, contains a header ("Type of the Day"), and uses a formula to populate each data cell in the column. The width of the columns and height of the rows are then set to best fit the current data in the table.
await Excel.run(async (context) => {
    let sheet = context.workbook.worksheets.getItem("Sample");
    let expensesTable = sheet.tables.getItem("ExpensesTable");

    expensesTable.columns.add(null /*add columns to the end of the table*/, [
        ["Type of the Day"],
        ['=IF(OR((TEXT([DATE], "dddd") = "Saturday"), (TEXT([DATE], "dddd") = "Sunday")), "Weekend", "Weekday")'],
        ['=IF(OR((TEXT([DATE], "dddd") = "Saturday"), (TEXT([DATE], "dddd") = "Sunday")), "Weekend", "Weekday")'],
        ['=IF(OR((TEXT([DATE], "dddd") = "Saturday"), (TEXT([DATE], "dddd") = "Sunday")), "Weekend", "Weekday")'],
        ['=IF(OR((TEXT([DATE], "dddd") = "Saturday"), (TEXT([DATE], "dddd") = "Sunday")), "Weekend", "Weekday")'],
        ['=IF(OR((TEXT([DATE], "dddd") = "Saturday"), (TEXT([DATE], "dddd") = "Sunday")), "Weekend", "Weekday")'],
        ['=IF(OR((TEXT([DATE], "dddd") = "Saturday"), (TEXT([DATE], "dddd") = "Sunday")), "Weekend", "Weekday")'],
        ['=IF(OR((TEXT([DATE], "dddd") = "Saturday"), (TEXT([DATE], "dddd") = "Sunday")), "Weekend", "Weekday")']
    ]);

    sheet.getUsedRange().format.autofitColumns();
    sheet.getUsedRange().format.autofitRows();

    await context.sync();
});
Table with new calculated column
Resize a table
Your add-in can resize a table without adding data to the table or changing cell values. To resize a table, use the Table.resize method. The following code sample shows how to resize a table. This code sample uses the ExpensesTable from the Create a table section earlier in this article and sets the new range of the table to A1:D20.
await Excel.run(async (context) => {
    // Retrieve the worksheet and a table on that worksheet.
    let sheet = context.workbook.worksheets.getItem("Sample");
    let expensesTable = sheet.tables.getItem("ExpensesTable");

    // Resize the table.
    expensesTable.resize("A1:D20");

    await context.sync();
});
Important
The new range of the table must overlap with the original range, and the headers (or the top of the table) must be in the same row.
Table after resize
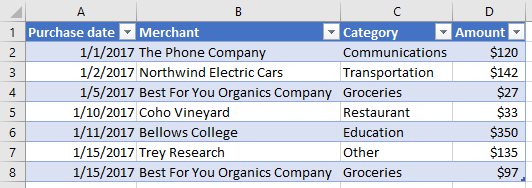
Update column name
The following code sample updates the name of the first column in the table to Purchase date. The width of the columns and height of the rows are then set to best fit the current data in the table.
await Excel.run(async (context) => {
    let sheet = context.workbook.worksheets.getItem("Sample");

    let expensesTable = sheet.tables.getItem("ExpensesTable");
    expensesTable.columns.load("items");

    await context.sync();

    expensesTable.columns.items[0].name = "Purchase date";

    sheet.getUsedRange().format.autofitColumns();
    sheet.getUsedRange().format.autofitRows();

    await context.sync();
});
Table with new column name
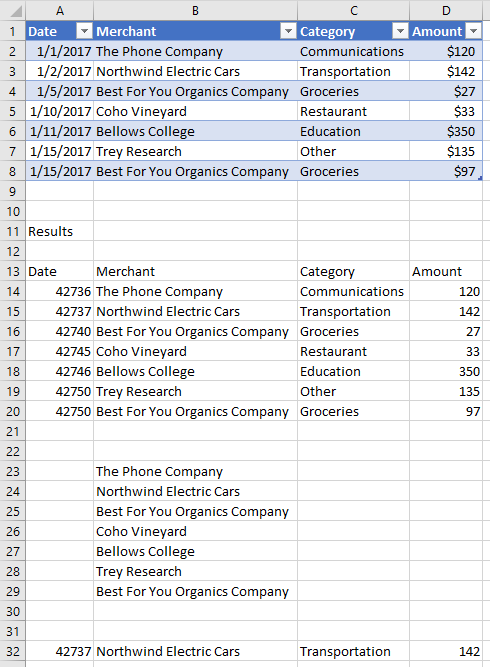
Get data from a table
The following code sample reads data from a table named ExpensesTable in the worksheet named Sample and then outputs that data below the table in the same worksheet.
await Excel.run(async (context) => {
    let sheet = context.workbook.worksheets.getItem("Sample");
    let expensesTable = sheet.tables.getItem("ExpensesTable");

    // Get data from the header row.
    let headerRange = expensesTable.getHeaderRowRange().load("values");

    // Get data from the table.
    let bodyRange = expensesTable.getDataBodyRange().load("values");

    // Get data from a single column.
    let columnRange = expensesTable.columns.getItem("Merchant").getDataBodyRange().load("values");

    // Get data from a single row.
    let rowRange = expensesTable.rows.getItemAt(1).load("values");

    // Sync to populate proxy objects with data from Excel.
    await context.sync();

    let headerValues = headerRange.values;
    let bodyValues = bodyRange.values;
    let merchantColumnValues = columnRange.values;
    let secondRowValues = rowRange.values;

    // Write data from table back to the sheet
    sheet.getRange("A11:A11").values = [["Results"]];
    sheet.getRange("A13:D13").values = headerValues;
    sheet.getRange("A14:D20").values = bodyValues;
    sheet.getRange("B23:B29").values = merchantColumnValues;
    sheet.getRange("A32:D32").values = secondRowValues;

    // Sync to update the sheet in Excel.
    await context.sync();
});
Table and data output
Detect data changes
Your add-in may need to react to users changing the data in a table. To detect these changes, you can register an event handler for the onChanged event of a table. Event handlers for the onChanged event receive a TableChangedEventArgs object when the event fires.
The TableChangedEventArgs object provides information about the changes and the source. Since onChanged fires when either the format or value of the data changes, it can be useful to have your add-in check if the values have actually changed. The details property encapsulates this information as a ChangedEventDetail. The following code sample shows how to display the before and after values and types of a cell that has been changed.
// This function would be used as an event handler for the Table.onChanged event.
async function onTableChanged(eventArgs) {
    await Excel.run(async (context) => {
        let details = eventArgs.details;
        let address = eventArgs.address;

        // Print the before and after types and values to the console.
        console.log(`Change at ${address}: was ${details.valueBefore}(${details.valueTypeBefore}),`
            + ` now is ${details.valueAfter}(${details.valueTypeAfter})`);
        await context.sync();
    });
}
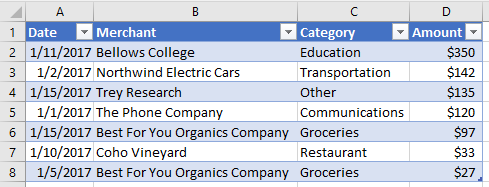
Sort data in a table
The following code sample sorts table data in descending order according to the values in the fourth column of the table.
await Excel.run(async (context) => {
    let sheet = context.workbook.worksheets.getItem("Sample");
    let expensesTable = sheet.tables.getItem("ExpensesTable");

    // Queue a command to sort data by the fourth column of the table (descending).
    let sortRange = expensesTable.getDataBodyRange();
    sortRange.sort.apply([
        {
            key: 3,
            ascending: false,
        },
    ]);

    // Sync to run the queued command in Excel.
    await context.sync();
});
Table data sorted by Amount (descending)
When data is sorted in a worksheet, an event notification fires. To learn more about sort-related events and how your add-in can register event handlers to respond to such events, see Handle sorting events.
Apply filters to a table
The following code sample applies filters to the Amount column and the Category column within a table. As a result of the filters, only rows where Category is one of the specified values and Amount is below the average value for all rows is shown.
await Excel.run(async (context) => {
    let sheet = context.workbook.worksheets.getItem("Sample");
    let expensesTable = sheet.tables.getItem("ExpensesTable");

    // Queue a command to apply a filter on the Category column.
    let categoryFilter = expensesTable.columns.getItem("Category").filter;
    categoryFilter.apply({
      filterOn: Excel.FilterOn.values,
      values: ["Restaurant", "Groceries"]
    });

    // Queue a command to apply a filter on the Amount column.
    let amountFilter = expensesTable.columns.getItem("Amount").filter;
    amountFilter.apply({
      filterOn: Excel.FilterOn.dynamic,
      dynamicCriteria: Excel.DynamicFilterCriteria.belowAverage
    });

    // Sync to run the queued commands in Excel.
    await context.sync();
});
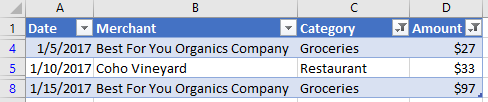
Table data with filters applied for Category and Amount
Clear table filters
The following code sample clears any filters currently applied on the table.
await Excel.run(async (context) => {
    let sheet = context.workbook.worksheets.getItem("Sample");
    let expensesTable = sheet.tables.getItem("ExpensesTable");

    expensesTable.clearFilters();

    await context.sync();
});
Table data with no filters applied
Get the visible range from a filtered table
The following code sample gets a range that contains data only for cells that are currently visible within the specified table, and then writes the values of that range to the console. You can use the getVisibleView() method as shown below to get the visible contents of a table whenever column filters have been applied.
await Excel.run(async (context) => {
    let sheet = context.workbook.worksheets.getItem("Sample");
    let expensesTable = sheet.tables.getItem("ExpensesTable");

    let visibleRange = expensesTable.getDataBodyRange().getVisibleView();
    visibleRange.load("values");

    await context.sync();
    console.log(visibleRange.values);
});
AutoFilter
An add-in can use the table's AutoFilter object to filter data. An AutoFilter object is the entire filter structure of a table or range. All of the filter operations discussed earlier in this article are compatible with the auto-filter. The single access point does make it easier to access and manage multiple filters.
The following code sample shows the same data filtering as the earlier code sample, but done entirely through the auto-filter.
await Excel.run(async (context) => {
    let sheet = context.workbook.worksheets.getItem("Sample");
    let expensesTable = sheet.tables.getItem("ExpensesTable");

    expensesTable.autoFilter.apply(expensesTable.getRange(), 2, {
        filterOn: Excel.FilterOn.values,
        values: ["Restaurant", "Groceries"]
    });
    expensesTable.autoFilter.apply(expensesTable.getRange(), 3, {
        filterOn: Excel.FilterOn.dynamic,
        dynamicCriteria: Excel.DynamicFilterCriteria.belowAverage
    });

    await context.sync();
});
An AutoFilter can also be applied to a range at the worksheet level. See Work with worksheets using the Excel JavaScript API for more information.
Format a table
The following code sample applies formatting to a table. It specifies different fill colors for the header row of the table, the body of the table, the second row of the table, and the first column of the table. For information about the properties you can use to specify format, see RangeFormat Object (JavaScript API for Excel).
await Excel.run(async (context) => {
    let sheet = context.workbook.worksheets.getItem("Sample");
    let expensesTable = sheet.tables.getItem("ExpensesTable");

    expensesTable.getHeaderRowRange().format.fill.color = "#C70039";
    expensesTable.getDataBodyRange().format.fill.color = "#DAF7A6";
    expensesTable.rows.getItemAt(1).getRange().format.fill.color = "#FFC300";
    expensesTable.columns.getItemAt(0).getDataBodyRange().format.fill.color = "#FFA07A";

    await context.sync();
});
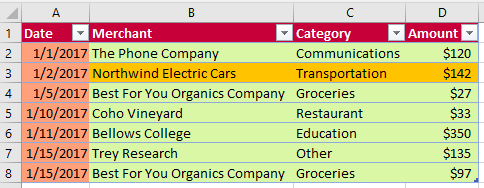
Table after formatting is applied
Convert a range to a table
The following code sample creates a range of data and then converts that range to a table. The width of the columns and height of the rows are then set to best fit the current data in the table.
await Excel.run(async (context) => {
    let sheet = context.workbook.worksheets.getItem("Sample");

    // Define values for the range.
    let values = [["Product", "Qtr1", "Qtr2", "Qtr3", "Qtr4"],
    ["Frames", 5000, 7000, 6544, 4377],
    ["Saddles", 400, 323, 276, 651],
    ["Brake levers", 12000, 8766, 8456, 9812],
    ["Chains", 1550, 1088, 692, 853],
    ["Mirrors", 225, 600, 923, 544],
    ["Spokes", 6005, 7634, 4589, 8765]];

    // Create the range.
    let range = sheet.getRange("A1:E7");
    range.values = values;

    sheet.getUsedRange().format.autofitColumns();
    sheet.getUsedRange().format.autofitRows();

    sheet.activate();

    // Convert the range to a table.
    let expensesTable = sheet.tables.add('A1:E7', true);
    expensesTable.name = "ExpensesTable";

    await context.sync();
});
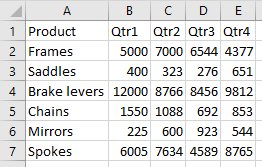
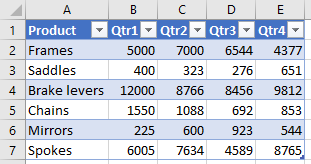
Data in the range (before the range is converted to a table)
Data in the table (after the range is converted to a table)
Import JSON data into a table
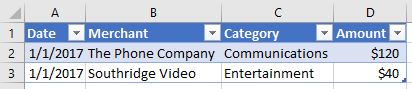
The following code sample creates a table in the worksheet named Sample and then populates the table by using a JSON object that defines two rows of data. The width of the columns and height of the rows are then set to best fit the current data in the table.
await Excel.run(async (context) => {
    let sheet = context.workbook.worksheets.getItem("Sample");

    let expensesTable = sheet.tables.add("A1:D1", true /*hasHeaders*/);
    expensesTable.name = "ExpensesTable";
    expensesTable.getHeaderRowRange().values = [["Date", "Merchant", "Category", "Amount"]];

    let transactions = [
      {
        "DATE": "1/1/2017",
        "MERCHANT": "The Phone Company",
        "CATEGORY": "Communications",
        "AMOUNT": "$120"
      },
      {
        "DATE": "1/1/2017",
        "MERCHANT": "Southridge Video",
        "CATEGORY": "Entertainment",
        "AMOUNT": "$40"
      }
    ];

    let newData = transactions.map(item =>
        [item.DATE, item.MERCHANT, item.CATEGORY, item.AMOUNT]);

    expensesTable.rows.add(null, newData);

    sheet.getUsedRange().format.autofitColumns();
    sheet.getUsedRange().format.autofitRows();

    sheet.activate();

    await context.sync();
});
New table
See also
Collaborate with us on GitHub
The source for this content can be found on GitHub, where you can also create and review issues and pull requests. For more information, see our contributor guide.
Office Add-ins