Debug your event-based or spam-reporting Outlook add-in
This article discusses the key debugging stages to enable and set breakpoints in your code as you implement event-based activation or integrated spam reporting in your add-in. Before you proceed, we recommend reviewing the troubleshooting guide for additional steps on how to resolve development errors.
To begin debugging, select the tab for your applicable client.
If you used the Yeoman generator for Office Add-ins to create your add-in project (for example, by completing an event-based activation walkthrough), follow the Created with Yeoman generator option throughout this article. Otherwise, follow the Other steps. Visual Studio Code should be at least version 1.56.1.
Mark your add-in for debugging and set the debugger port
Get your add-in's ID from the manifest.
- XML manifest: Use the value of the <Id> element child of the root <OfficeApp> element.
- Unified manifest for Microsoft 365: Use the value of the "id" property of the root anonymous
{ ... }object.
Create a registry
DWORDvalue namedUseDirectDebuggerinHKEY_CURRENT_USER\SOFTWARE\Microsoft\Office\16.0\Wef\Developer\[Add-in ID]. Replace[Add-in ID]with your add-in's ID from the manifest.Note
If the
Developerkey (folder) doesn't already exist underHKEY_CURRENT_USER\SOFTWARE\Microsoft\Office\16.0\WEF\, complete the following steps to create it.- Right-click (or select and hold) the WEF key (folder) and select New > Key.
- Name the new key Developer.
Created with Yeoman generator: In a command line window, navigate to the root of your add-in folder then run the following command.
npm startIn addition to building the code and starting the local server, this command sets the
UseDirectDebuggerregistry DWORD value data for this add-in to1.Other: In the
HKEY_CURRENT_USER\SOFTWARE\Microsoft\Office\16.0\WEF\Developer\[Add-in ID]\UseDirectDebuggerregistry DWORD value, where[Add-in ID]is your add-in's ID from the manifest, set the value data to1.In the registry key
HKEY_CURRENT_USER\SOFTWARE\Microsoft\Office\16.0\Wef\Developer\[Add-in ID], where[Add-in ID]is your add-in's ID from the manifest, create a newDWORDvalue with the following configuration.- Value name:
DebuggerPort - Value data (hexadecimal):
00002407
This sets the debugger port to
9223.- Value name:
Start Outlook or restart it if it's already open.
Perform the action to initiate the event you're developing for, such as creating a new message to initiate the
OnNewMessageComposeevent or reporting spam messages. The Debug Event-based handler dialog should appear. Do not interact with the dialog yet.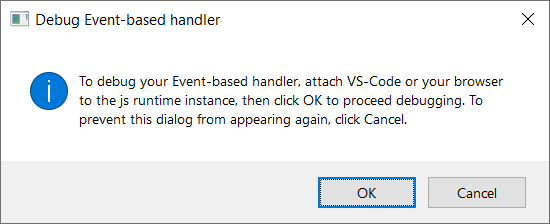
Configure Visual Studio Code
Created with Yeoman generator
Back in the command line window, run the following to open your add-in project in Visual Studio Code.
code .In Visual Studio Code, open the ./.vscode/launch.json file and add the following excerpt to your list of configurations. Save your changes.
{
  "name": "Direct Debugging",
  "type": "node",
  "request": "attach",
  "port": 9223,
  "timeout": 600000,
  "trace": true
}
Other
Create a new folder called Debugging (perhaps in your Desktop folder).
Open Visual Studio Code.
Go to File > Open Folder, navigate to the folder you just created, then choose Select Folder.
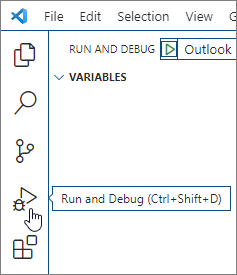
On the Activity Bar, select Run and Debug (Ctrl+Shift+D).
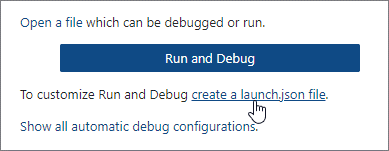
Select the create a launch.json file link.
In the Select Environment dropdown, select Edge: Launch to create a launch.json file.
Add the following excerpt to your list of configurations. Save your changes.
{
  "name": "Direct Debugging",
  "type": "node",
  "request": "attach",
  "port": 9223,
  "timeout": 600000,
  "trace": true
}
Attach the debugger
The bundle.js file of an add-in contains the JavaScript code of your add-in. It's created when Outlook on Windows is opened. When Outlook starts, the bundle.js file of each installed add-in is cached in the Wef folder of your machine.
To find the add-in's bundle.js file, navigate to the following folder in File Explorer. Replace text enclosed in
[]with your applicable Outlook and add-in information.%LOCALAPPDATA%\Microsoft\Office\16.0\Wef\{[Outlook profile GUID]}\[Outlook mail account encoding]\Javascript\[Add-in ID]_[Add-in Version]_[locale]Tip
If the bundle.js file doesn't appear in the Wef folder, try the following:
- If your add-in is installed or sideloaded, restart Outlook.
- Remove your add-in from Outlook, then sideload it again.
Open bundle.js in Visual Studio Code.
Place breakpoints in bundle.js where you want the debugger to stop.
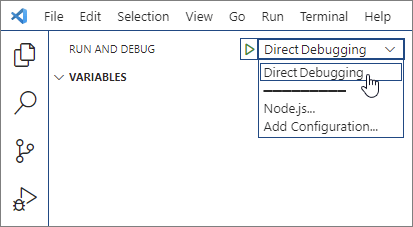
In the DEBUG dropdown, select Direct Debugging, then select the Start Debugging icon.
Run the debugger
After confirming that the debugger is attached, return to Outlook, and in the Debug Event-based handler dialog, choose OK .
You can now hit your breakpoints in Visual Studio Code, enabling you to debug your event-based activation or spam-reporting code.
Stop the debugger
To stop debugging the rest of the current Outlook on Windows session, in the Debug Event-based handler dialog, choose Cancel. To re-enable debugging, restart Outlook.
To prevent the Debug Event-based handler dialog from popping up and stop debugging for subsequent Outlook sessions, delete the associated registry key, HKEY_CURRENT_USER\SOFTWARE\Microsoft\Office\16.0\Wef\Developer\[Add-in ID]\UseDirectDebugger, or set its value to 0.
See also
Office Add-ins
Feedback
Coming soon: Throughout 2024 we will be phasing out GitHub Issues as the feedback mechanism for content and replacing it with a new feedback system. For more information see: https://aka.ms/ContentUserFeedback.
Submit and view feedback for