Note
Access to this page requires authorization. You can try signing in or changing directories.
Access to this page requires authorization. You can try changing directories.
Office Add-ins running on Windows can debug against the Edge runtime directly in Visual Studio Code.
Tip
If you can't, or don't wish to, debug using tools built into Visual Studio Code; or you're encountering a problem that only occurs when the add-in is run outside Visual Studio Code, you can debug the Microsoft Edge WebView2 runtime by using the Edge developer tools as described in Debug add-ins using developer tools for Microsoft Edge WebView2.
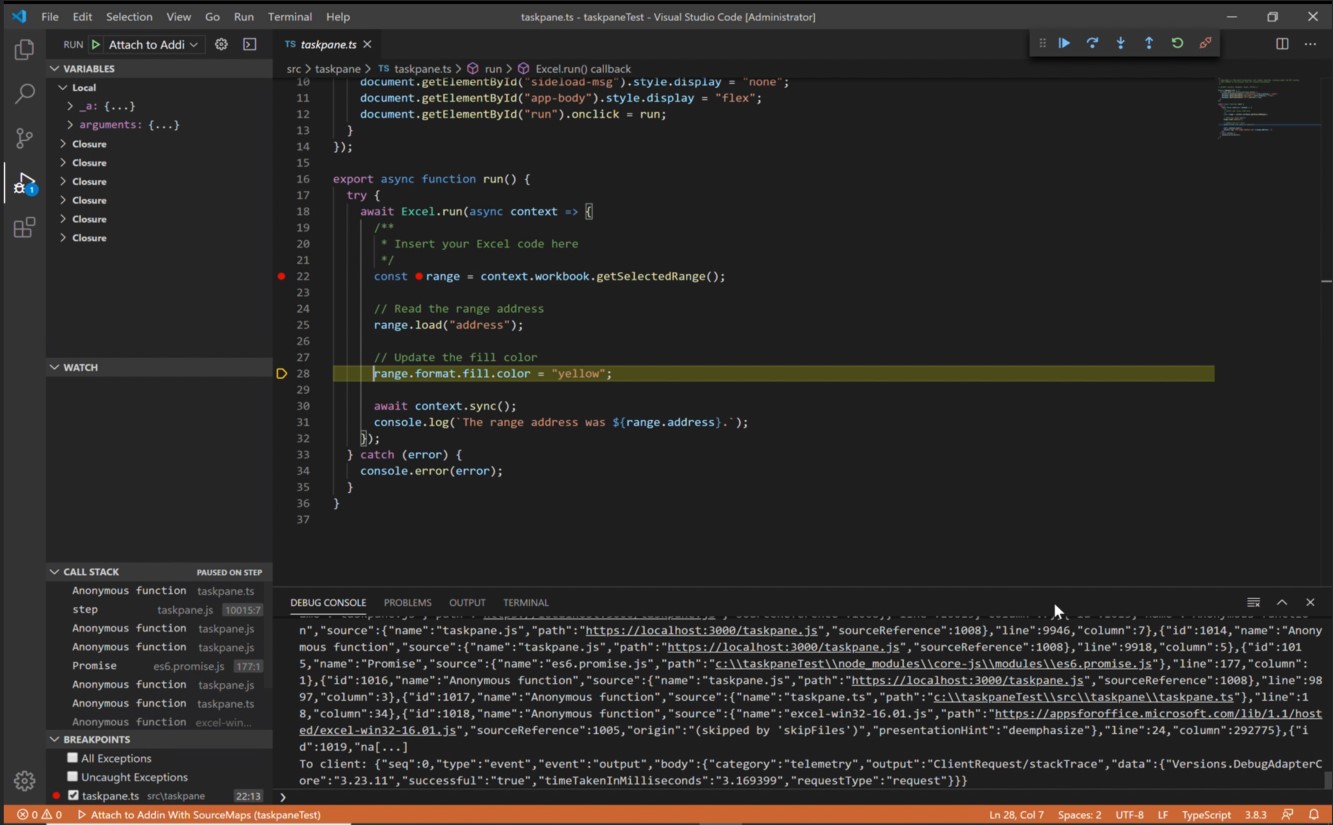
This debugging mode is dynamic, allowing you to set breakpoints while code is running. See changes in your code immediately while the debugger is attached, all without losing your debugging session. Your code changes also persist, so you see the results of multiple changes to your code. The following image shows this extension in action.
Prerequisites
- Visual Studio Code
- Node.js (the latest Active LTS version)
- Windows 10, 11
- A combination of platform and Office application that supports Microsoft Edge with WebView2 as explained in Browsers and webview controls used by Office Add-ins. If your version of Office from a Microsoft 365 subscription is earlier than Version 2101, you'll need to install WebView2. For instructions to install WebView2, see Microsoft Edge WebView2 / Embed web content ... with Microsoft Edge WebView2.
Debug a project created with Yo Office
These instructions assume you have experience using the command line, understand basic JavaScript, and have created an Office Add-in project before using the Yeoman generator for Office Add-ins. If you haven't done this before, consider visiting one of our tutorials, such as the Excel Office Add-in tutorial.
The first step depends on the project and how it was created.
- If you want to create a project to experiment with debugging in Visual Studio Code, use the Yeoman generator for Office Add-ins. Follow any of the Yo Office quick start guides, such as the Outlook add-in quick start.
- If you want to debug an existing project that was created with Yo Office, skip to the next step.
Open VS Code and open your project in it.
Choose View > Run or enter Ctrl+Shift+D to switch to debug view.
From the RUN AND DEBUG options, choose the Microsoft Edge option for your host application, such as Outlook Desktop (Edge Chromium). Select F5 or choose Run > Start Debugging from the menu to begin debugging. This action automatically launches a local server in a Node window to host your add-in and then automatically opens the host application, such as Excel or Word. This may take several seconds.
Tip
If you aren't using a project created with Yo Office, you may be prompted to adjust a registry key. While in the root folder of your project, run the following in the command line.
npx office-addin-debugging start <your manifest path>Important
If your project was created with older versions of Yo Office, you may see the following error dialog box about 10 - 30 seconds after you start debugging (at which point you may have already gone on to another step in this procedure) and it may be hidden behind the dialog box described in the next step.
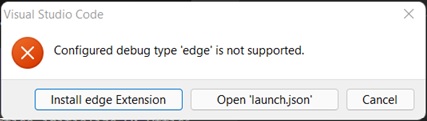
Complete the tasks in the Appendix and then restart this procedure.
In the host application, your add-in is now ready to use. Select Show Taskpane or run any other add-in command. A dialog box will appear with text similar to the following:
WebView Stop On Load. To debug the webview, attach VS Code to the webview instance using the Microsoft Debugger for Edge extension, and click OK to continue. To prevent this dialog from appearing in the future, click Cancel.
Select OK.
Note
If you select Cancel, the dialog won't be shown again while this instance of the add-in is running. However, if you restart your add-in, you'll see the dialog again.
You're now able to set breakpoints in your project's code and debug. To set breakpoints in Visual Studio Code, hover next to a line of code and select the red circle that appears.
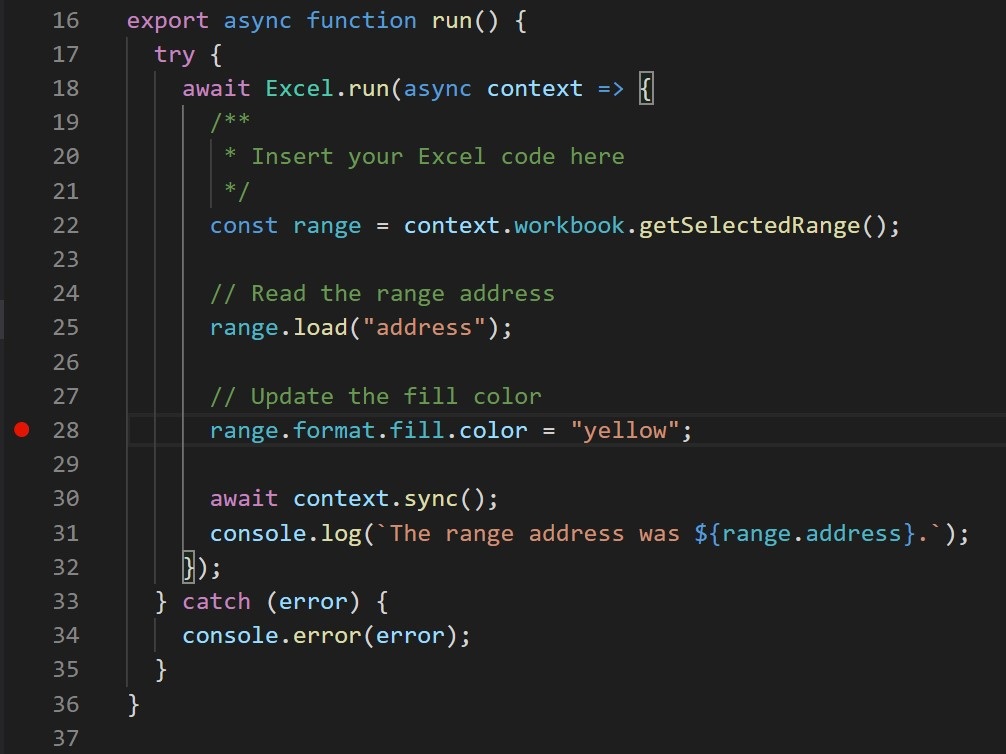
Run functionality in your add-in that calls the lines with breakpoints. You'll see that breakpoints have been hit and you can inspect local variables.
Note
Breakpoints in calls of
Office.initializeorOffice.onReadyare ignored. For details about these functions, see Initialize your Office Add-in.
Important
The best way to stop a debugging session is to select Shift+F5 or choose Run > Stop Debugging from the menu. This action should close the Node server window and attempt to close the host application, but there'll be a prompt on the host application asking you whether to save the document or not. Make an appropriate choice and let the host application close. Avoid manually closing the Node window or host application. Doing so can cause bugs especially when you are stopping and starting debugging sessions repeatedly.
If debugging stops working---for example, if breakpoints are being ignored---stop debugging. Then, if necessary, close all host application windows and the Node window. Finally, close Visual Studio Code and reopen it.
Debug a project not created with Yo Office
If your project wasn't created with Yo Office, you need to create a debug configuration for Visual Studio Code.
Configure package.json file
Ensure you have a
package.jsonfile. If you don't already have a package.json file, runnpm initin the root folder of your project and answer the prompts.Run
npm install office-addin-debugging. This package sideloads your add-in for debugging.Open the
package.jsonfile. In thescriptssection, add the following script."start:desktop": "office-addin-debugging start $MANIFEST_FILE$ desktop", "dev-server": "$SERVER_START$"Replace
$MANIFEST_FILE$with the correct file name and folder location of your manifest.Replace
$SERVER_START$with the command to start your web server. Later in these steps, theoffice-addin-debuggingpackage will specifically look for thedev-serverscript to launch your web server.Save and close the
package.jsonfile.
Configure launch.json file
Create a file named
launch.jsonin the\.vscodefolder of the project if there isn't one there already.Copy the following JSON into the file.
{
  // Other properties may be here.
  "configurations": [
    {
      "name": "$HOST$ Desktop (Edge Chromium)",
      "type": "msedge",
      "request": "attach",
      "useWebView": true,
      "port": 9229,
      "timeout": 600000,
      "webRoot": "${workspaceRoot}",
      "preLaunchTask": "Debug: Excel Desktop"
    }
  ]
  // Other properties may be here.
}
Note
If you already have a
launch.jsonfile, just add the single configuration to theconfigurationssection.Replace the placeholder
$HOST$with the name of the Office application that the add-in runs in. For example,OutlookorWord.Save and close the file.
Configure tasks.json
Create a file named
tasks.jsonin the\.vscodefolder of the project.Copy the following JSON into the file. It contains a task that starts debugging for your add-in.
{
  "version": "2.0.0",
  "tasks": [
    {
      "label": "Debug: $HOST$ Desktop",
      "type": "shell",
      "command": "npm",
      "args": ["run", "start:desktop", "--", "--app", "$HOST$"],
      "presentation": {
        "clear": true,
        "panel": "dedicated"
      },
      "problemMatcher": []
    }
  ]
}
Note
If you already have a
tasks.jsonfile, just add the single task to thetaskssection.Replace both instances of the placeholder
$HOST$with the name of the Office application that the add-in runs in. For example,OutlookorWord.
You can now debug your project using the VS Code debugger (F5).
Appendix
- In the error dialog box, select the Cancel button.
- If debugging doesn't stop automatically, select Shift+F5 or choose Run > Stop Debugging from the menu.
- Close the Node window where the local server is running, if it doesn't close automatically.
- Close the Office application if it doesn't close automatically.
- Open the
\.vscode\launch.jsonfile in the project. - In the
configurationsarray, there are several configuration objects. Find the one whose name has the pattern$HOST$ Desktop (Edge Chromium), where $HOST$ is an Office application that your add-in runs in; for example,Outlook Desktop (Edge Chromium)orWord Desktop (Edge Chromium). - Change the value of the
"type"property from"edge"to"pwa-msedge". - Change the value of the
"useWebView"property from the string"advanced"to the booleantrue(note there are no quotation marks around thetrue). - Save the file.
- Close VS Code.
See also
Collaborate with us on GitHub
The source for this content can be found on GitHub, where you can also create and review issues and pull requests. For more information, see our contributor guide.
Office Add-ins