Note
Access to this page requires authorization. You can try signing in or changing directories.
Access to this page requires authorization. You can try changing directories.
This sample uses Office Scripts and Power Automate to create a chart. It then emails images of the chart and its base table.
Example scenario
- Calculate to get latest results.
- Create chart.
- Get chart and table images.
- Email the images with Power Automate.
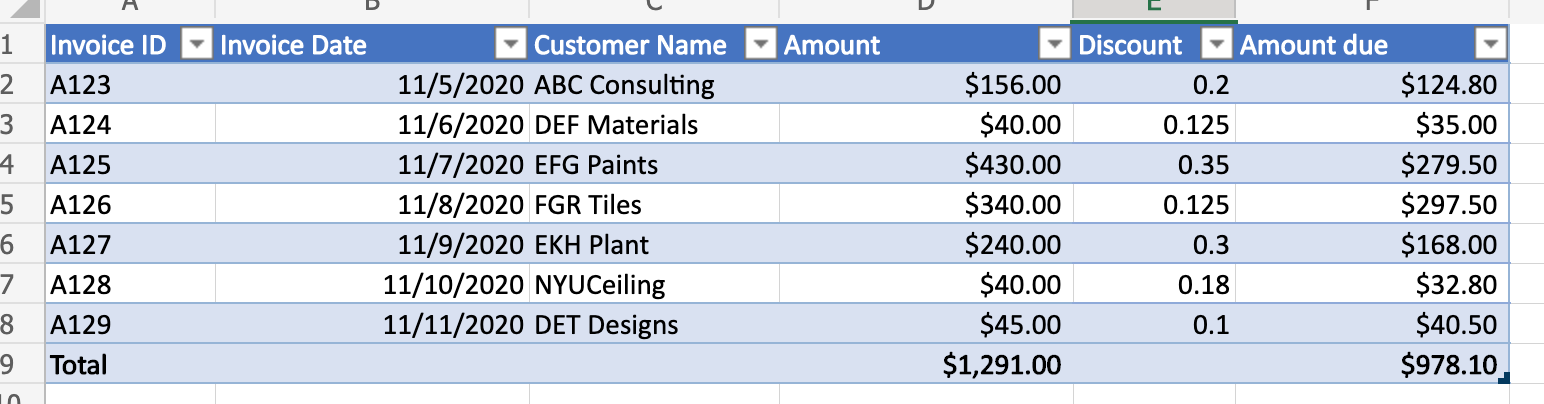
Input data
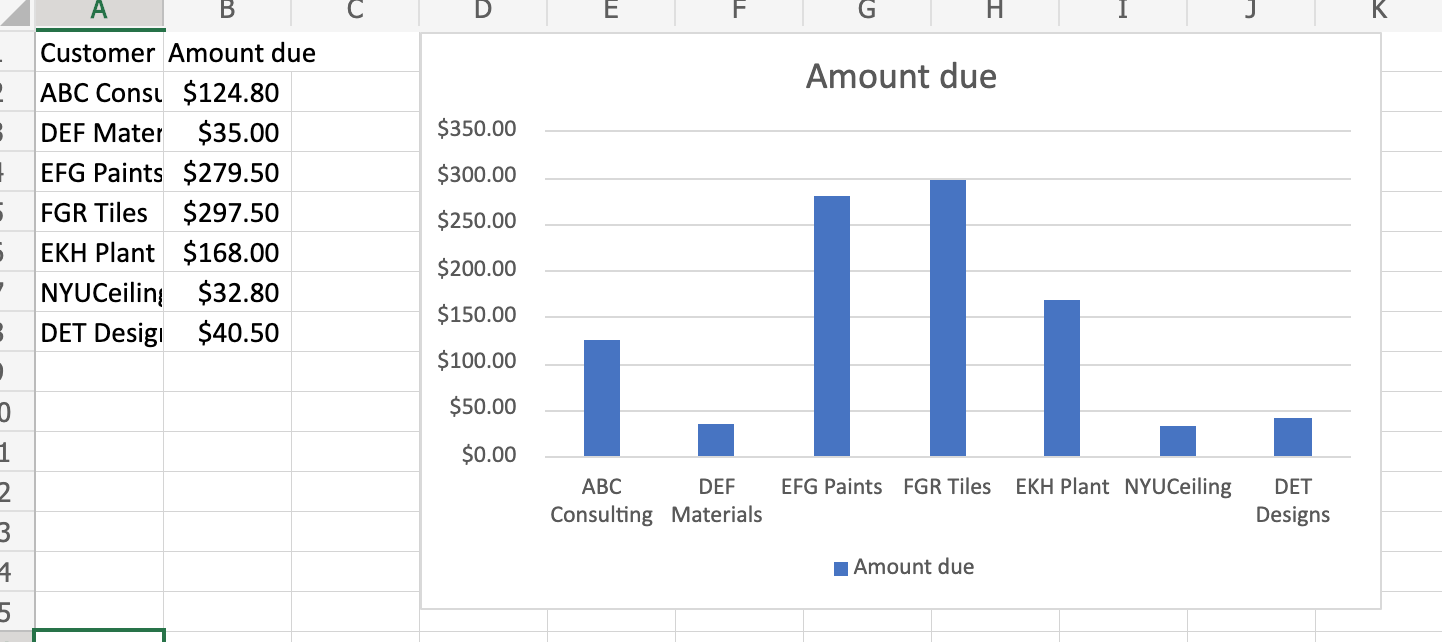
Output chart
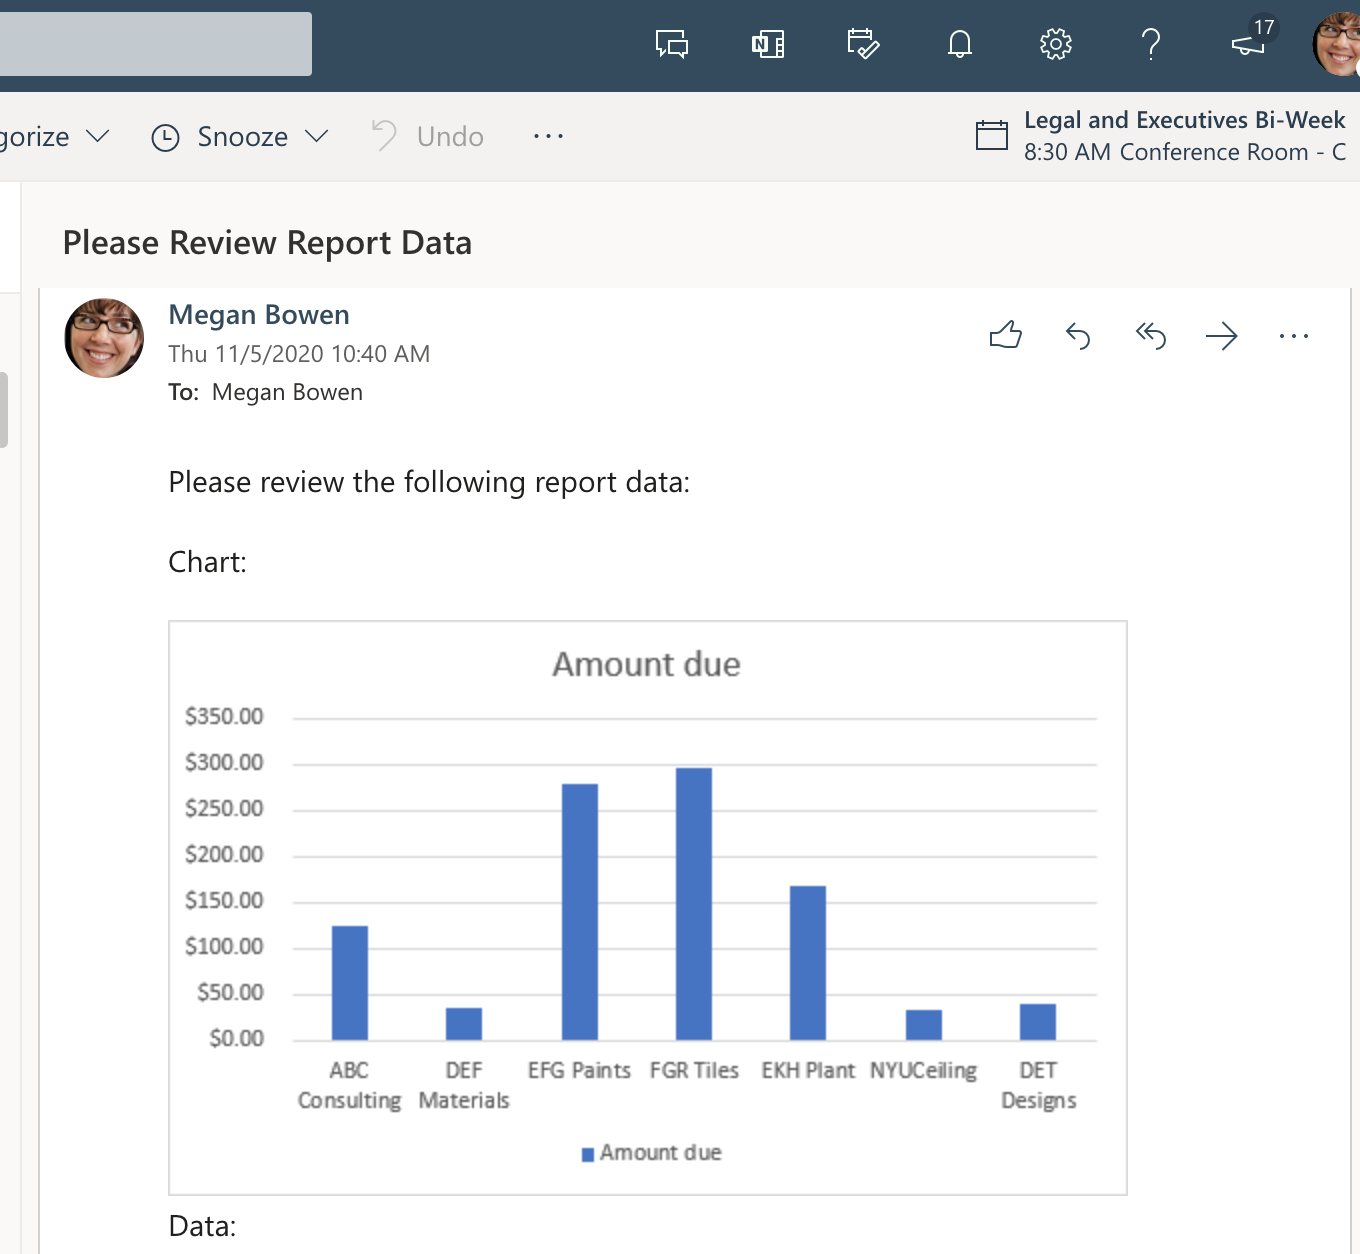
Email that was received through Power Automate flow
Solution
This solution has two parts:
- An Office Script to calculate and extract Excel chart and table
- A Power Automate flow to invoke the script and email the results. For an example on how to do this, see Create an automated workflow with Power Automate.
Setup: Sample Excel file
This workbook contains the data, objects, and formatting expected by the script.
Sample code: Calculate and extract Excel chart and table
Add the following script to the sample workbook. In Excel, use Automate > New Script > Create in Code Editor to paste the code and save the script. Save it as Get chart image and try the sample yourself!
function main(workbook: ExcelScript.Workbook): ReportImages {
  // Recalculate the workbook to ensure all tables and charts are updated.
  workbook.getApplication().calculate(ExcelScript.CalculationType.full);

  // Get the data from the "InvoiceAmounts" table.
  const sheet1 = workbook.getWorksheet("Sheet1");
  const table = workbook.getWorksheet('InvoiceAmounts').getTables()[0];
  const rows = table.getRange().getTexts();

  // Get only the "Customer Name" and "Amount due" columns, then remove the "Total" row.
  const selectColumns = rows.map((row) => {
    return [row[2], row[5]];
  });
  table.setShowTotals(true);
  selectColumns.splice(selectColumns.length - 1, 1);
  console.log(selectColumns);

  // Delete the "ChartSheet" worksheet if it's present, then recreate it.
  workbook.getWorksheet('ChartSheet')?.delete();
  const chartSheet = workbook.addWorksheet('ChartSheet');

  // Add the selected data to the new worksheet.
  const targetRange = chartSheet.getRange('A1').getResizedRange(selectColumns.length - 1, selectColumns[0].length - 1);
  targetRange.setValues(selectColumns);

  // Insert the chart on sheet 'ChartSheet' at cell "D1".
  const chart = chartSheet.addChart(ExcelScript.ChartType.columnClustered, targetRange);
  chart.setPosition('D1');

  // Get images of the chart and table, then return them for a Power Automate flow.
  const chartImage = chart.getImage();
  const tableImage = table.getRange().getImage();
  return { chartImage, tableImage };
}

// The interface for table and chart images.
interface ReportImages {
  chartImage: string
  tableImage: string
}
Power Automate flow: Email the chart and table images
This flow runs the script and emails the returned images.
Create a new Instant cloud flow.
Choose Manually trigger a flow and select Create.
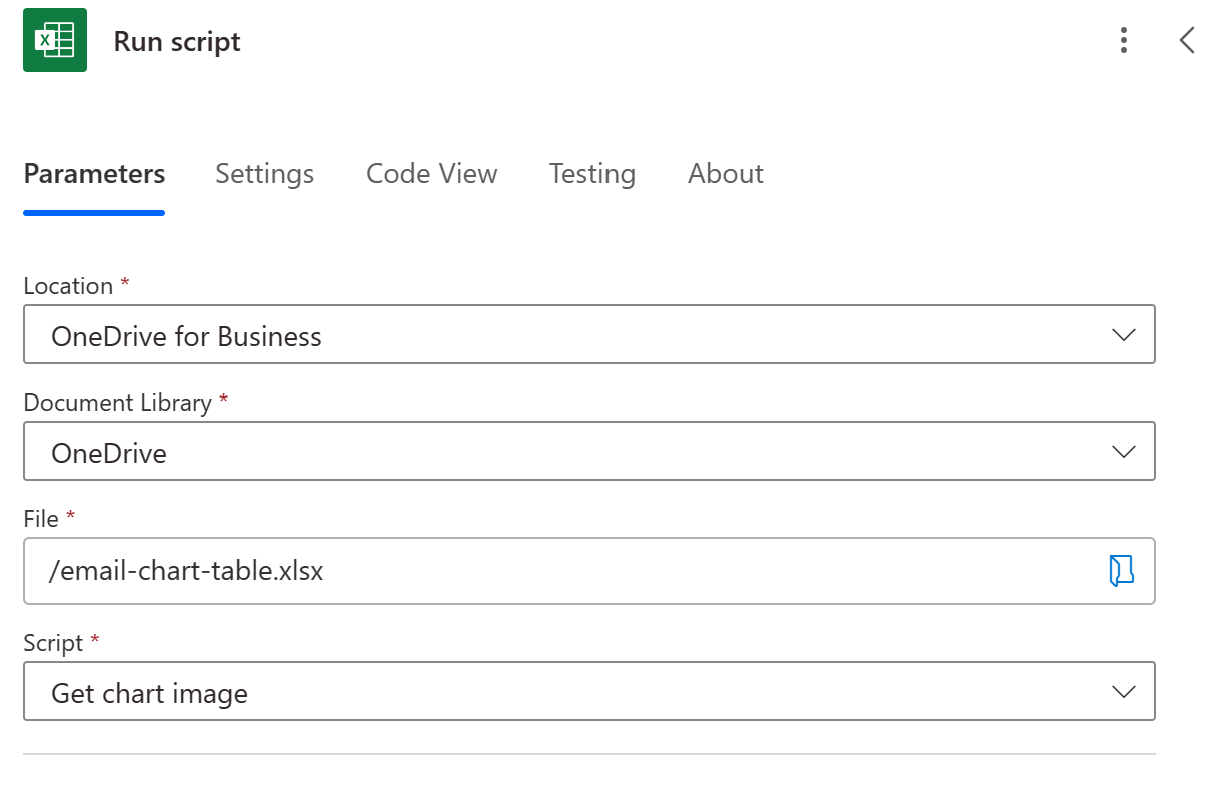
Add a New step that uses the Excel Online (Business) connector with the Run script action. Use the following values for the action.
- Location: OneDrive for Business
- Document Library: OneDrive
- File: email-chart-table.xlsx (selected with the file chooser)
- Script: Get chart image
This sample uses Outlook as the email client. You could use any email connector Power Automate supports, but the rest of the steps assume that you chose Outlook. Add a New step that uses the Office 365 Outlook connector and the Send and email (V2) action. Use the following values for the action.
- To: Your test email account (or personal email)
- Subject: Please Review Report Data
- For the Body field, select "Code View" (
<>) and enter the following:
<p>Please review the following report data:<br>
<br>
Chart:<br>
<br>
<img src="data:image/png;base64,@{outputs('Run_script')?['body/result/chartImage']}"/>
<br>
Data:<br>
<br>
<img src="data:image/png;base64,@{outputs('Run_script')?['body/result/tableImage']}"/>
<br>
</p>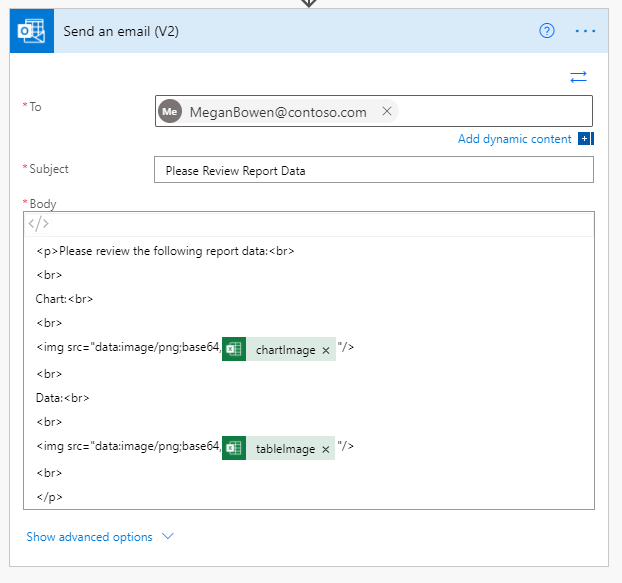
Save the flow and try it out. Use the Test button on the flow editor page or run the flow through your My flows tab. Be sure to allow access when prompted.
Training video: Extract and email images of chart and table
Collaborate with us on GitHub
The source for this content can be found on GitHub, where you can also create and review issues and pull requests. For more information, see our contributor guide.
Office Scripts