Note
Access to this page requires authorization. You can try signing in or changing directories.
Access to this page requires authorization. You can try changing directories.
Create reports in the Power BI service using the data that's in a view of your model-driven app. Power BI automatically generates the visuals for you, so you can start exploring the data with just a few clicks.
If you're new to Power BI reports and need more information, see Reports in Power BI.
If you're using Power BI Desktop, you can also create a report using data from Dataverse in Power BI Desktop.
Note
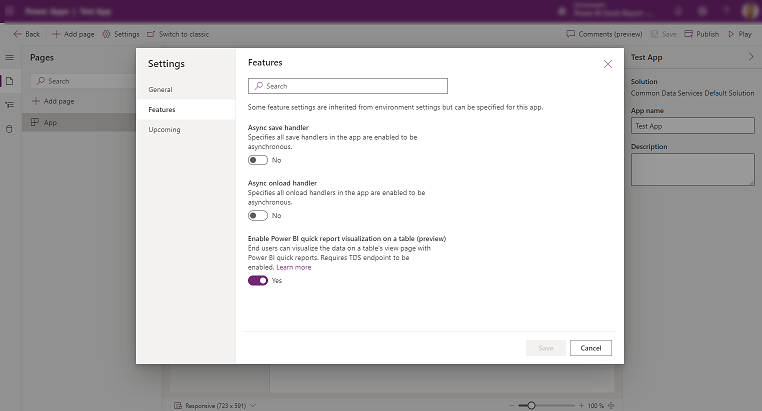
Your administrator needs to turn on the Enable Power BI quick report visualization on a table feature setting, to use the capabilities that are covered in this topic. For more information, see Manage feature settings.
Visualize in Power BI
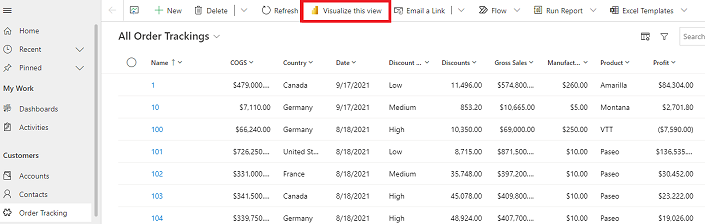
In your model-driven app, select a table and then on the command bar, select Visualize this view.
Power BI-generates visuals of the data in your view, based on the view definition. That is, the filters acting on the view are automatically applied to the Power BI visualization. A subset of columns that are part of the view are used to auto-generate the Power BI visuals.
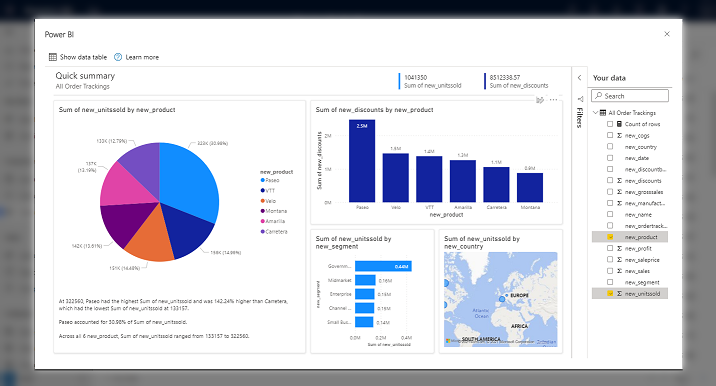
The full set of view columns are available in the Power BI report to be used to change the data you see in the report.
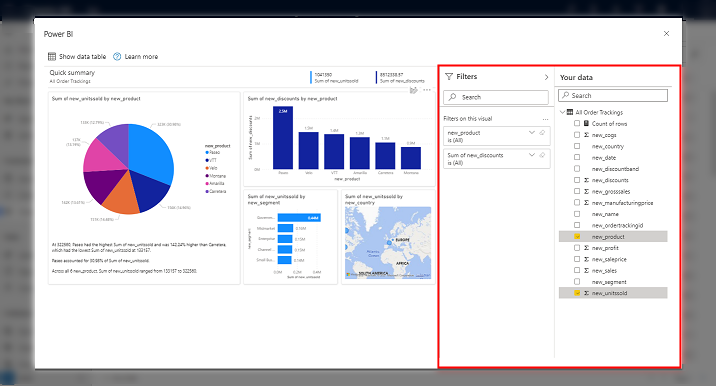
For more information on how you can interact with this visualization, see Visualize your data quickly from Power Apps and Dynamics 365 apps (preview).
Licensing considerations
Anyone can use the Visualize this view feature to explore the data in a view, but to use the full edit experience, publish reports, access reports that others have published, or delete reports, you need a Power BI Pro license. If you don't currently have a Pro license, you can buy a Power BI Pro license or start a free trial.
Known issues and limitations
The first time you visualize the data in a view, creating the dataset and report can take some time. We're working to improve this performance experience.
This feature isn't supported for the Activities table due to a limitation in generating charts.
This feature isn't supported for guest users in a tenant.
If you're building your app for mobile, Power BI dashboards aren't a recommended choice to visualize data. Power BI dashboards are suited for larger screens, and the small screens and form factor of mobile devices can cause usability issues with scroll bars, filters, and more.