Note
Access to this page requires authorization. You can try signing in or changing directories.
Access to this page requires authorization. You can try changing directories.
Along with statistics about your cases, activities, and edges, the Power Automate Process Mining desktop app collects statistics on each of your business rules. You can view them in the Statistics screen.
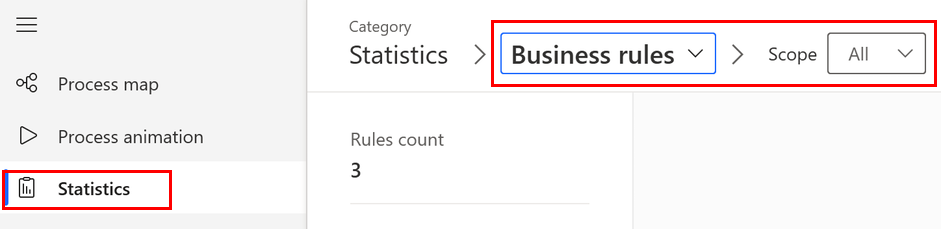
In the left panel, select Statistics.
In the dropdown menu, select Business rules.
(Optional) Select a scope. By default, the display includes all scopes.
Statistics are available at two levels:
Summary view: Displays a row of metrics for each business rule of the selected scope
Detailed view: Displays metrics per activity or edge for a single business rule
Summary view
The summary view displays a single row of metrics for each business rule you defined for the process or for business rules of the selected scope. The category isn't evaluated for event and edge business rules when you display them in the summary view. To display metrics per activity or edge, use the detailed view.
If you select a scope other than All, the list of business rules is limited to rules of the selected scope.
Detailed view
Event scope and edge scope business rules calculate results per event or edge. To display the details of events or edges, select the scope and then select a business rule of that scope.
In the Scope dropdown menu, select Event or Edge.
To add a filter, select Enable filter.
In the dropdown menu, select a business rule.
The table shows metrics for each activity or edge in the data set of the selected business rule.