Note
Access to this page requires authorization. You can try signing in or changing directories.
Access to this page requires authorization. You can try changing directories.
This article provides an overview of the properties of the process undergoing analysis. This includes the information about the process through summary charts and statistics. Statistics are shown in the top panel. The listings of specific records displayed in the statistics appear in the bottom panel.
The statistics always reflect the data after filters, if any, have been applied.
Types of statistics
To open the statistics screen, select Statistics on the left panel in the opened view. The following types of statistics are available:
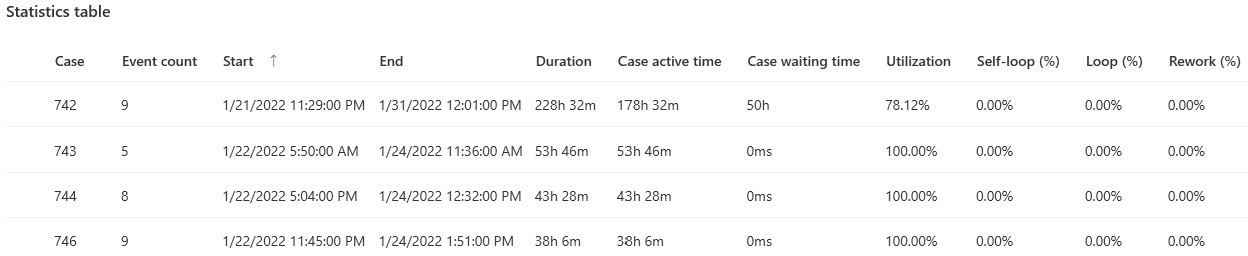
Case overview: Statistics per single cases with case level metrics. To learn more, go to Case overview statistics.
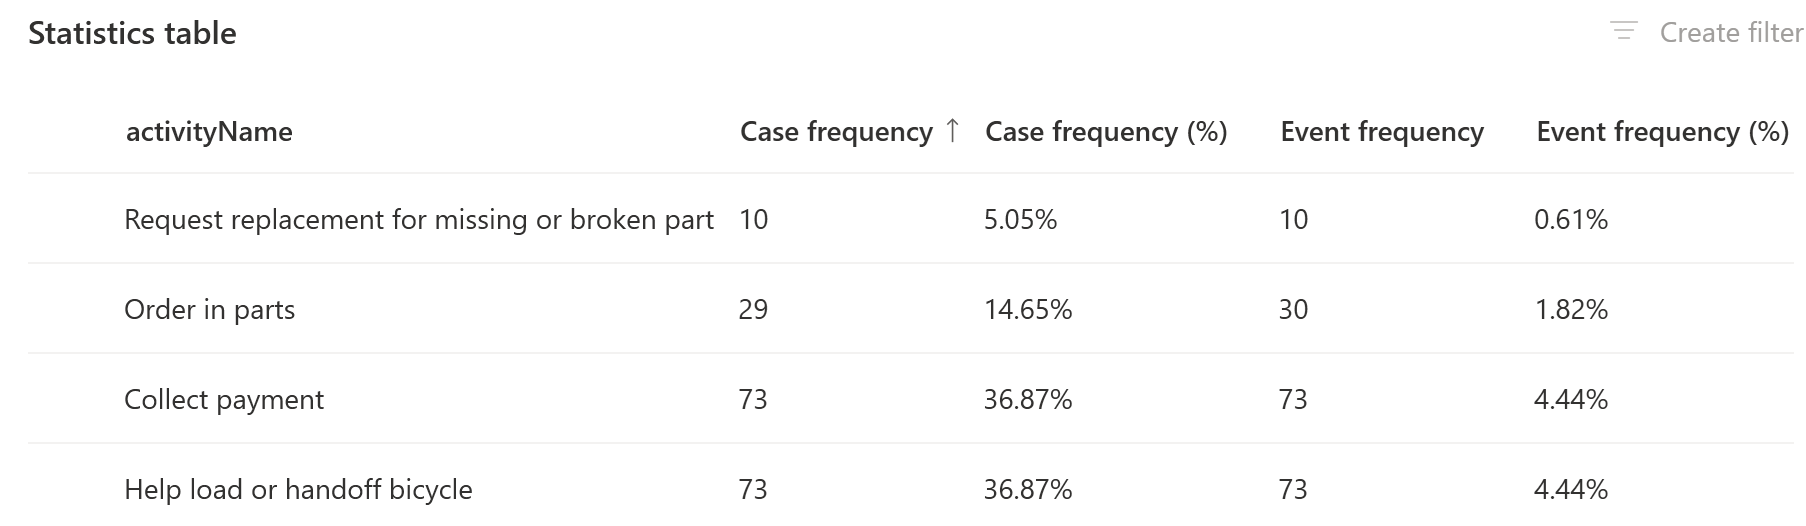
Activity statistics: Activities that display their various event level properties. To learn more, go to Activities (event-level) statistics.
- Attributes imported with the process marked as Others and Source have the same statistical summary as the statistics for the activity.
Edge statistics: Process paths (edges) metrics. To learn more, go to Edge statistics.
Cases duration influence: Analytical insight that evaluates the influence of case-level attributes (including financial) on the mean case duration. To learn more, go to Case duration influence in this article.
Business rules: Overview of defined business rules. To learn more, go to Business rules overview.
Export statistics
You can export your statistics chart in .png format, or your table of records in .csv format.
To export, select an option in the Export dropdown menu.
Stastistics samples
Statistics allow you to quickly identify issues in the process. The following sections provide examples.
Average resource activity time
Show the average activity time of resources. As in the following screenshot, it's apparent that some resources need much longer time to complete their activities than others. You can narrow your list of resources to get more data.
To choose specific resources:
In the Category dropdown menu, select activityName.
Select Enable filter.
In the Filtered by dropdown menu, select Associate.
Open the Attribute value list by selecting the blank values field.
Select the associates names. The names are added to the values field.
Select Apply.
Cases duration
Show the number of cases with varying duration intervals. If the chart shows that there are rare cases in the data that distort the average values, such cases might require attention, or possibly should be excluded from process analysis as non-standard.
To select case duration:
In the Category dropdown menu, select Case overview.
In the Active cases dropdown menu, select Cases duration.
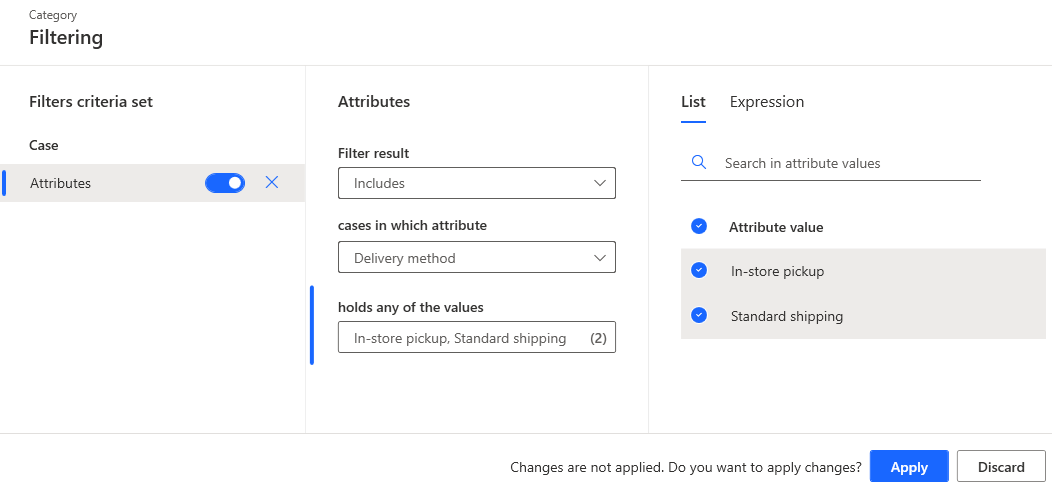
Filtering in statistics charts
You can filter selected values in the summary charts in the statistics of process instances and in the statistics of attributes by selecting each column. When you make a selection, the Filtering screen opens with the preset values of the filter.
Sort in the statistics grid
You can sort the statistics grid by selecting the up or down arrow in the header of a column where sorting is available. This will change ascending and descending sorting order.
Case duration influence
Case duration influence is a complex analytical insight that evaluates the influence of case-level attributes (including financial) on the mean case duration. The Power Automate Process Mining desktop app takes all case-level attribute values and, based on the mean duration of the cases having the specific case-level attribute value weighted by the volume of cases having this value, calculates the percentile influence of cases having this value on the overall mean case duration.
For example, if the Article is Software Licenses, the mean duration is longer than for article Hardware, but the influence on the overall case duration is not so strong. This is because the case frequency is much smaller for Software Licenses than it is for Hardware.
A positive percentage number in red means that the corresponding attribute value is slowing the process. A negative percentage number in green is making the process faster. Its influence on the mean duration is represented by the percentage value.
To access the case duration influence, select Case duration influence statistics from the selection control in the top left corner.