Note
Access to this page requires authorization. You can try signing in or changing directories.
Access to this page requires authorization. You can try changing directories.
Due to complex examples, this article uses some specific custom operators like DURATIONCALENDAR or FIRSTIF. No specific knowledge of these operators is required.
For easy examples of how to create custom metrics, go to Basic examples.
Recapitulation of previous examples
The following table provides descriptions and examples of custom metrics.
| Description | Example |
|---|---|
| Aggregation per attribute value (For example, result per activity = all events with the same activity value) |
AVG(Duration()) AVG(EventsPerAttribute, Duration()) AVG(EdgesPerAttribute, Duration()) |
| Aggregation within cases (result per single case) |
AVG(CaseEvents, Duration()) |
| Aggregation over cases (aggregation per attribute value, case is taken into calculation one time) |
SUM(CasesPerAttribute, invoTotal) AVG(CasesPerAttribute, Duration()) |
| Global aggregation (over all elements in view/process/business rule) |
COUNTIF(ProcessEvents, user == "Peter") AVG(ProcessEvents, Duration()) |
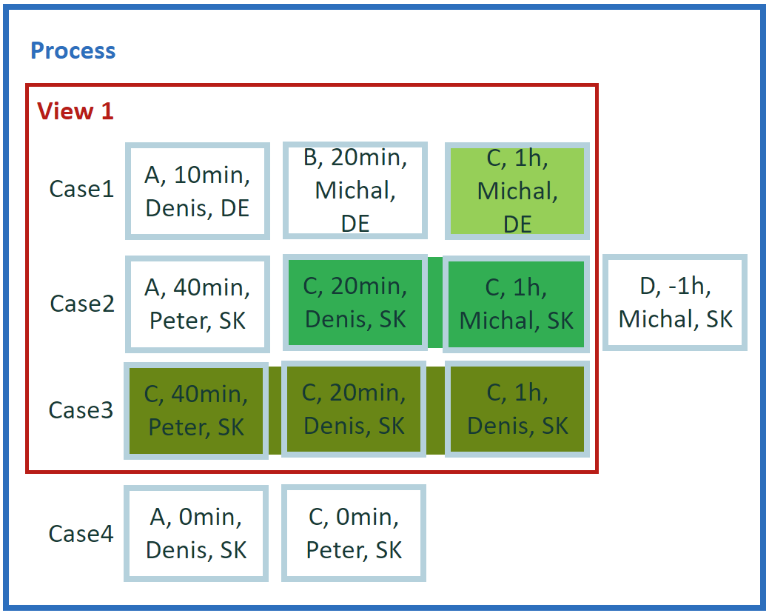
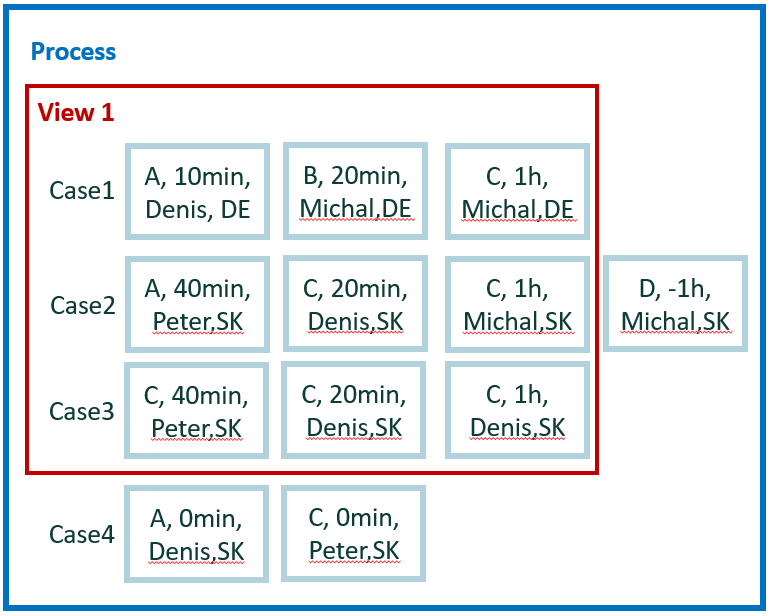
Dataset description
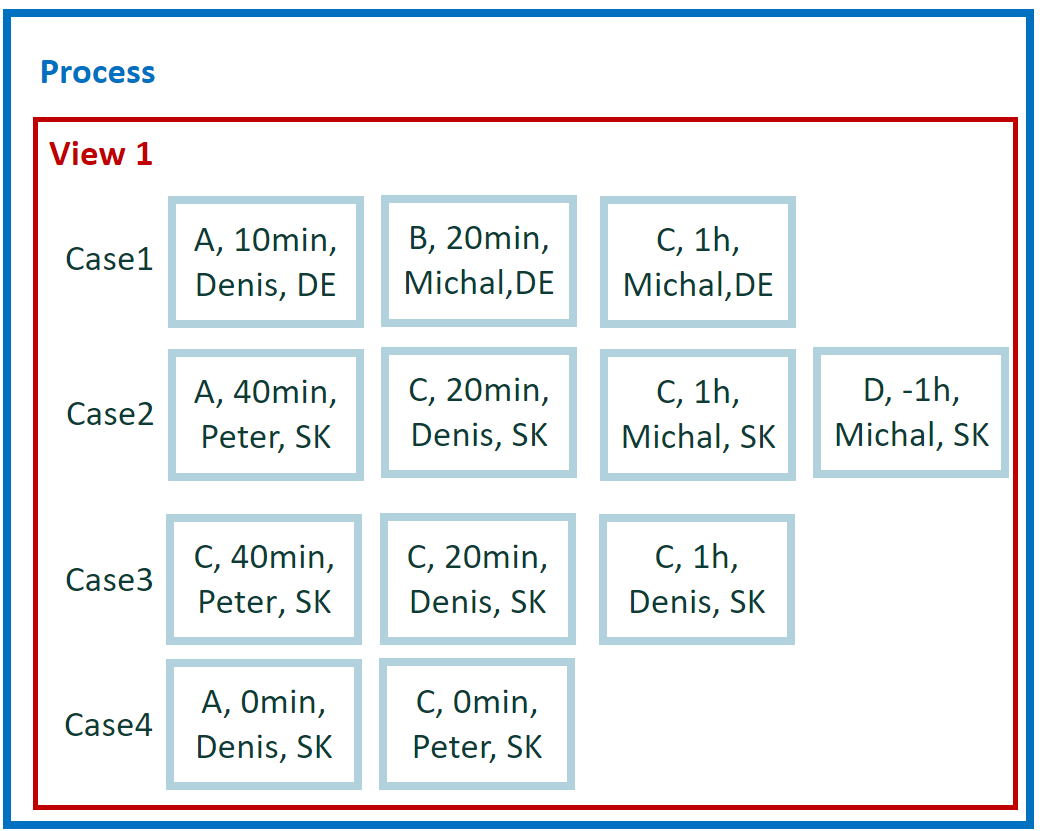
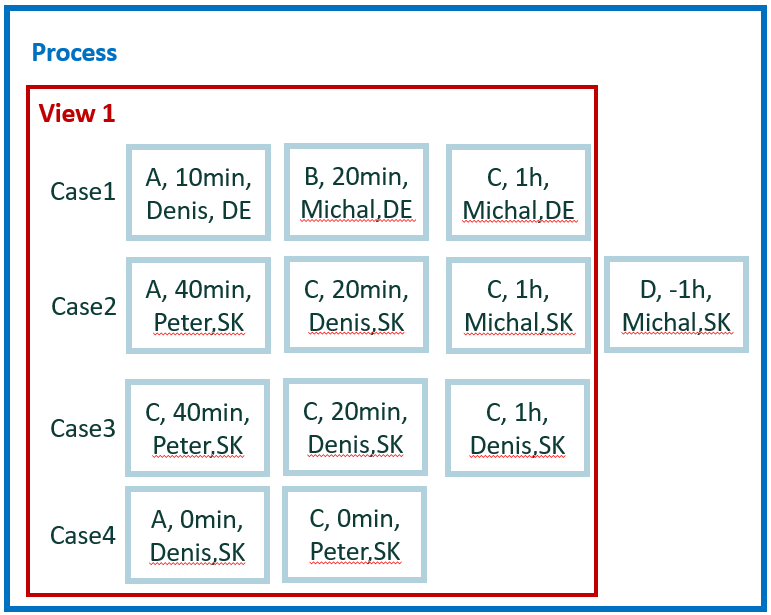
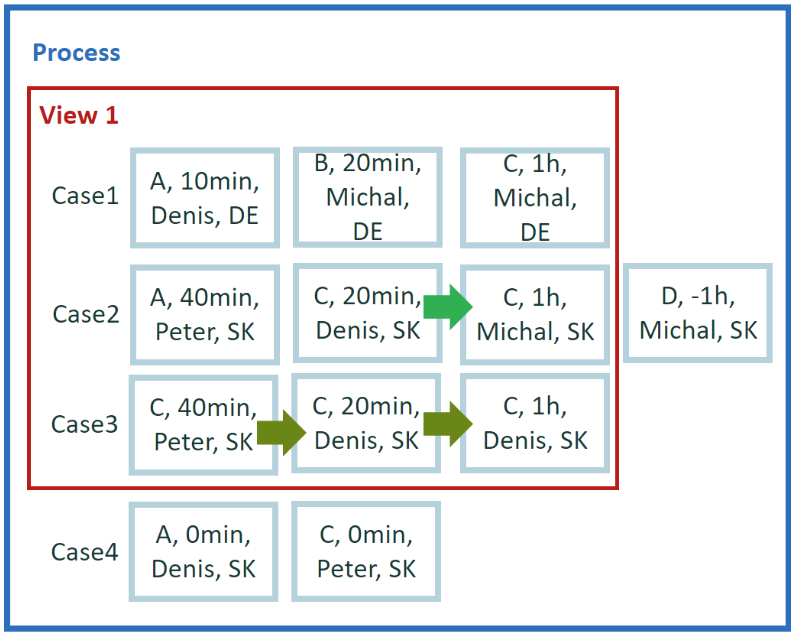
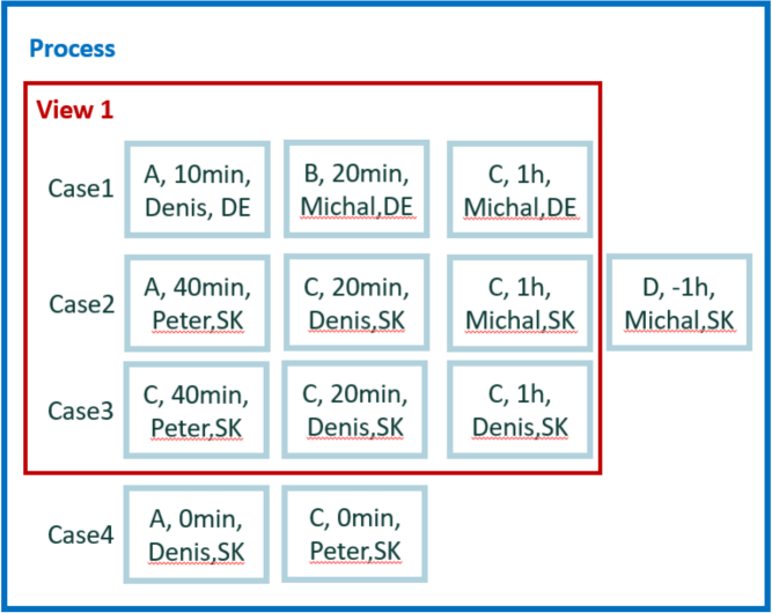
The new tiny data set is used for easy calculation for the remaining examples. It contains four cases and 12 events.
For easy manual calculations, we assume zero waiting time between events. Therefore, case duration is simple sum of events duration. Also, there's no parallelism among events.
In total, we have five attributes: activity, start, end, user, and county. Country is a case level attribute. The other attributes are event level.
1 Event level non-aggregation
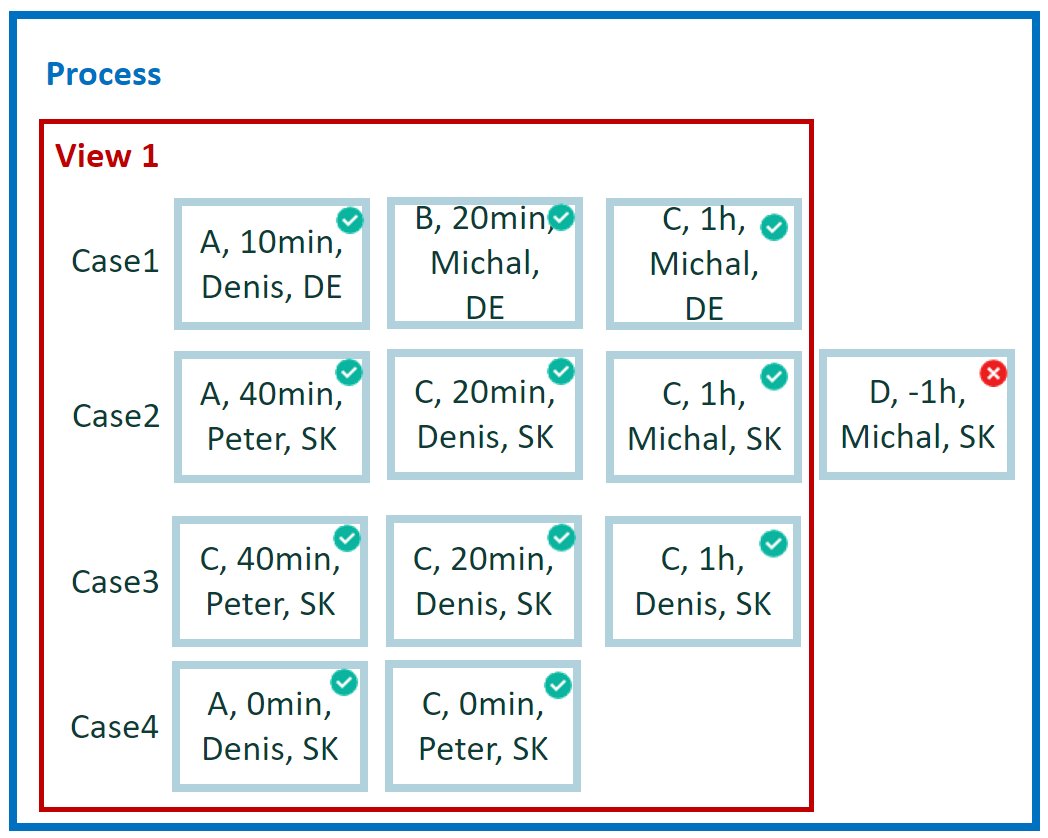
How do I filter out through CM events with positive duration? Evaluate single events and remove the ones with corrupted timestamps.
Calculation for example 1
Run and evaluate each event one-by-one. Generate a single result per event. No aggregation operation is required. Compare end and start attribute values in each event.
Result for example 1
Per each event:
- 1x False
- 11x True
Expression in custom metric editor
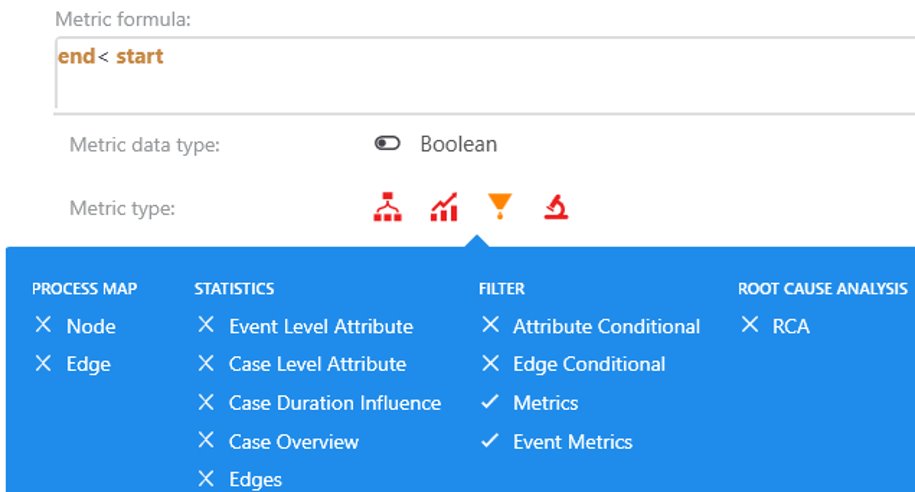
Usage for example 1
As we have a single result per each event in the current view, results are available only in screens that display and process an event metric:
Event metric filter
Case metric filter
The event metric filter is the obvious option, as it allows you to filter events based on attribute or metric values. Case metric filter by default uses case level metrics. It also allows you to select the event metric filter with additional specification if all or at least one event in the case has to meet the event metric. This switch allows the case level metric filter to switch to event level metrics.
Note
Event attribute values are displayed also in the Variant cases table panel, but this view displays only event attributes and doesn't display event metrics.
1.1 Event level non-aggregation (alternative)
Alternative: How do I filter out via CM events with negative duration? Instead of using attributes 'end' and 'start' write the expression using generic metrics.
It's a best practice to use generic metrics instead of process attributes.
Better performance
Portability
One formula fits more applications (for example, case overview and root cause analysis)
Aggregated form works with case/event/edge
Expression in custom metric editor
2 Case level non-aggregation
How do I filter out cases with empty (zero) duration? After we removed corrupted events, you need remove invalid cases. Remove complete cases with zero duration.
Calculation for example 2
Run and evaluate each case one-by-one. Generate a single result per case. As there is operator Duration(), which is applied on case level, no aggregation operation is required.
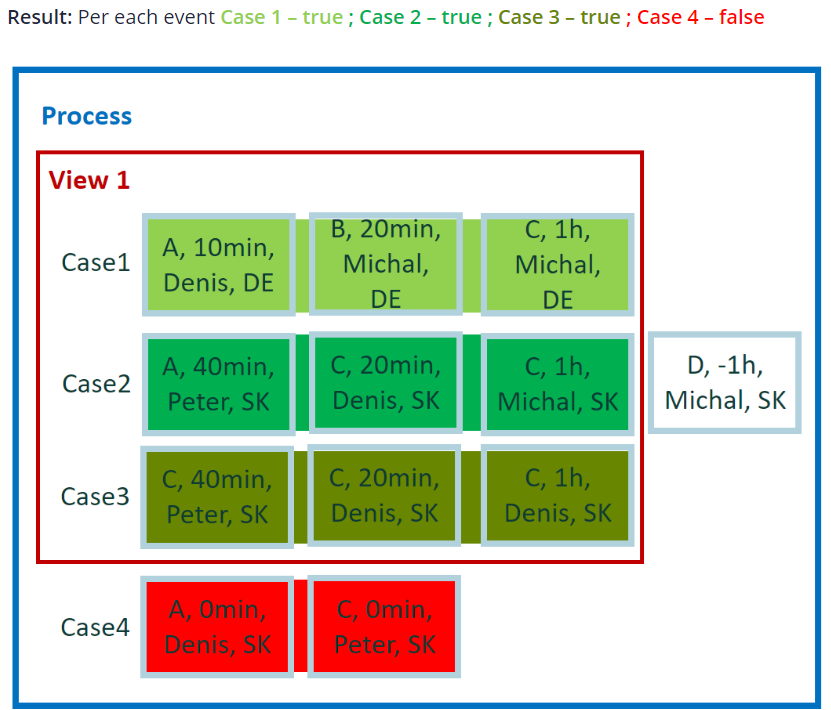
Result for example 2
Per each event:
- Case 1 - true
- Case 2 - true
- Case 3 - true
- Case 4 - false
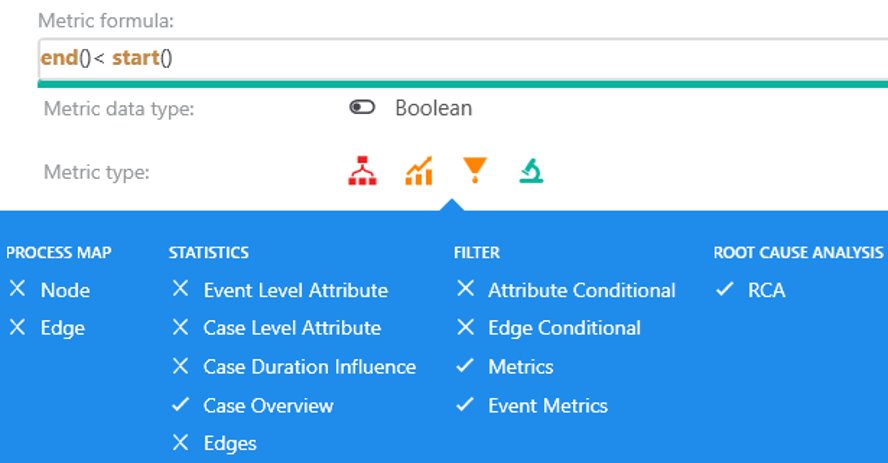
Expression in custom metric editor
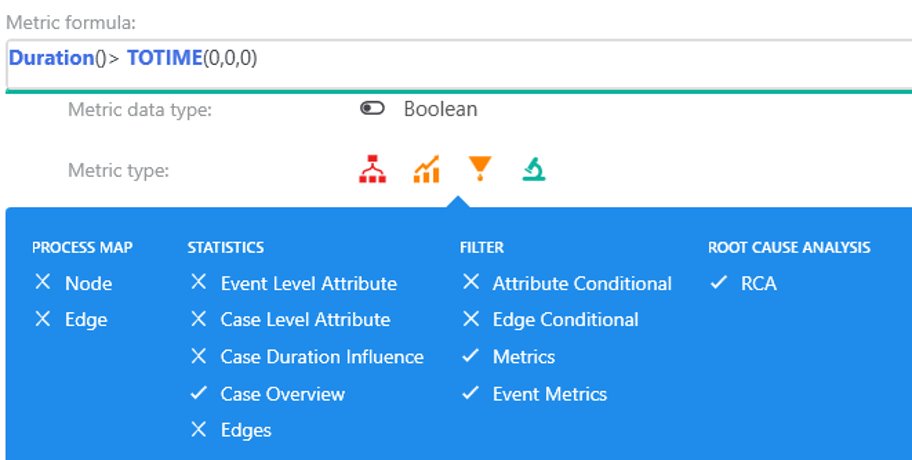
Usage for example 2
As you have single result per case, results are available only in screens that display results per case:
Case metric filter
Statistics case overview
Root cause analysis
Event metric filter
Usage of case level metric (aggregated or non-aggregated) in Statistics Case overview, Root cause analysis or Case metric filter is no surprise.
To answer why there is an indication for usage for Event metrics, it doesn't offer any advanced setting to switch to case level. The answer is in the expression formula, which uses Duration() operator. The Power Automate Process Mining desktop app offers the same operator Duration() on event and on case level. Therefore, the same expression is applicable on both the case and event level.
3 Edge aggregation
What's the number of user changes per path (edge)? Instead of looking on events values, you'll ask for changes occurred between events. So you're looking for result per edge.
Edge (path): Transition between two directly followed events.

Calculation for example 3
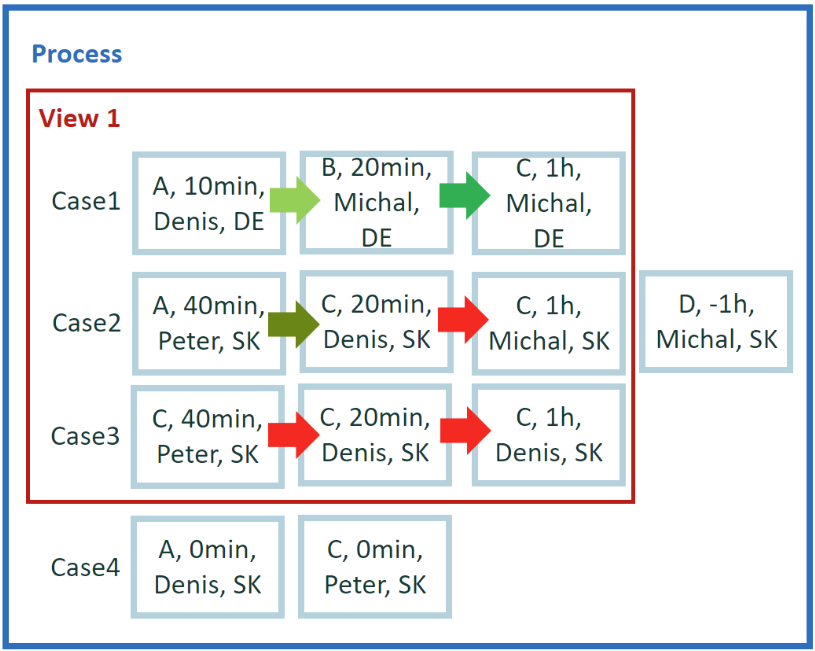
You're evaluating how often you've changed when case was progressing though events. You want to identify on which transitions (edges) occurs user switching. First, identify set of edges in our data. For case 1, there are two edges A->B and B->C. In case 2 we have A->C and C->C. For case 3, you only one edge C->C. In total, you have four (4) unique edges (based on activity values) - A->B, B->C, A->C and C->C. Per each of these edges, you need to aggregate number of user changes. For example, you have only one instance of edge B->C where user Michal on starting event and also on the on ending event, so there is no user change for this edge at all.
Result for example 3
- A->B = 1
- B->C = 0
- A->C = 1
- C->C = 2
Expression in custom metric editor
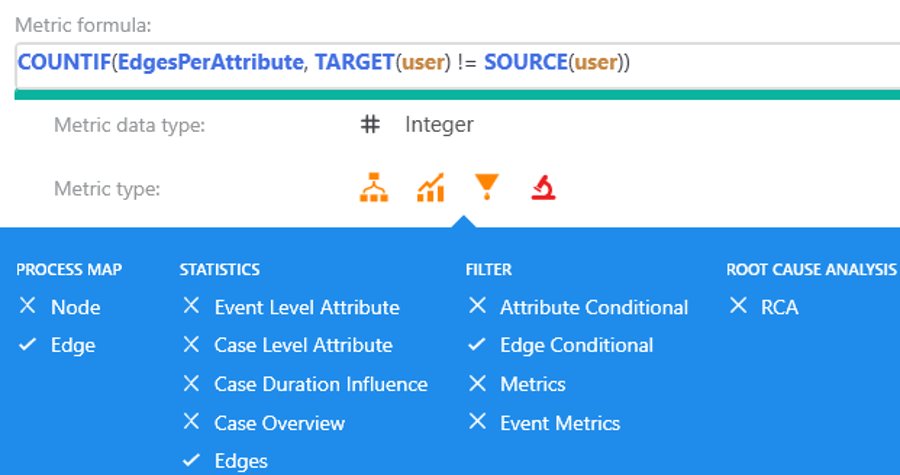
Operators TARGET() and SOURCE() return values of the requested attribute for ending and starting node to the actual edge.
Usage for example 3
Defined custom metrics generates result per edge (attribute) value, so it's applicable everywhere when aggregated results per edge are used:
Process Map edges
Statistics edges
Edge conditional filter
4 Case events aggregation II
In the previous section, you've had a simple example of using CaseEvents aggregation. Here you'll take another example with a more complex formula.
What's the duration from first C start and last C end activity in cases? Youre looking for a result per case and to do some conditional aggregation over case events.

Calculation for example 4
Run across all available events within its case. Get the first and last activity 'C' in a case and measure the duration between start of first one and end of last one.
Result for example 4
- Case 1 = 1 hour 00 minutes
- Case 2 = 1 hour 20 minutes
- Case 3 = 2 hours 00 minutes
Expression in custom metric editor
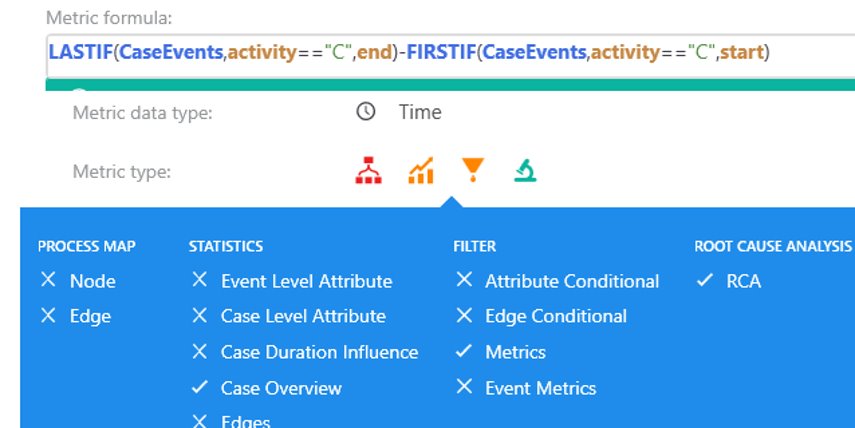
This time the expression is little more complicated but shows how to combine multiple aggregations into single formula. Operators FIRSTIF() and LASTIF() are aggregation operators, which return first/last event based on input criteria over defined calculation scope (this time CaseEvents).
Usage for example 4
Application of custom metric follows the standard requirements for single case aggregation (regardless complexity of expression).
4.1 Case events aggregation II (alternative)
What's the duration from first C start and last C end activity, but calculated only over working hours? The example is the same as the previous one, but here you want to calculate time difference only over working hours. Previously, the simple difference between timestamp values was enough.
Calculation for example 4.1
Run across all available events within its case. Get the first and last activity 'C' in a case and measure the duration between start of first one and end of last one. For measuring the duration, use working hours defined in the applied calendar.
Result for example 4.1
- Case 1 = ???
- Case 2 = ???
- Case 3 = ???
Expression in custom metric editor

To calculate duration over working hours, the DURATIONCALENDAR() operators have been used. Operators to find first and last events are used as operator arguments creating a nested expression. Notice the complexity of the expression doesn't affect or modify the selected calculation scopes.
Usage for example 4.1
Application of custom metric follows the standard requirements for single case aggregation regardless complexity of expression.
5 Categorical vs. quantitative results
Does the case contain C->C path? This is simple question when you need to categorize single cases based on existence edge C->C.

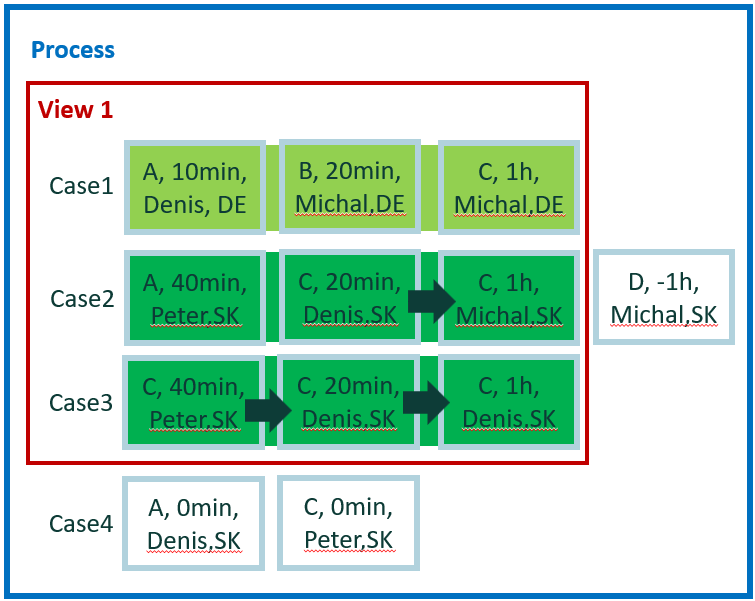
Calculation for example 5
Run across all available edges within its case. If case contains C->C edge, it passes the criteria. Results are generated per case. Count of such edges isn't important.
Result for example 5
- Case 1 = False
- Case 2 = True
- Case 3 = True
Expression in custom metric editor
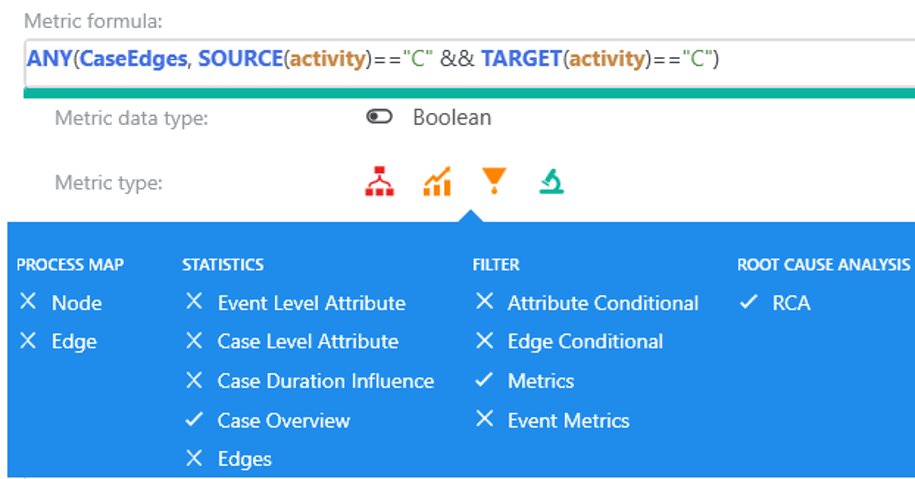
Operator ANY() returns boolean true/false value when at least one element in a given context meets the criteria. See also operator ALL()*k, which returns a true value when all elements in the given context meets the criteria.
Usage for example 5
Application of custom metric follows the standard requirements for single case aggregation:
Case Metric filter
Root cause analysis
Case overview statistic panel
5.1 Categorical vs. quantitative results (alternative)
How many C->C paths are within the case? Change the previous question from if case contains edge C->C to how many such edges are there.
Calculation in example 5.1
Run across all edges within its case. Count any edges C->C found. If no such edge is found, count is zero for given case.
Result in example 5.1
- Case 1 = 0
- Case 2 = 1
- Case 3 = 2
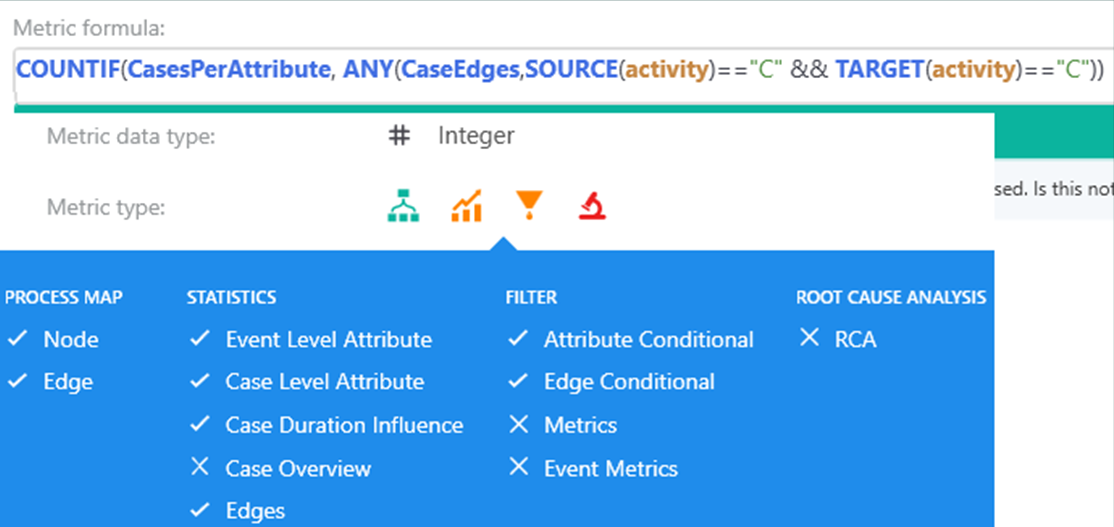
Expression in custom metric editor
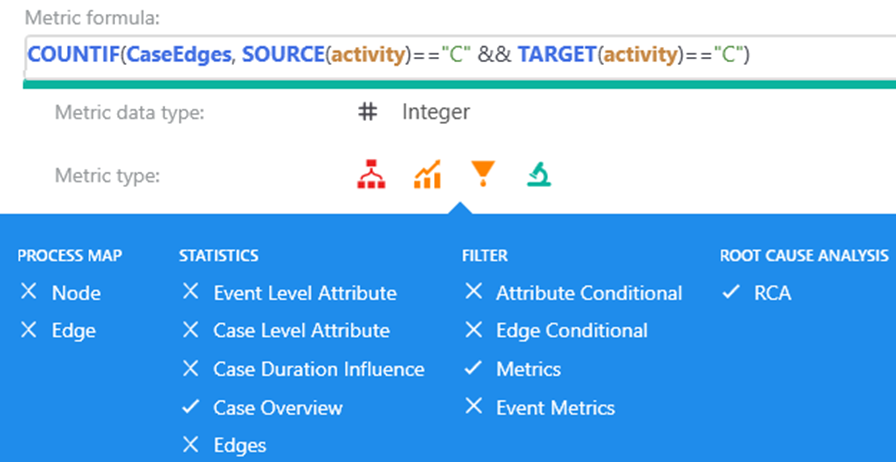
In comparison to the previous formula, you've just replaced operator ANY() with COUNTIF().
Usage for example 5.1
Application of custom metric follows the standard requirements for single case aggregation.
6 Event or edge-case aggregation using case-wide context
How many cases in DE contains edge C->C? This request contains two values. The first one is the value of country attribute 'DE' and second one is the value for edge 'C->C'.
The limitation for 'C->C' edge describes the domain requirement and why country 'DE' is one of attribute values.
Calculation for example 6
Why not calculate the result for all countries/regions? At first, re-think the original question. It's possible to generate results per attribute value (for example, for attribute country), but there's no way (except for business rules) to create a calculation for a single attribute value. In your using business rules, you can skip this section. Knowing this, you can update the original question to generic form:
How many cases contains C->C edge per country?
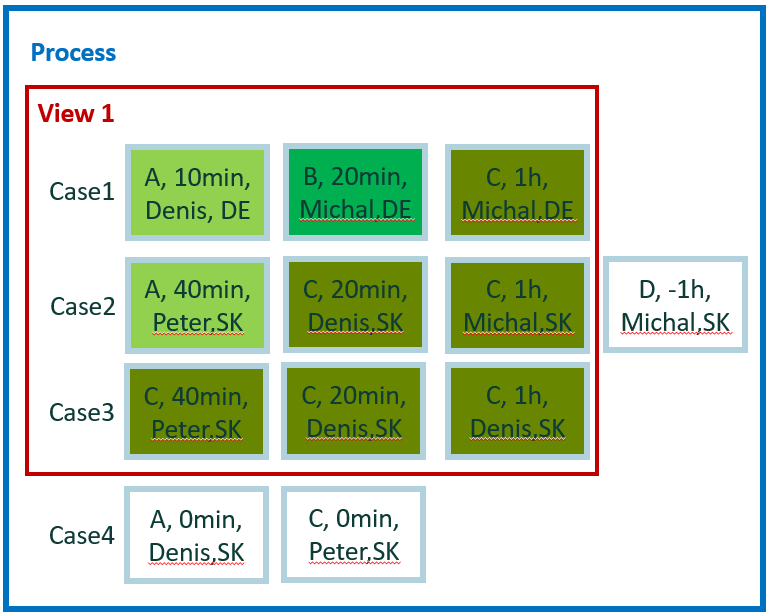
Now the calculation consists of two steps. At first, run though each case and check existence of 'C->C' edges. The exact number of 'C->C' edges in the case isn't important. After it, in the second step, aggregate the results per single case according to a value of the case level attribute country. There are two values 'DE' and 'SK', so there will be two results.
Both cases for country attribute 'SK' contain 'C->C' edge, so the result for 'SK' is 2. The total number of edges is 3, but we don't count number of edges.
Result for example 6
- DE = 0
- SK = 2
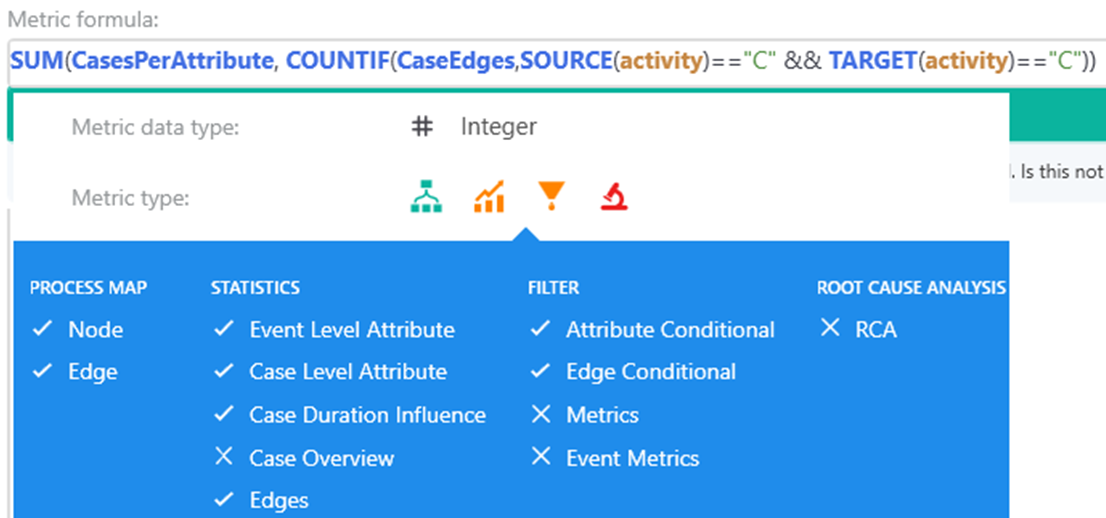
Expression in custom metric editor
The nested formula contains a two-step aggregation. The inner one runs over all edges within case. The outer one aggregates cases by attribute value. The outer aggregation uses context CasesPerAttribute because the result per case is exactly one. The context EventsPerAttribute also groups the result per attribute value, but it may involve the same case multiple times (per each involved event) into the result.
Usage for example 6
Custom metric is applicable on every screen where values are displayed per attribute value. Attribute value may be grouped using event level (EventsPerAttribute) or case level (CasesPerAttribute) context. These two calculation contexts provide a different calculation, but share the same applicability of the calculation (custom metric):
Process map (both nodes and edges)
All statistics except for Case overview, which requires results per case.
Attribute and edge conditional filters.
For an expression with nested aggregations, the most outer aggregation context determines the application in the Process Mining desktop app.
6.1 Event or edge-case aggregation (alternative)
Convert the previous example from categorical evaluation to quantitative.
How many C->C edges are in cases in DE? Convert the question to a generic form: How many C->C edges are in cases per country?
Calculation in example 6.1
Again, the calculation consists of two steps. At first, run though each case and count 'C->C' edges. After it, in the second step, aggregate the results per single case according to the value of case level attribute country. There are two values: 'DE' and 'SK', so there will be two results.
Both cases for country attribute 'SK' contains 'C->C' edges. The result for 'SK' and total count for these edges is 3 (1 + 2).
Result in example 6.1
- DE = 0
- SK = 3
Expression in custom metric editor
The expression again contains two step (nested) aggregation. The inner one runs over all edges within case and the outer one aggregates cases by attribute value.
Usage for example 6.1
Custom metric is applicable on every screen where values display per attribute value.
7 Switch from event to case context
What's average activity duration to case duration? How much time do we spend in average in activities is one of standard performance metrics.
But what if we need to calculate the average ratio of how much time we spend in activities in comparison to case duration? Where do we spend relatively the most time? Is it over the threshold?
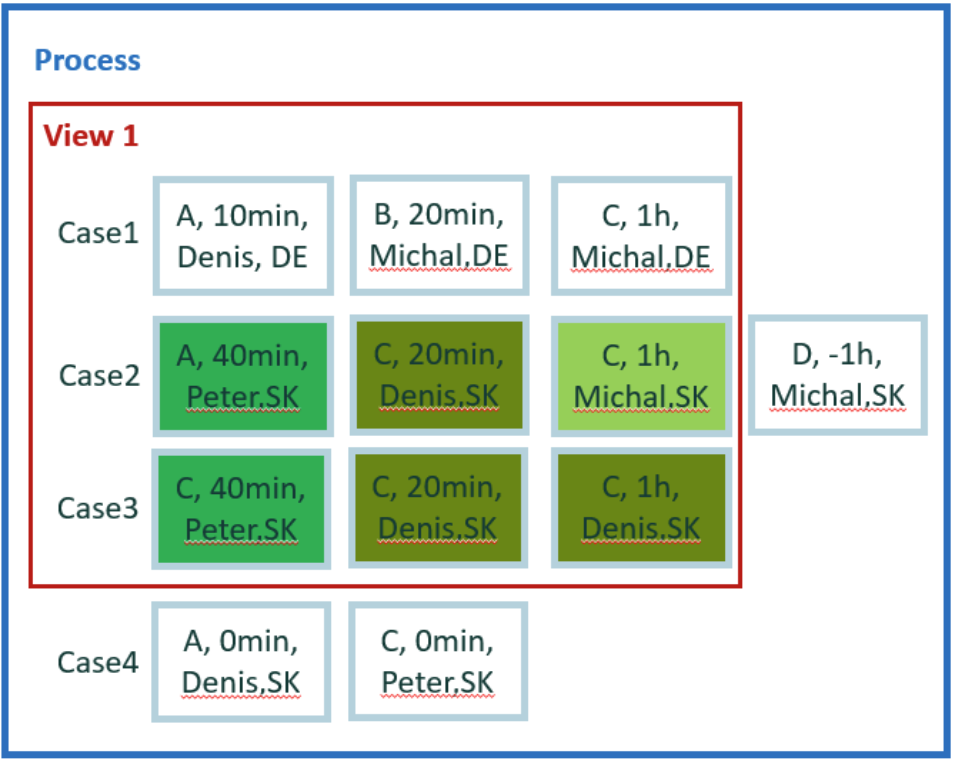
Calculation for example 7
What exactly are we going to calculate? We want result per activity, so we get results per 'A', 'B', and 'C'. Activity 'B' is only in case 1. Case 1 duration is 90 minutes and activity 'B' duration is 20 minutes. The result for case 1 and activity 'B' is 20/90 = ~ 0.22. Because 'B' isn't included in other cases, this is also the final result for 'B'.
Do the calculation for activity 'A', for case 1 the ratio is 10/90, for case 2 the ratio is 40/120, with average value 0.22 (0.11 + 0.33 divided by 2). In the same manner, we calculate 6 individual results per each of events 'C' and make the average.
In terms of aggregation, it's nothing new. We generate results per attribute value, but for calculation, we used metric (value) from case.
Result for example 7
- A = 0.22
- B = 0.22
- C = 0.375
Expression in custom metric editor
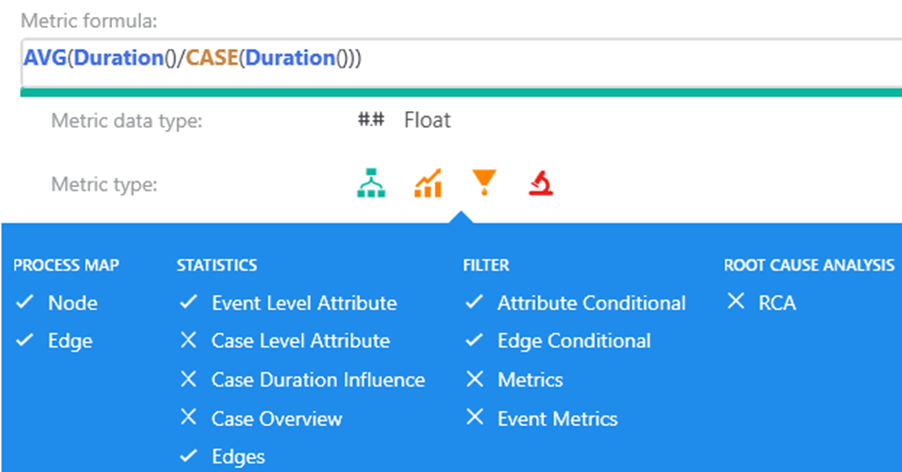
The expression is simple, but uses the important operator CASE(), which allows you to switch context for case level. This is the only way how to calculate event level metrics and ask for metrics (values) from its case.
Usage for example 7
Application of custom metric follows the standard requirements for aggregation per attribute value. Because the expression uses Duration() and not attribute value, it's also applicable on edges (both in process map and statistics).
8 Event-case-event aggregation
Generic relation between events inside case.
How many events done by Michal were in cases touched by Peter? Imagine 'Peter' is a senior team member who is usually involved only in some troubles. We want to know how many times 'Peter' had to perform action when another user 'Michal' was involved in the same case.
Change the question to a generic form: How many events per user were done in cases with Peter?
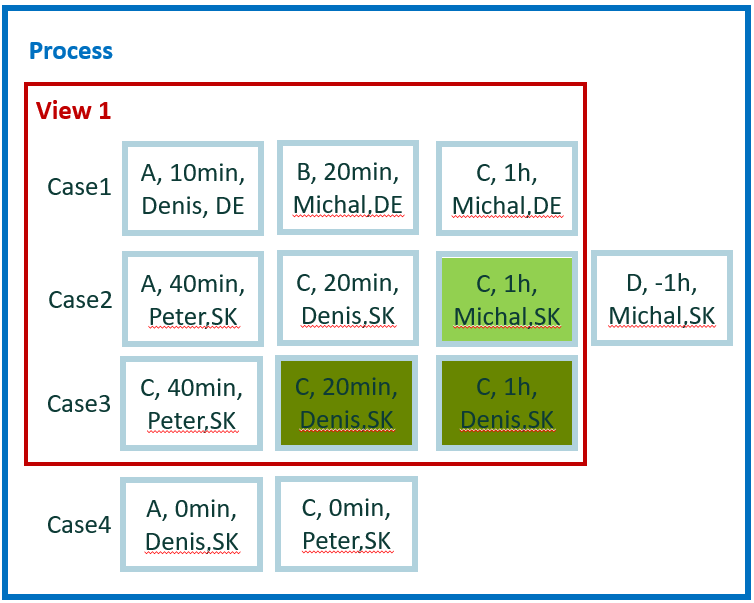
Calculation in example 8
Event is valid for this question, if it's within case, where there's at least one event done by user 'Peter'. Evaluate each event and group results per attribute user value - 'Michal', 'Peter', and 'Denis'.
Result in example 8
- Michal = 1
- Peter = 2
- Denis = 3
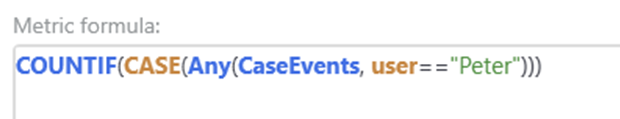
Expression in custom metric editor
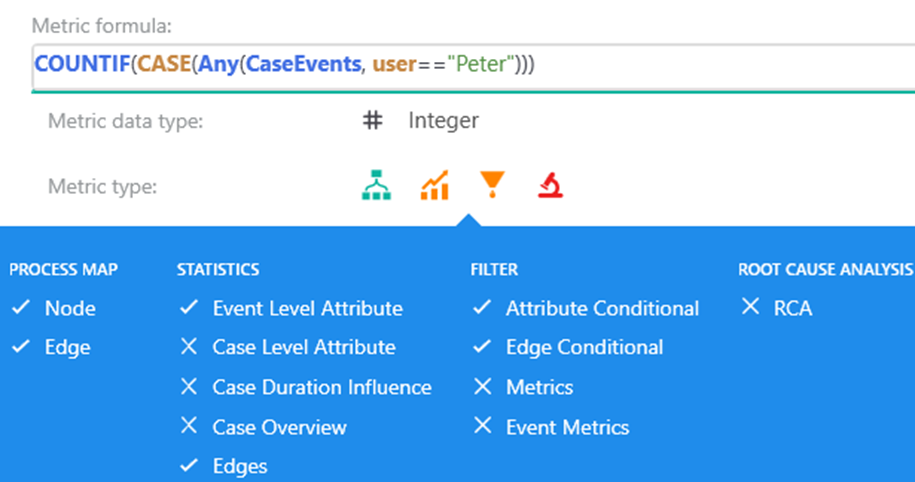
Expression is short but requires some knowledge to understand it. The most inner part Any(CaseEvents, user=="Peter") is a simple result per single case. It evaluates if case contains user 'Peter' or not. The most outer part COUNTIF() does simple aggregation by attribute value. The requirement is to do aggregation on event level attribute user, but the calculated value is case level metric. Switch between these two contexts is done by CASE() operator in the middle.
Note
In this example, the EventsPerAttribute context isn't specified. Custom metric then applied implicit calculation context.
Usage for example 8
Application of custom metric follows the standard requirements for aggregation per attribute value.
8.1 Event-case-event conditional aggregation
Relation between two event level attributes within case with condition.
How many times Michal worked on repeated C with Peter in case? This is a similar question to previous one, but there is added conditional.
Convert the question to a generic one: How many times Michal (per user) worked on repeated C in cases with Peter?
Calculation for example 8.1
Evaluate each event and group results per attribute user value: 'Michal', 'Peter', and 'Denis', like in the previous example. Event evaluation is more complicated, as there's limitation only for repeated activities 'C'.
In case 1, there aren't repeated activities 'C', in case 2 is one repeated activity 'C' done by 'Michal', and in case 3 are two repeated activities 'C' done by 'Denis'.
Result for example 8.1
- Michal = 1
- Peter = 0
- Denis = 2
Expression in custom metric editor
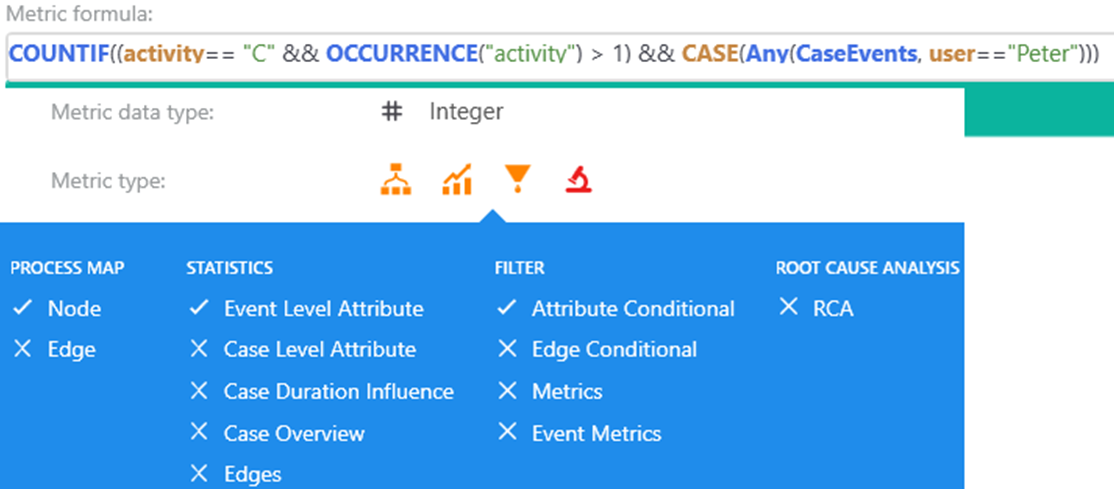
Two step (nested) aggregation—inner one evaluates the single case, the outer one group results per attribute value. Conditions are also separated between these to aggregation. The inner one handles case requirement if it contains user 'Peter'. The outer one groups events so it contains the event related condition if activity is 'C' and if it is repeated.
Operator OCCURRENCE() returns occurrence index of a given event attribute value within the case.
Usage for example 8.1
Application of custom metric follows the standard requirements for aggregation per attribute value.
9 Extra: Value specific custom metrics
Is it possible to avoid operator
CASE()? Is there way to simplify the expressions? Yes, it is, but there are tradeoffs. See the following example.How many events done by Michal (per user) were in cases with Peter? The same question like in 8 Event-case-event aggregation.
Is it possible to answer question without using
CASE()operator?
Generic solution using CASE() operator
It is possible to skip CASE() operator at the cost of creating value specific custom metric? In such a custom metric, we have to specify requested custom value 'Michal' and have drop calculations for other attribute values (per user) and grouping by another attributes.
Custom metric limited to specific custom value
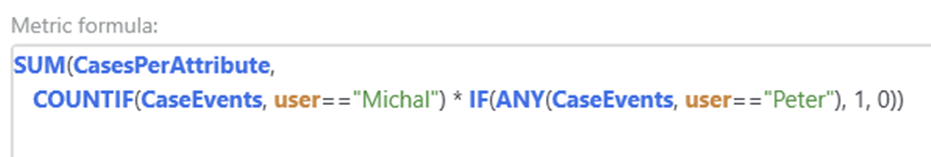
Reasoning behind the latter one:
Select cases with ‘Peter' (operator
ANY())Convert boolean result to numeric zero or one (operator
IF())Count number of activities with requirement (operator
COUNTIF())Apply result per case per each case exactly once (calculation context CasesPerAttribute)
At last Sum count of events per case (operator
SUM())
The custom metric without CASE() operator is maybe easier to read by humans, but it brings some disadvantages.
Per each resulting attribute value ("Michal"), we need a separate custom metrics. For other attribute values, the metric returns zero.
Operator
COUNTIF()is locked for user attribute. Results grouped by another attribute, for example, country requires change of condition to specific country code, for example,COUNTIF(CaseEvents, country == "DE").