Events
Mar 31, 11 PM - Apr 2, 11 PM
The ultimate Microsoft Fabric, Power BI, SQL, and AI community-led event. March 31 to April 2, 2025.
Register todayThis browser is no longer supported.
Upgrade to Microsoft Edge to take advantage of the latest features, security updates, and technical support.
The following examples show various calculation methods for custom metrics with a focus on proper context/aggregation selection. For a complete list of supported operators (like statistical, calendar or math functions), go to Custom metrics.
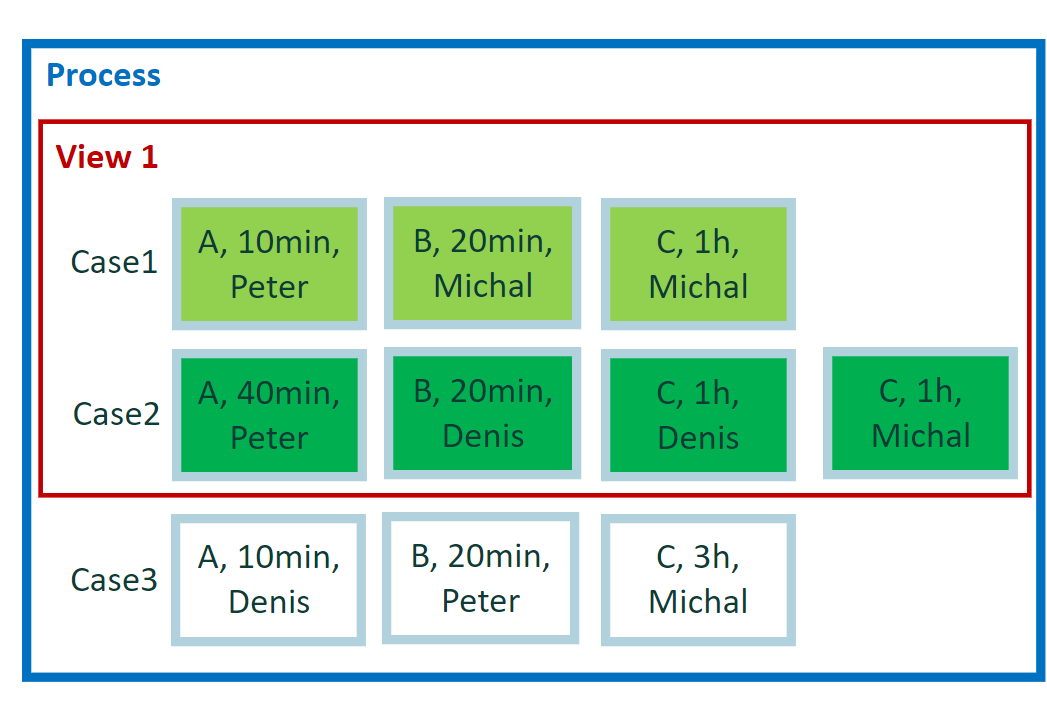
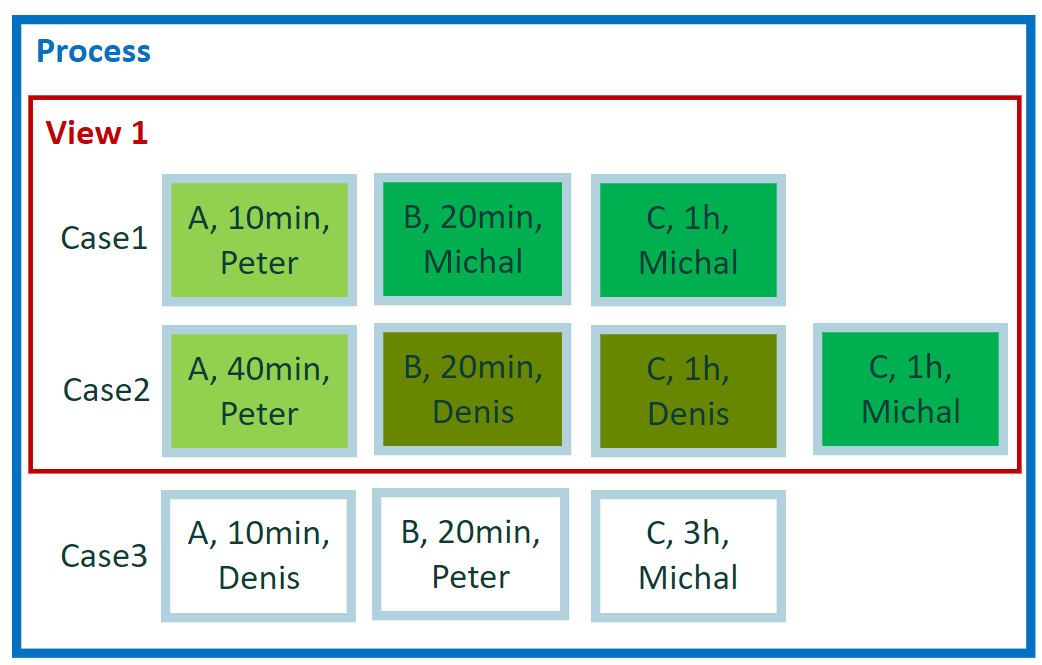
The examples use a tiny data set. It contains three cases, 10 events, and there's one view defined—two out of three cases. For easy manual calculations, we assume zero waiting time between events; therefore, case duration is a simple sum of events duration. Also, there's no parallelism among events.
What's the total duration of events in the view? We're looking for a single result for the whole data set in actual view.
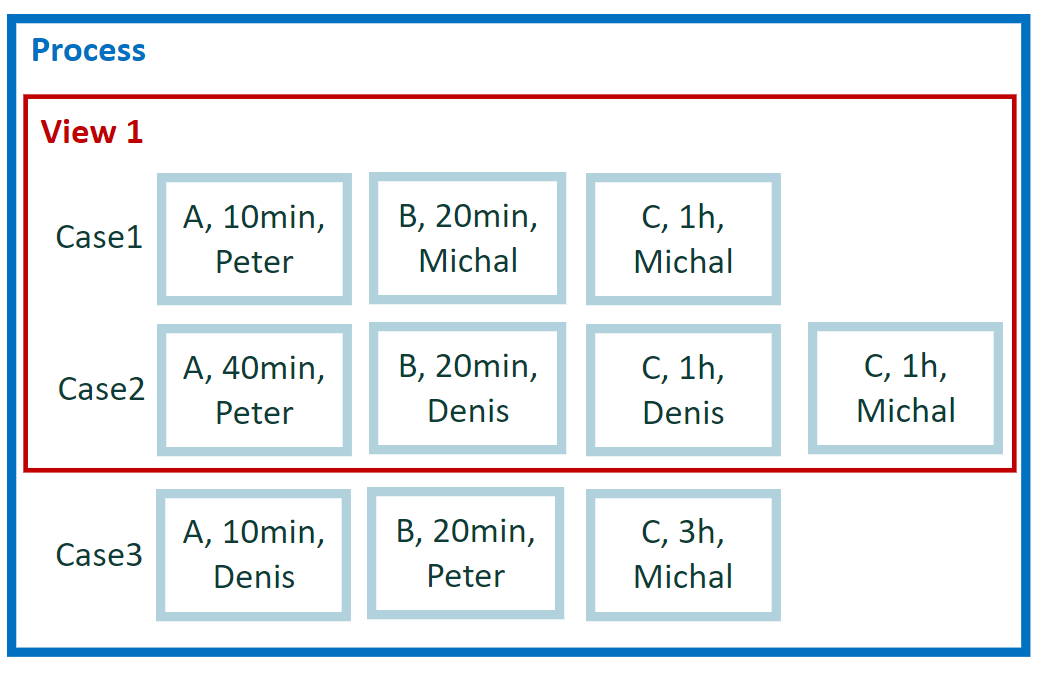
We need to run across all available events in the view. Assignment of events to cases isn't taken into account. Such calculation provides single result in the whole view. When we manually sum all event duration, we arrive at the requested result.
4:30 hours (events in case 1 = 90 minutes + events in case 2 = 180 minutes = 270 minutes, in total 4:3 hours)
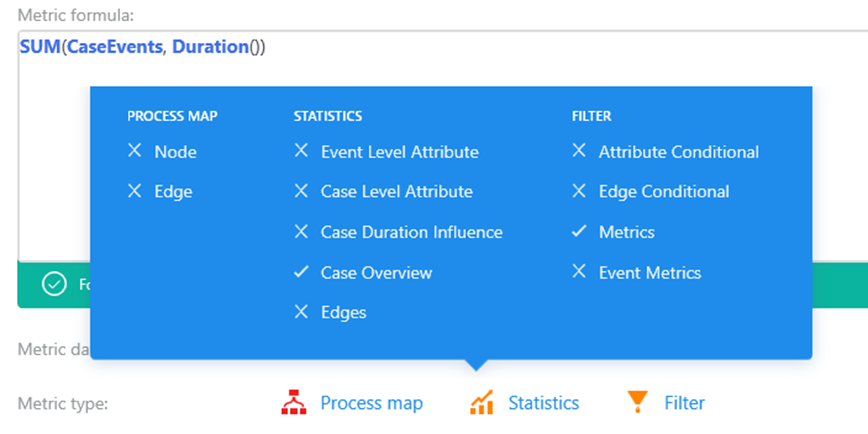
Expression in the custom metric formula
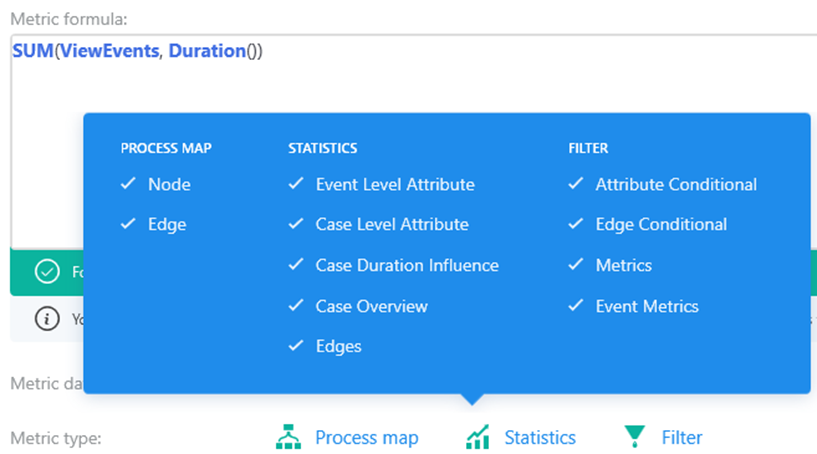
The custom metric editor indicates the result is applicable everywhere in the Power Automate Process Mining desktop app. The reason is that a single result is a numerical constant, which can be used in any expression and any place where the metric is displayed. Such metric - returning single value may be displayed in process map, statistics for case overview, statistics for attributes, filters, or root cause analysis.
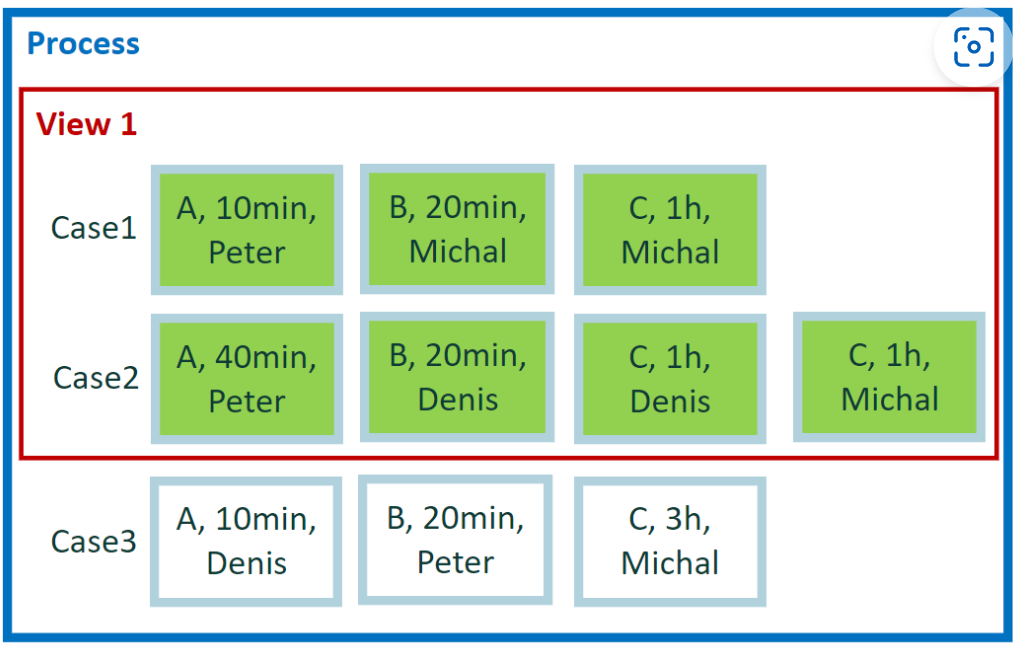
What's the total duration of events in the process? We're looking for a single global result, but not on scope of view, but on scope of complete process data.
In this example, we need to run across all available events in process regardless cases or any filtering by view. Such calculation provides single result in whole view (process). When we manually sum all event duration, we arrive at the requested result.
8:00 hours (events in case 1 = 1 hour 30 minutes + events in case 2 = 3 hours + events in case 3 = 3 hours 30 minutes, in total 8:00 hours)
Expression in the custom metric editor
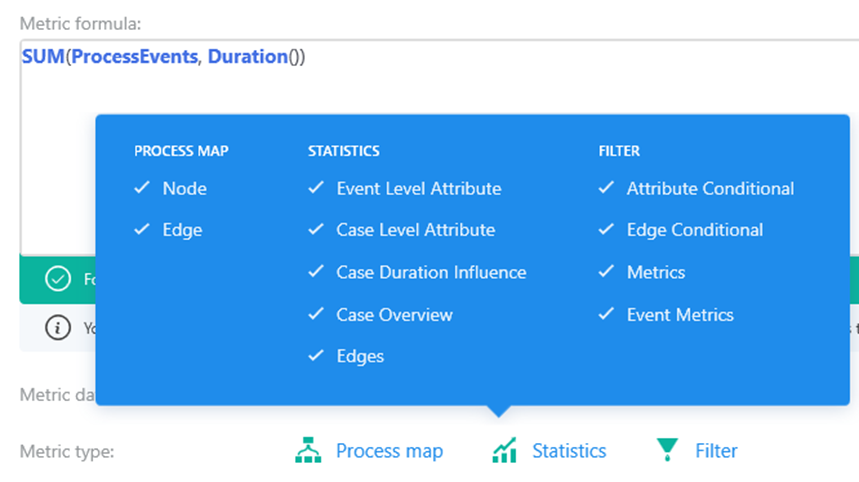
Result is applicable everywhere in the Process Mining desktop app. The same logic for application as for previous example.
What's the total duration of events per case? We're asking for the result per case, not a single global result.
We need to calculate events duration per single case. As the view contains two cases, the number of results is two (2). Each result is calculated as sum of event duration across the single case.
The result is per case. It's calculated by events in case1 and events in case2, but most important is that the result is per case.
Expression in the custom metric editor
Calculation context CaseEvents (and CaseEvents) is very useful as it allows to create additional case level metric calculated using the case events. User is then able to evaluate the single cases based on calculated value.
As we have single result per each case in current view, results are available only in screens with results per single case:
Case Metric filter
Case Overview Statistic panel
Root cause analysis
Results for CaseEvents or CaseEdges are not applicable on Process map. Theoretically Process map is able to display results per case, but default aggregation (industry standard) is per activity.
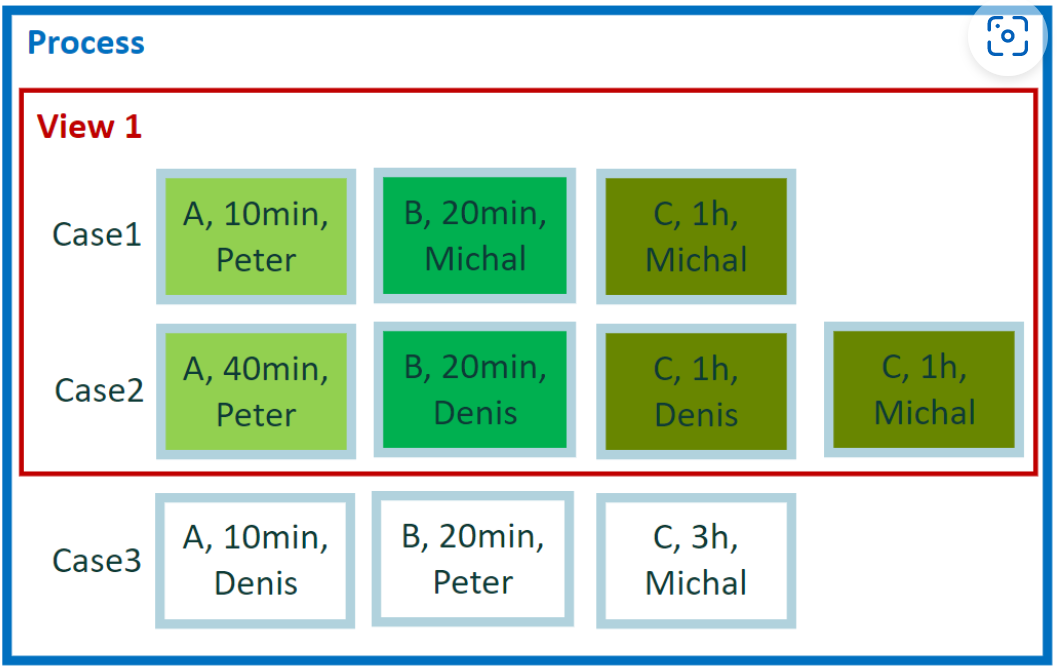
What's the total duration per activities? We're interested in evaluation of activities. This is a different calculation compared to previous example.
How do you calculate results per activity properly? We're not concerned with the distribution of events among cases. All we take into consideration is distribution of events among activities. All events in view are grouped according to activity value. We have activities 'A', 'B' and 'C'. Per each set of events, we calculate result separately - sum of event durations.
Expression in the custom metric editor
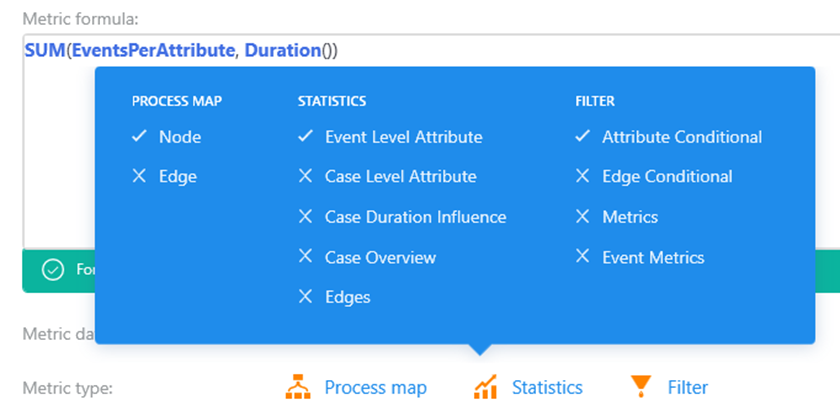
We have single result per activity in current view. Results are available on screens with aggregated events per activity value:
Process Map (nodes)
Statistics – Activities
Attribute conditional filter (To learn more, go to 7 Bonus: Attribute conditional filter.)
Process map and Statistics panels for any attribute (including activity) share the same calculation scope. Despite different visuals, both screens display results grouped by activity value.
Attribute conditional filter contains the attribute aggregation inside the single case. For example, Case 2 contains two events with activity 'C'. Attribute conditional filter does aggregation over these events and aggregated value is evaluated. To learn more about behavior for this filter go to 7 Bonus: Attribute conditional filter.
What's the total duration per user? What we care about is the total time spend, not by activities but by users.
This example is similar to previous one. We again take into consideration distribution of events among one of its attributes. This time, it's user attribute. We have users 'Peter', 'Michal' and 'Denis'. Per each set of events, we calculate result separately - sum of event durations.
Expression in custom metric editor:
Why the expression is the same as for previous one? It's simple. The calculation per attribute value is the same for any event attribute. Activity is just a special mandatory event attribute. All metrics calculations are applied in the same way for activity as for any other attribute.
We again have single result per attribute value in current view. Results are available on screens with aggregated events per attribute value:
Process map (why?)
Statistics – any attribute
Attribute Conditional filter ((To learn more, go to 7 Bonus: Attribute conditional filter.)
If you want to see results per user in the Process Mining desktop app, go to Statistics for user attribute. There are displayed events aggregated by user attribute. What if we open process map or statistic panel for another attribute. In such case the results will be aggregated by selected attribute. For example, in Process map, it's by default activity attribute.
What's the total duration of cases processed per user? We're again interested in results per user, but this time we want to know total duration of cases in which users were involved.
The calculation logic for this request is very similar to previous one. We group users by value of user attribute. We have users 'Peter', 'Michal' and 'Denis'. The difference is in the values we are going to summarize. Per each event, we take duration of case, not duration of event. User 'Denis' worked only on case 2, so the answer for him is duration of case 2. Users 'Peter' and 'Michal' were involved in both cases, so the answer is combined the duration of case 1 and case 2.
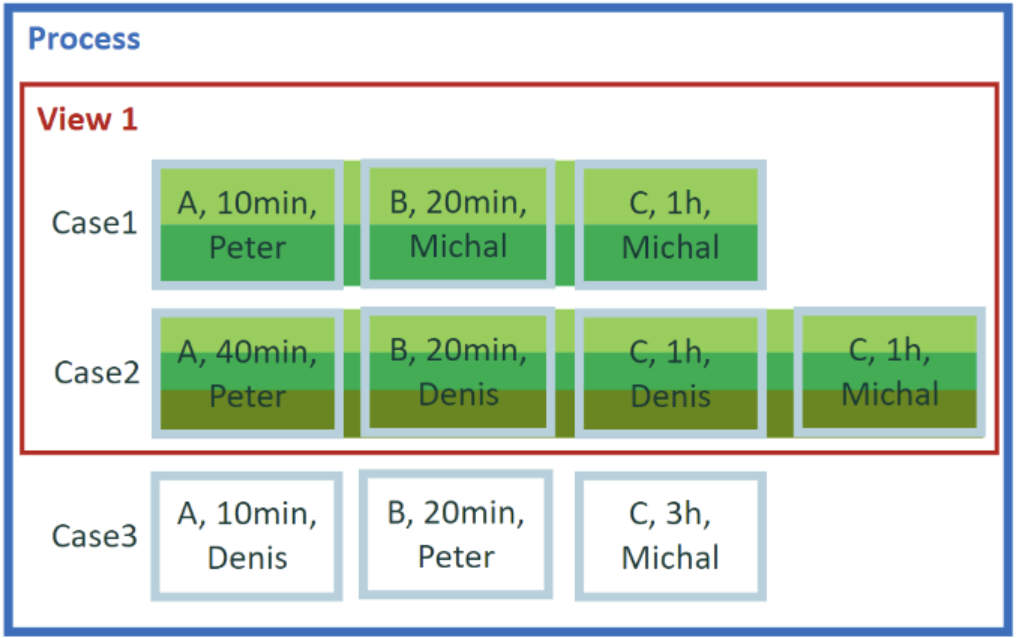
As you can see, we don't care how many events were done by user in case. One or multiple events done by given user, the length of case isn't obviously changed. We don't want to take duration of single case multiple times for the same user. Result is calculated per user (attribute value), takes case level metric (duration of case, no duration of events), and takes each case into result once at most.
While this calculation seems odd, it is a very basic calculation used for standard financial case level metrics. Total of invoice is still the same regardless how many events, how many reworks occurred in the case. Invoice total is not multiplied because some events - activities or users occurred multiple times in invoice processing.
Expression in the custom metric editor
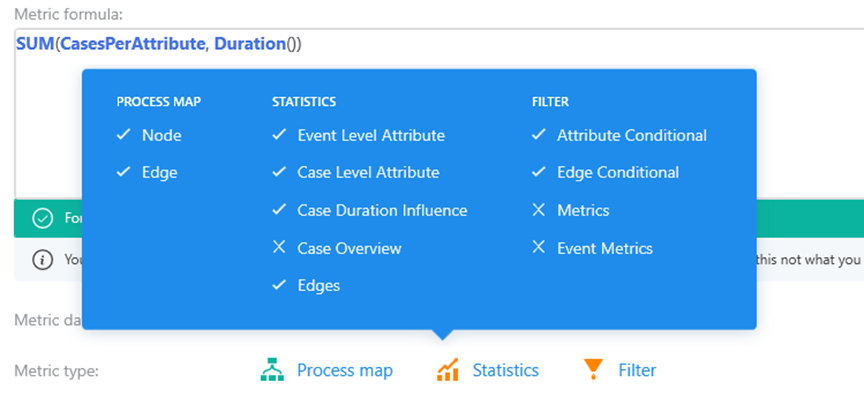
Single result is generated per attribute value so all displays for attribute aggregations are available. As we use case level metrics the results are also applicable for edges (both in process map and in statistic):
Process map (nodes & edges)
Statistics attribute panels (why not in Case overview?)
Attribute/Edge Conditional filters
The results are not calculated per single case, but per attribute value, so Case overview and Case/Event metrics are not usable for such calculations.
Attribute conditional filter contains the attribute aggregation inside the single case. This explains the applicability of metrics using aggregation by attribute value in this filter.
How do I filter cases with total duration for C activities longer than 1 hour and 30 minutes? The number of events with activity C is not important inside the case. The only criteria is total duration for such events.
The question requires to evaluate data set by single cases. In each case, we look into total duration of all events with activity C and compare it defined limit 1 hour 30 minutes. Case may contain zero, one, or multiple events with activity C, but it isn't relevant.
Case 2
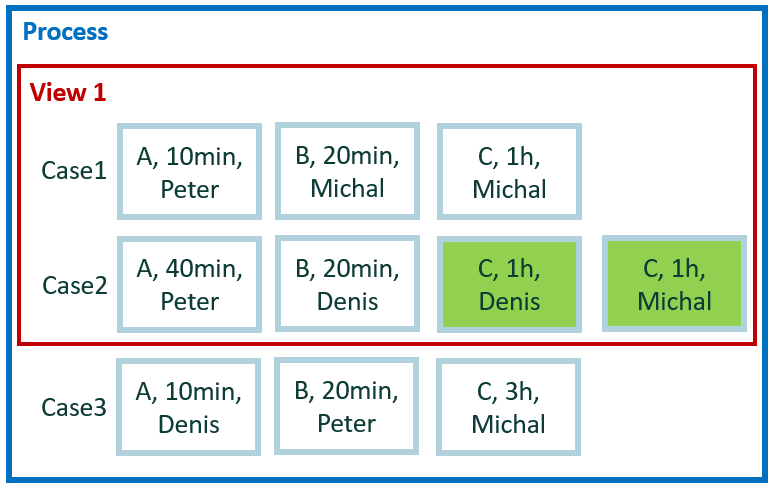
Attribute conditional filter is case level filter, it evaluates the single cases. For each case it calculates the result per selected attribute value (activity C in our example) and compares the calculated result to filter requirement (greater than 1 hour 30 minutes). As case may contain multiple events, which fits the criteria (activity C), these event level values are (have to be) aggregated according to filter requirements (total of all events) to provide single value before comparison to filter requirement.
The filter evaluation at first calculates aggregated result (total) per attribute value (activity C) per case and afterward this result is compared to filter requirements (greater than 1 hour 30 minutes). Therefore, any standard or custom metric that aggregates the results per attribute value is applicable also in attribute conditional filter.
Events
Mar 31, 11 PM - Apr 2, 11 PM
The ultimate Microsoft Fabric, Power BI, SQL, and AI community-led event. March 31 to April 2, 2025.
Register today