Note
Access to this page requires authorization. You can try signing in or changing directories.
Access to this page requires authorization. You can try changing directories.
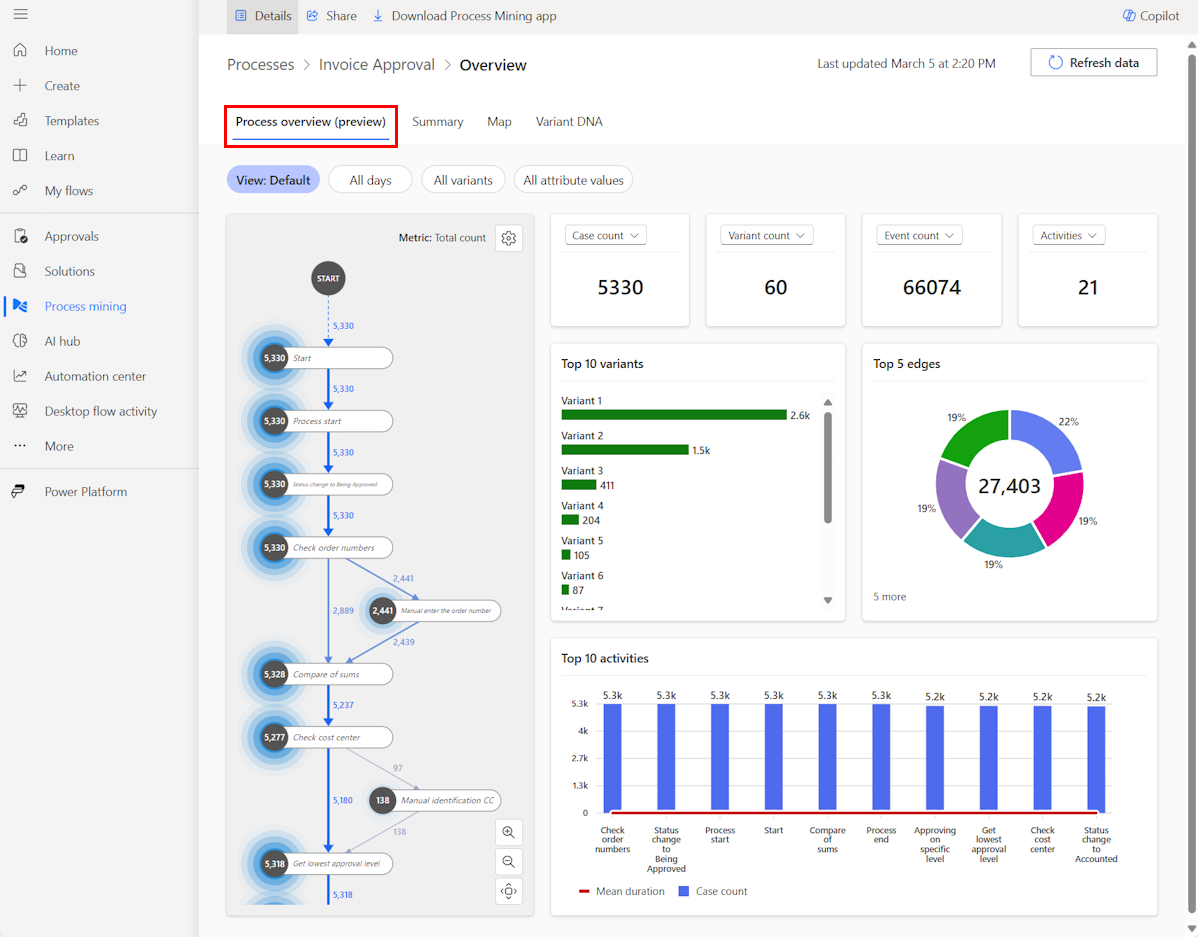
After you import process data, the Process overview tab displays. This tab contains metrics and visuals to gain insights from process analysis.
Components
This tab displays the process map, key performance indicators (KPIs), and charts related to variants, activities, and edges (paths between two activities).
Process map
The process map empowers you to visualize and gain insights from processes. Activities describe tasks or actions, the sequence of which makes up a business process. By displaying a graphical representation of how your business processes are performed, you can glean insights about where opportunities exist.
A process map offers a visualization of different metrics grouped into four (4) layers or context types—performance, frequency, finance, and rework. It's possible to select the same or different metrics for nodes (activities) and paths (edges). To automatically set complexity of the displayed map, you can turn on autoslider settings. These settings are on by default. It automatically displays only most relevant (frequent) process map elements. When the autoslider setting is turned off, you can manually set sliders for activities and paths to control how many activities or paths display.
Learn more about the process map visual in (Process map overview).
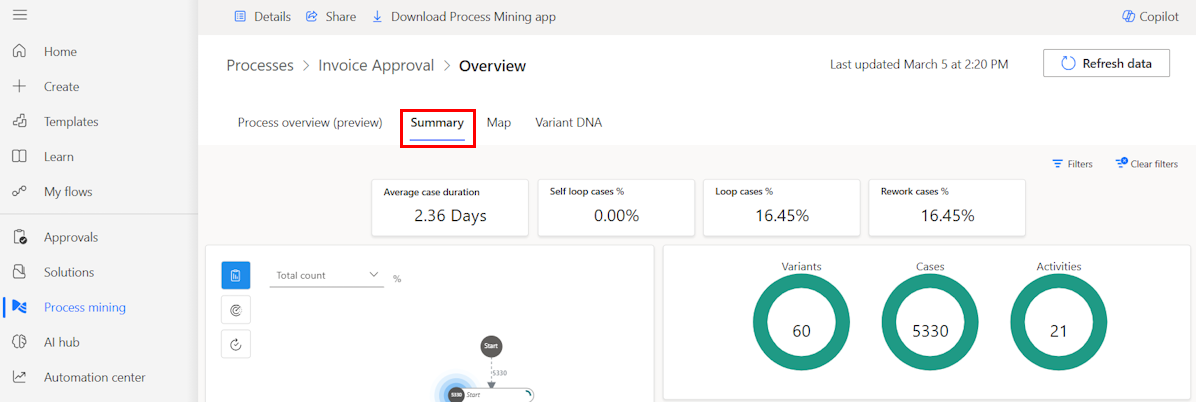
Key performance indicators (KPIs)
The Process overview (preview) tab contains four (4) tiles to display global KPIs for the imported process. In each tile, you select one of the process KPIs. These are grouped into three (3) categories.
Process
- Event count: Event count in actual process view.
- Total Event count: Event count in actual process.
- Case count: Case count in actual process view.
- Total Case count: Case count in actual process.
- Activities: Count of activities in actual process view.
- Resources: Count of resources in actual process view.
- Variant count: Count of variants in actual process view.
Duration
- Median case duration: Median case duration for cases in actual view.
- Average case duration: Mean case duration for cases in actual view.
- Average active time: Mean active case for cases in actual view.
- Average waiting time: Mean waiting time for cases in actual view.
- Average utilization: Mean case utilization for cases in actual view.
Type
- Start: Start of the process, defined by a timestamp of the earliest event in the process.
- End: End of the process, defined by a timestamp of the latest event in the process.
- Relative case rework count: Ratio of process cases which contains rework. Rework is any repeated activity.
- Relative case self-loop count: Ratio of process cases with self-loop. Self-loop is a specific repetition where an activity is directly followed by the same activity.
- Relative case loop count: Ratio of process cases with loops. Loop represents repetition where activity isn't directly followed by the same activity (at least one other activity is between them).
Charts
Charts components visualize the following KPIs:
- Top 10 variants: Case count distribution for top 10 variants.
- Top five (5) edges: Total counts for the five (5) most frequent edges in the process.
- Top 10 activities: Displays mean duration and case count for the top 10 most frequent activities.
Filter pane
The topmost part of the Process overview (preview) tab contains a filter pane. There are four filters in total for filtering:
- View: Select the process view. Process always contains at least one view.
- Date & time: Filter view data based on event's time.
- Variant: Filter data based on view variants.
- Attribute filter: Filter data based on attribute values. It's possible to filter data using any process attribute.
Embedded Power BI tabs
As part of process import, a Power BI report is generated with the process insights. This report is accessible through tabs next to Process overview. Generation of a Power BI report represents the last step, so it's usually available later than the Process overview tab.
Learn more in Visualize and gain insights from Power BI report.